-
-
The Rush
Inspiration
BART has a money problem. Fares brought in $243.9M in fiscal 2025 and covered 23% of operating costs, and the fiscal 2027 gap is about $375M. BART pays for every car it runs, full or empty. So we asked one question: how many cars does each station and hour actually need?
What it does
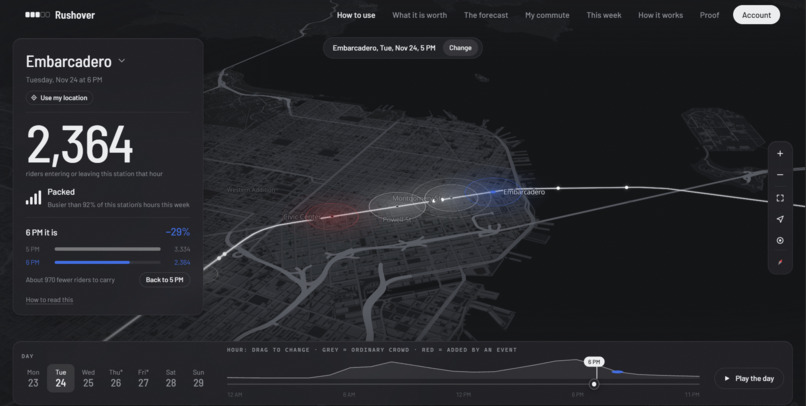
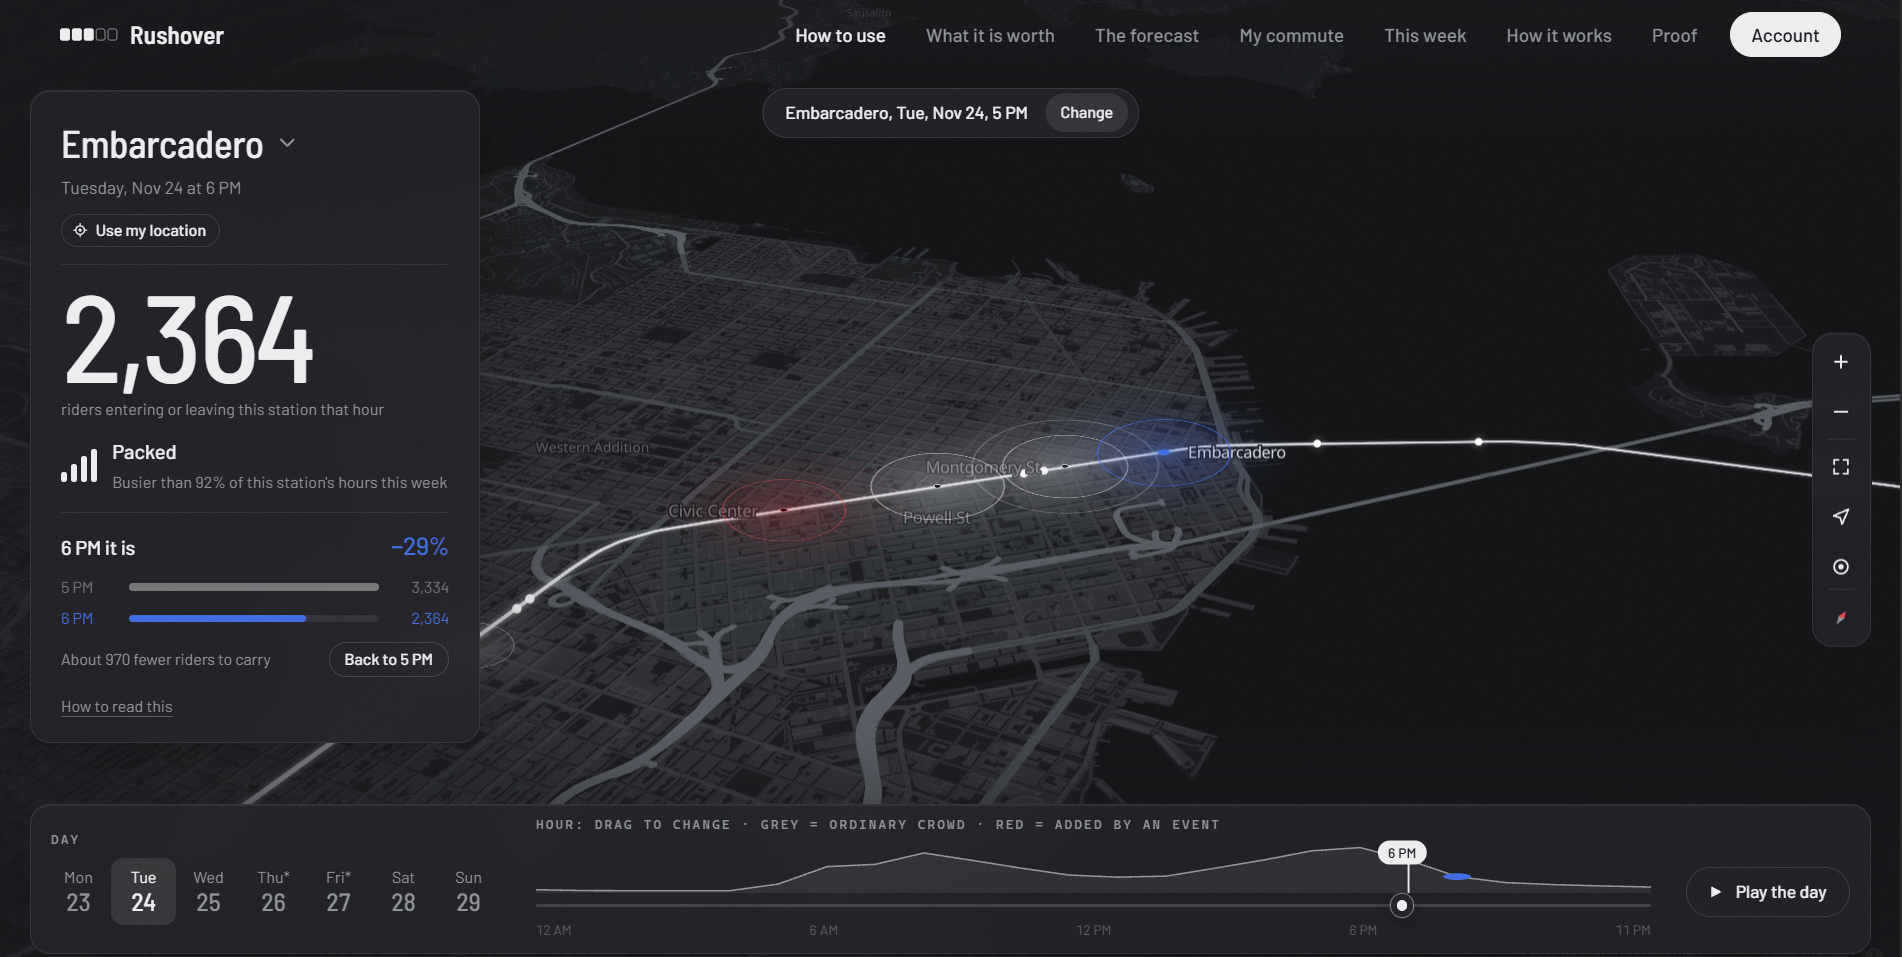
Rushover forecasts riders at all 50 BART stations, hour by hour, a week ahead, and turns that forecast into a capacity plan.
Capacity is planned as expected riders plus a safety margin. The worse the forecast, the bigger the margin has to be. We held every plan to the same standard, room for riders in 95% of station-hours in 2025, and measured how much capacity each one needs per rider:
| Plan | Capacity per rider |
|---|---|
| Same hour last week | 1.57x |
| Plain timetable, set twice a year | 1.39x |
| Best timetable, its own margin for every station and hour | 1.32x |
| Weekly rolling rule, no machine learning | 1.30x |
| Rushover, trained on the cost of running short | 1.22x |
That is 5 to 8% fewer cars than the best timetable and 10 to 12% fewer than a plain one. Using BART and FTA published figures, it is about $2.1M to $5.8M a year in electricity alone. BART's own switch to shorter trains in 2023 saved about $12M a year; this is the same lever, set for each day instead of each season. If BART keeps the same number of cars instead, overcrowded hours drop by 61 to 64%.
For the days a timetable cannot know about, such as games and concerts, a set of agents finds next week's events, and our code opens every source page before a claim is kept. No language model ever writes a rider number. It can only scale crowd curves we measured on real games, inside fixed limits.
How we built it
- Data: every BART trip from 2021 through 2025 (222 million, by origin, destination and hour), five years of hourly weather, 757 games with start times and attendance, and BART's published timetable.
- Forecast: five forecasters blended: gradient-boosted trees, a small transformer, deep feed-forward networks, and similar-day matching by cosine similarity. On 2025, a year the models never saw, the blend is off by 12.7%. Using the same hour last week is off by 20.1%.
- Capacity model: gradient-boosted trees retrained with a 95th-percentile loss, so the model learns where the margin is needed instead of adding the same percentage everywhere.
- Events: league schedule feeds and web search, three specialist agents (crowd, access, timing) running in parallel, a lead agent that checks them against measured curves, and guardrails in code.
- Testing: no random split, because last week's counts are inputs and a random split leaks the future. Every choice was made on 2024, and 2025 was scored once.
- Site: plain HTML, CSS and JavaScript, reading the measured results as JSON.
Challenges we ran into
- Our first answer failed. Sizing cars from our best average forecast only tied a good timetable, 1.32 against 1.32. A forecast trained to be right on average is the wrong tool, because running short costs more than running long. Retraining on that cost is what worked.
- Our first transformer lost to the trees (13.7% against 13.1%) until we added deeper networks and blended.
- Of 23 corrections we tested for things like conventions, gas prices and festivals, 20 did nothing or hurt.
- The search agent once invented a link to a page that did not exist. Now our code opens every page.
- We assumed nobody rides after midnight. Nine million trip rows showed 31% of concert riders leave in the midnight hour, so we threw out our own "stranded riders" estimate.
Accomplishments that we're proud of
- An independent re-check of our own work reproduced every capacity number exactly and found no leakage. It also found a stronger plain rule than ours, a weekly rolling one. We added it to the results: Rushover still needs 4 to 6% fewer cars.
- The event layer cut the busiest-hour error on Giants game days at Embarcadero from 17.2% to 9.6%.
- With football data hidden, the agents reasoning from baseball alone cut the error on Cal football games from 34.3% to 23.5%.
- Given only a date, a station and an hour, the search agents found the cause of 18 of 24 real 2025 surges, each with a page that opened.
What we learned
- Train on what the decision costs, not on average error.
- Build the strongest simple baseline you can before claiming a win. Ours beat our first model.
- A language model is useful for finding and reading, and should not be trusted with a number.
What's next for Rushover
- Train loads. We see gate entries and exits, not how full each train is between stations. BART has that data.
- Live counts, so the forecast checks itself every day. BART has not published hourly data for 2026 yet, so everything here is tested on 2025.
- A weather forecast in place of the weather that actually happened, which is what the models are given today.
- Car wear and maintenance costs, so the saving is more than an electricity floor.
Built With
- css
- firebase
- gtfs
- html
- javascript
- mlb-stats-api
- numpy
- open-meteo
- pandas
- python
- pytorch
- scikit-learn
