Inspiration
The Canadian startup ecosystem is rapidly evolving, with significant changes in funding trends, investor behaviour, and sectoral performance. However, there is a lack of accessible, data-driven insights to help investors, entrepreneurs, and policymakers make informed decisions. This project was inspired by the need to bridge the gap between raw investment data and actionable intelligence.
What it does
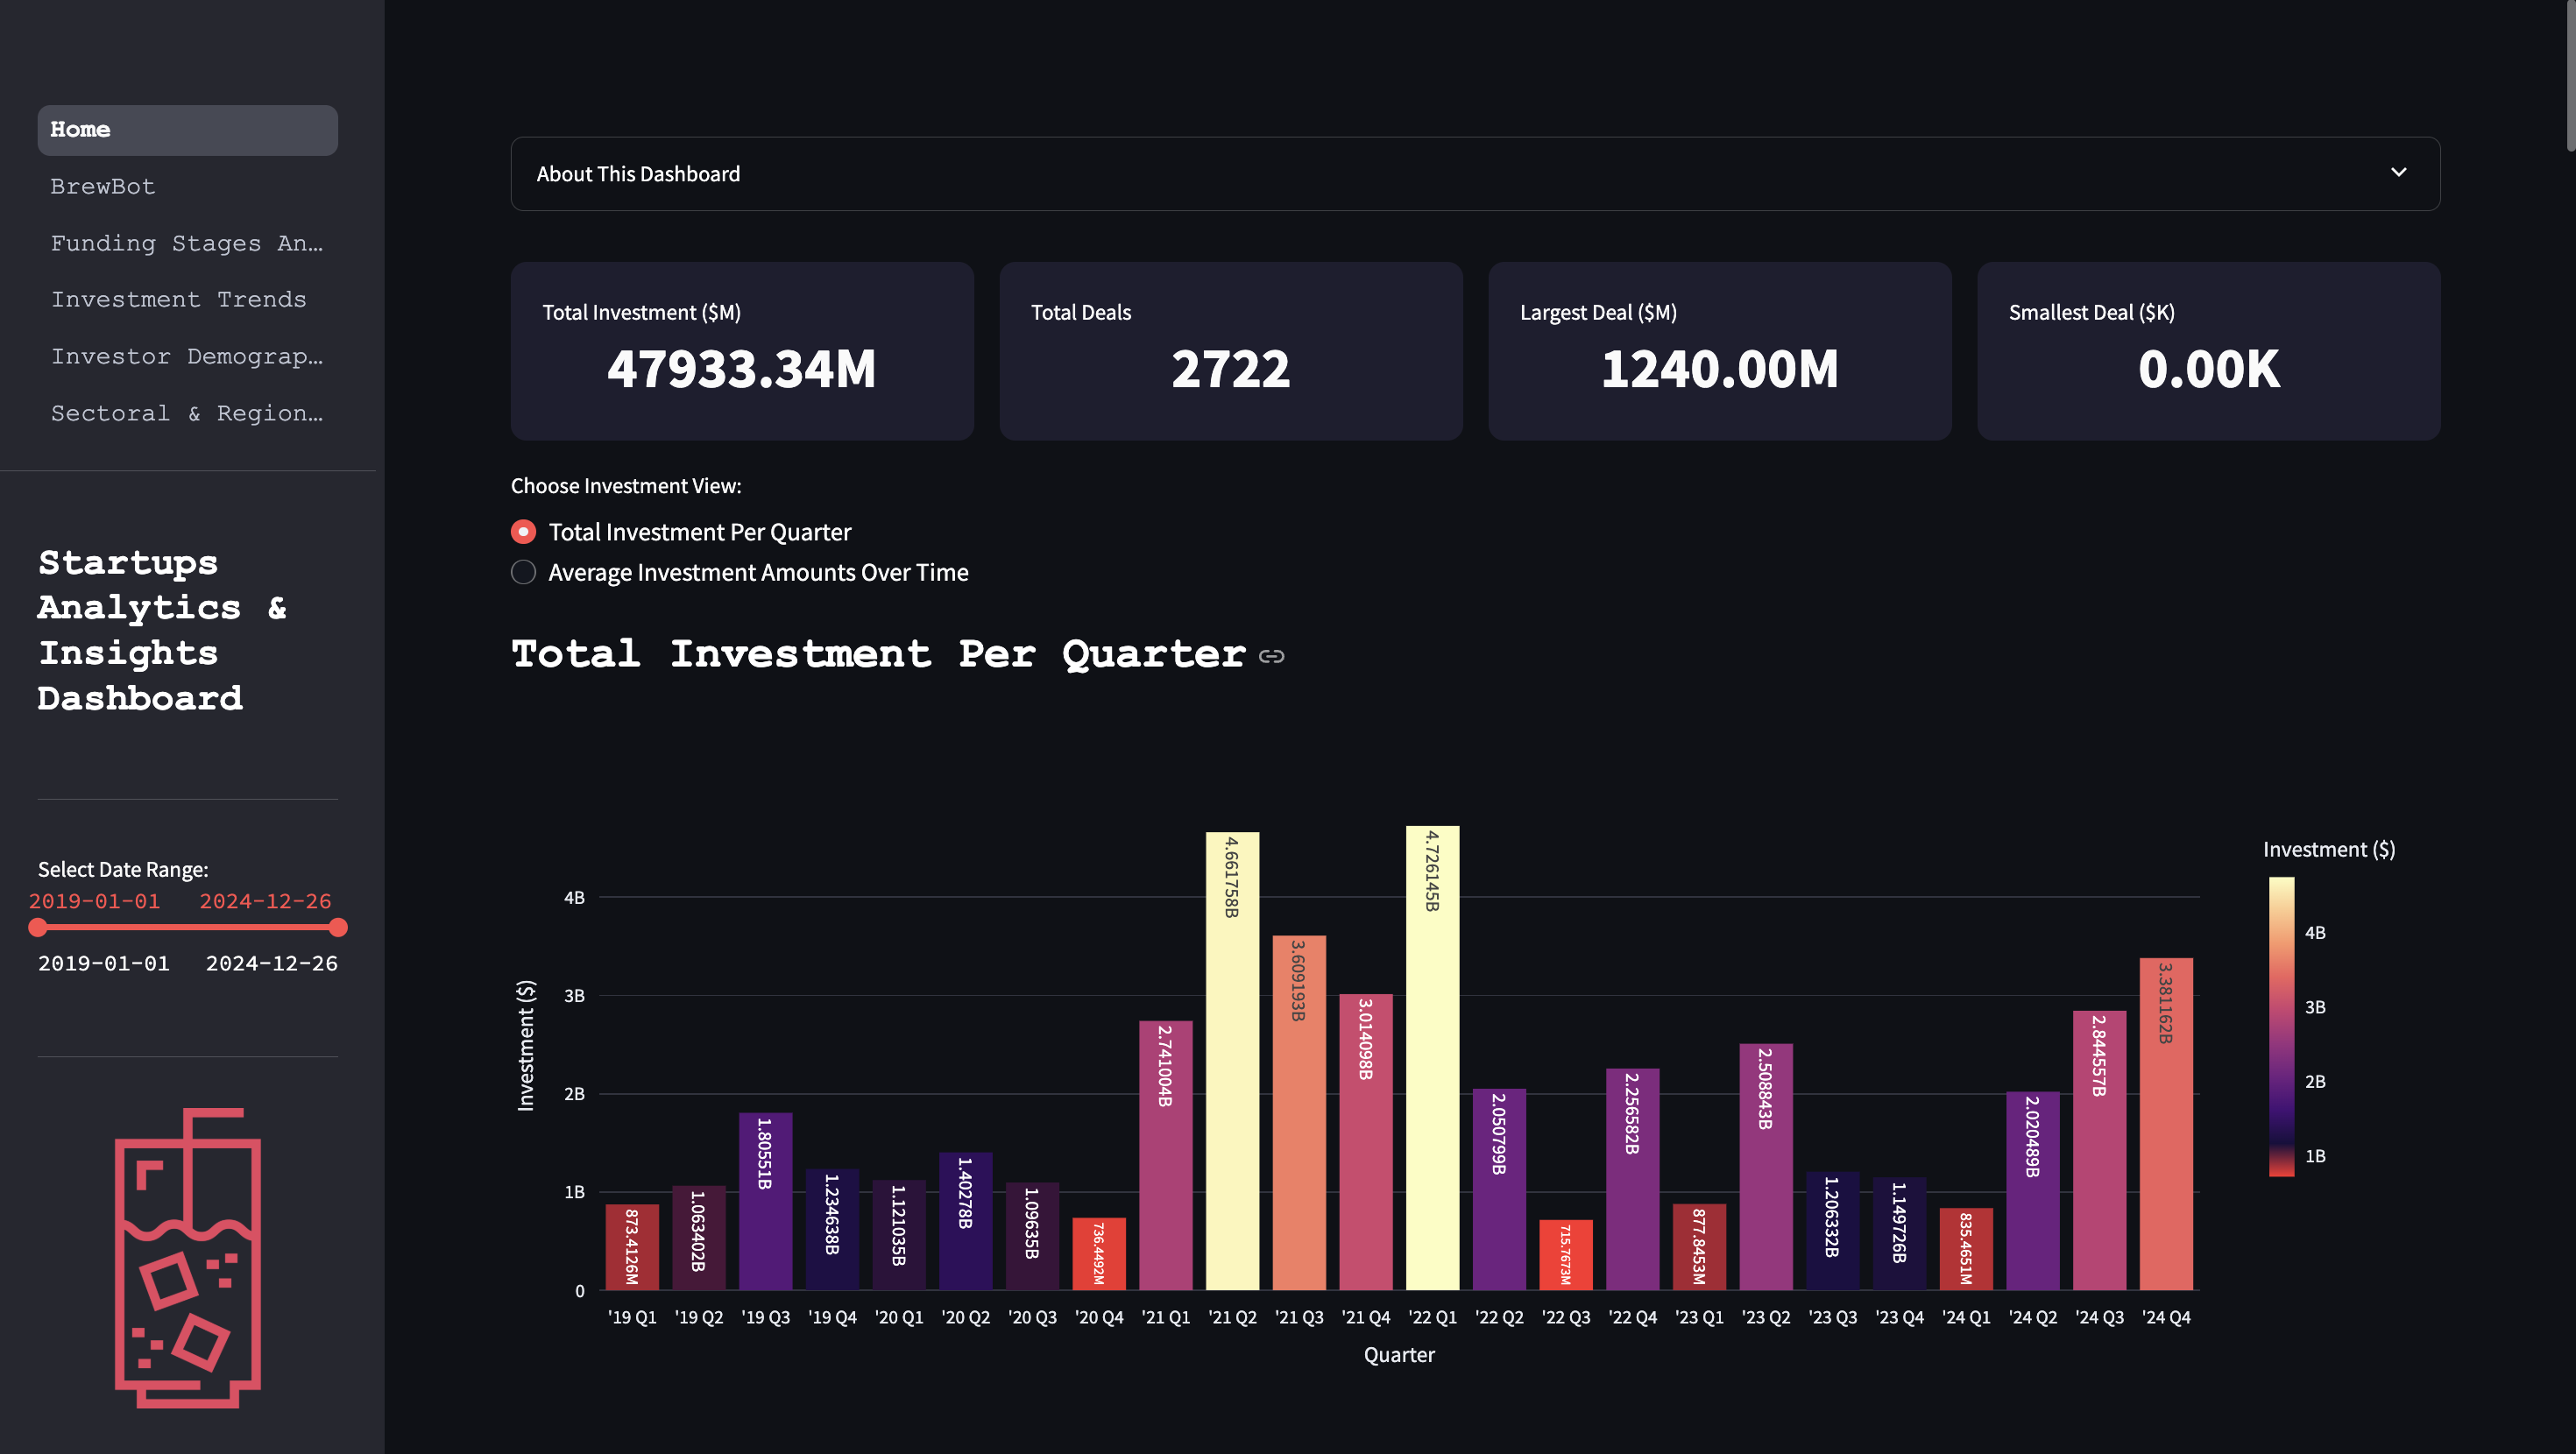
The RunQL - ColdBrew dashboard provides real-time analytics and forecasts for Canadian tech investments. Users can:
• Track funding trends over time (quarterly/yearly).
• Analyze investment patterns by funding stage (Pre-Seed to Series C+).
• Identify top-performing sectors and regional investment hotspots.
• Understand investor behaviour and leading firms.
• Predict future market shifts using machine learning models.
How we built it
• Data Processing: Extracted and cleaned investment data using pandas.
• Backend Analysis: Applied ARIMA models & linear regression for forecasting.
• Visualization: Used Plotly & Streamlit to create interactive graphs.
• Deployment: Designed an intuitive dashboard with Streamlit for real-time exploration.
Challenges we ran into
• Data Limitations: Some datasets lacked sufficient historical data for accurate long-term forecasting.
• Platform Constraints: RunQL’s Python integration required adapting the workflow to work within the environment.
• Design Optimization: Ensuring clear, informative visualizations without overwhelming users.
Accomplishments that we're proud of
• Successfully built a fully interactive investment analytics dashboard.
• Integrated predictive modeling to provide data-driven investment insights.
• Created a system that allows users to customize their analysis by sector, region, and funding stage.
What we learned
• Optimizing data processing for investment trend analysis.
• Effective visualization techniques for financial datasets.
• Balancing user-friendly design with in-depth analytics.
What's next for RunQL - ColdBrew
• Enhanced forecasting models incorporating macroeconomic indicators.
• Deeper investor profiling to map relationships between firms and funding success.
• Expanding regional analysis to include more granular investment data.
• Deployment on RunQL’s platform for seamless, in-app insights.
Built With
- pandas
- pyplot
- python
- scikit-learn
- sql
- streamlit

Log in or sign up for Devpost to join the conversation.