Inspiration
Potholes and washed-out roads share a cause: water that does not drain. The places that know which roads are in trouble are the places that get inspected, and that is a small share of the map.
- The state inspects its own roads. NCDOT rates each stretch from 0 to 100.
- City streets have no public ratings.
- Cameras see very little. NCDOT has about 1,150 traffic cameras, mostly on interstates.
So repairs stay reactive: a road gets attention after a 311 call, or after a storm like Hurricane Helene has already taken it. For the Center for Geospatial Analytics track we asked a simple question. Can the roads that are inspected teach a model what age, traffic and the shape of the land do to pavement, so the roads nobody is watching get a score too?
What it does
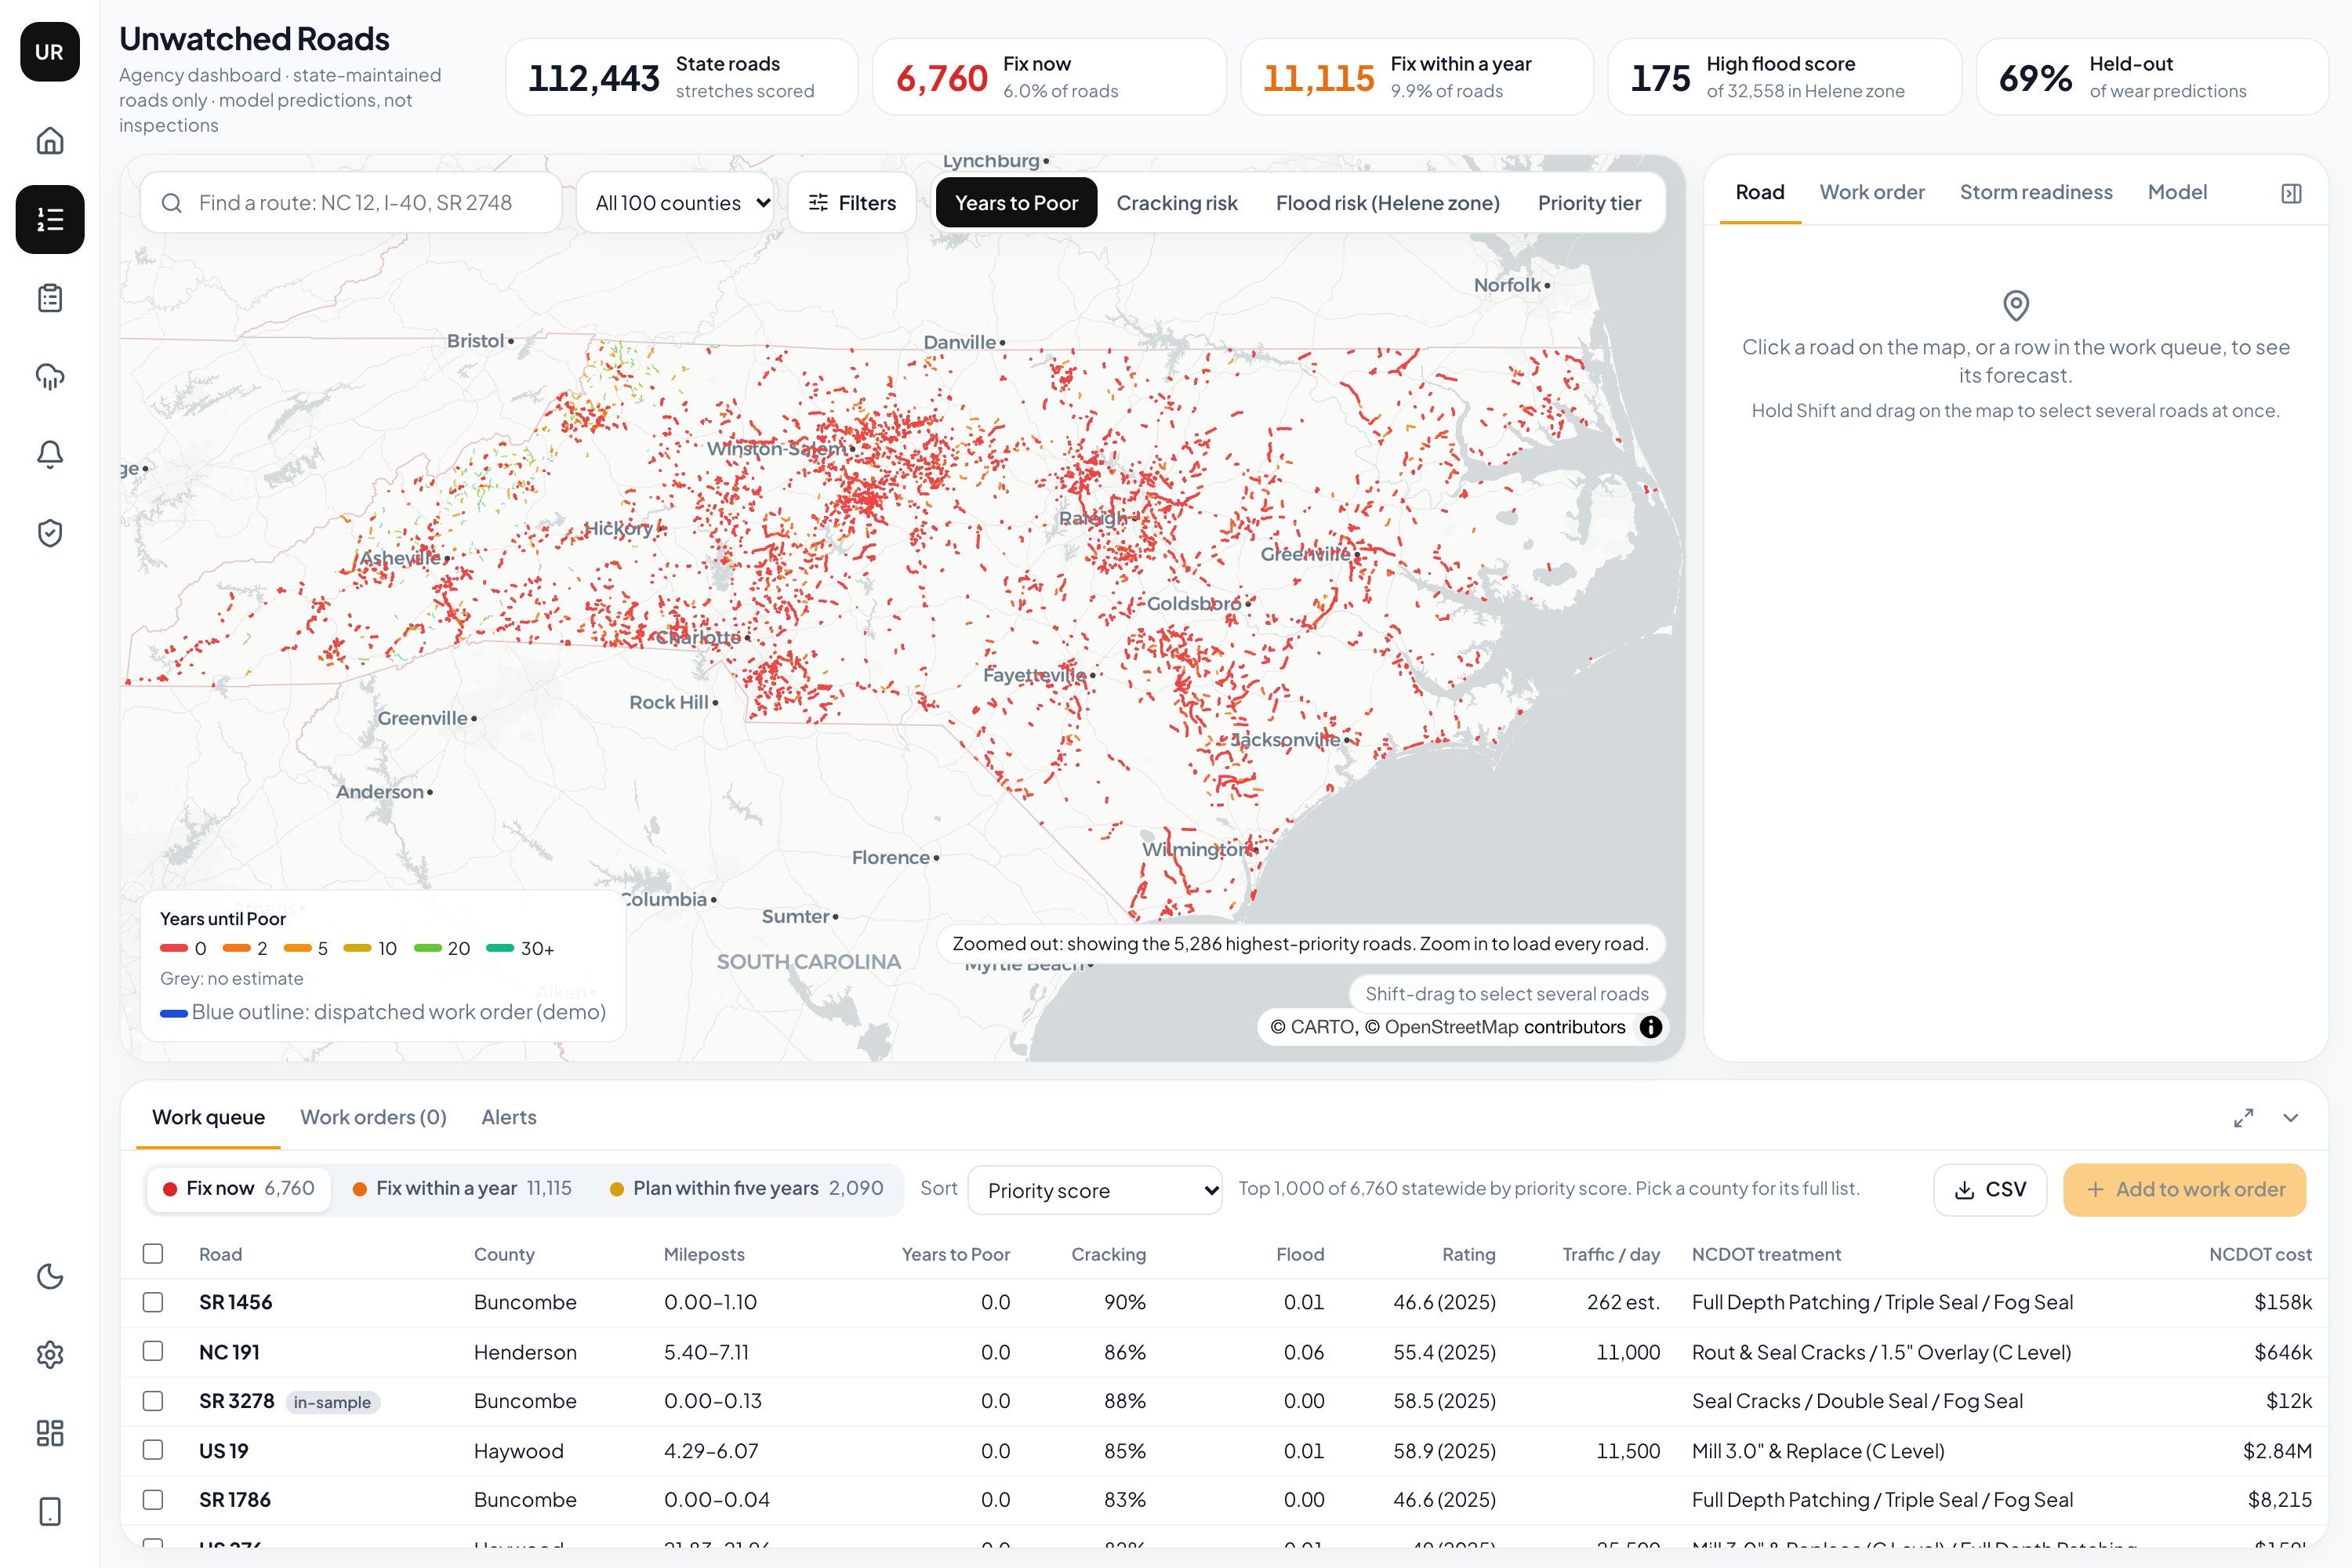
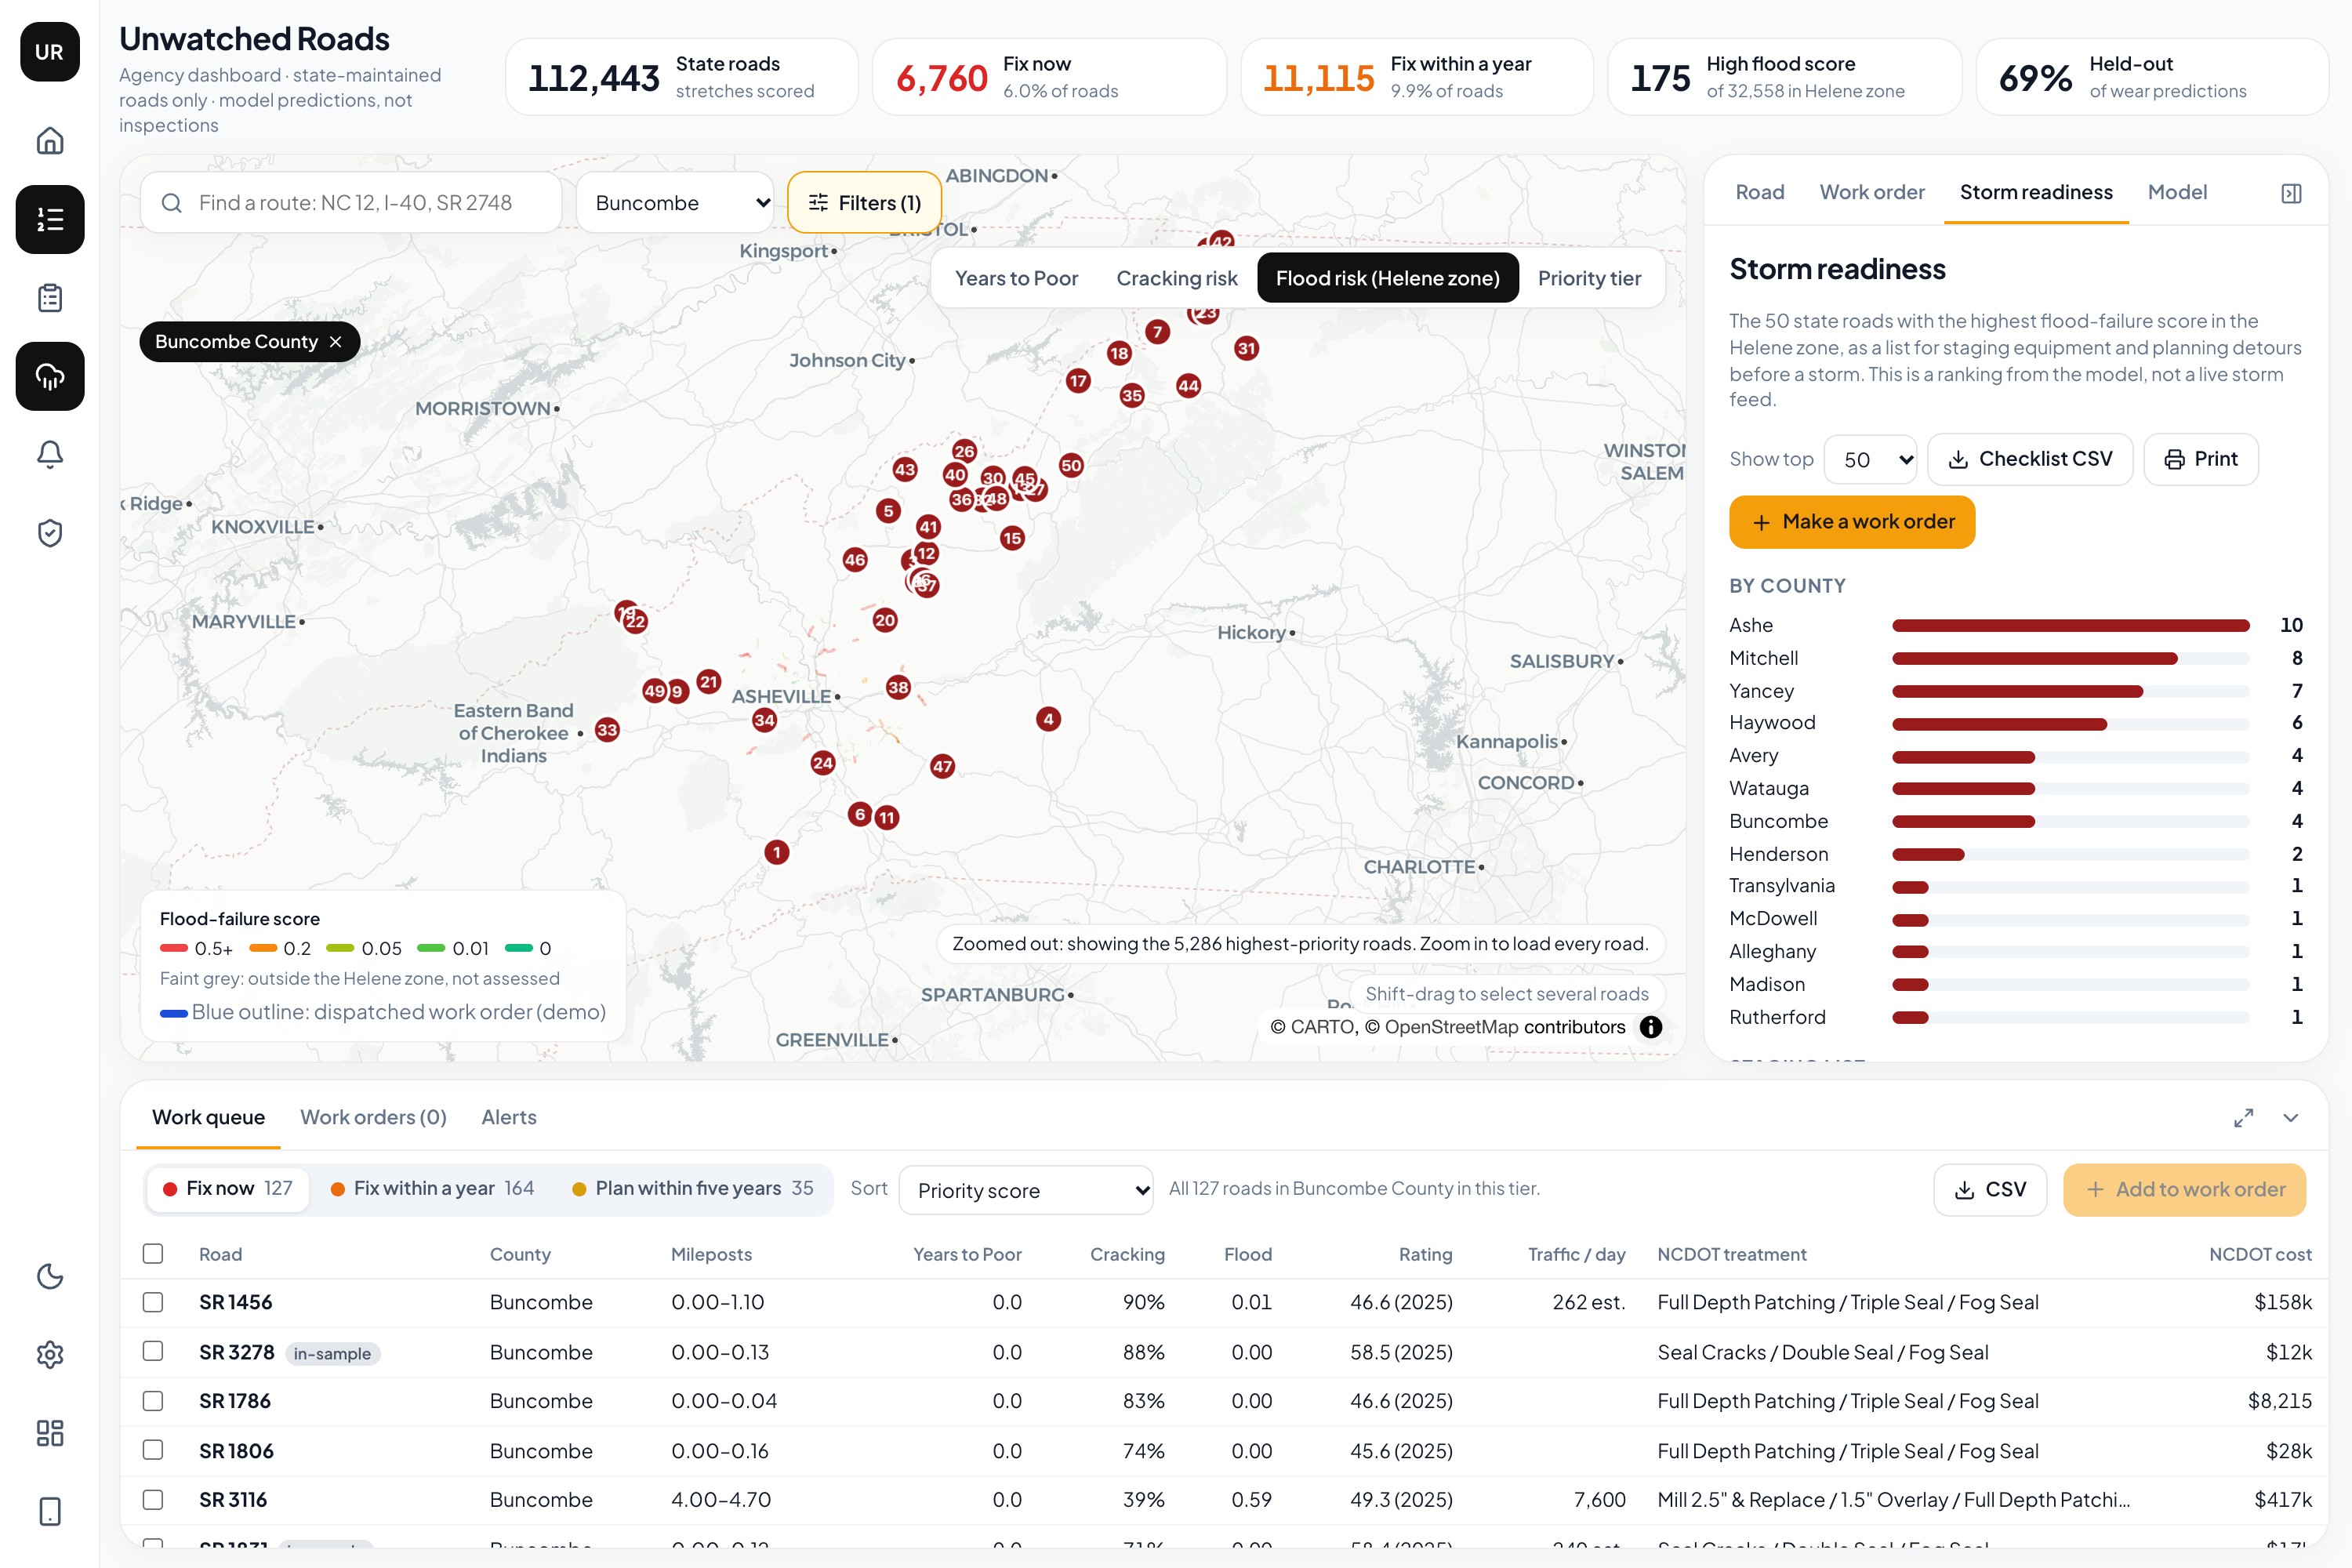
Unwatched Roads scores all 112,443 state-maintained road segments in North Carolina (about 80,000 miles, all 100 counties). Each road gets three predictions:
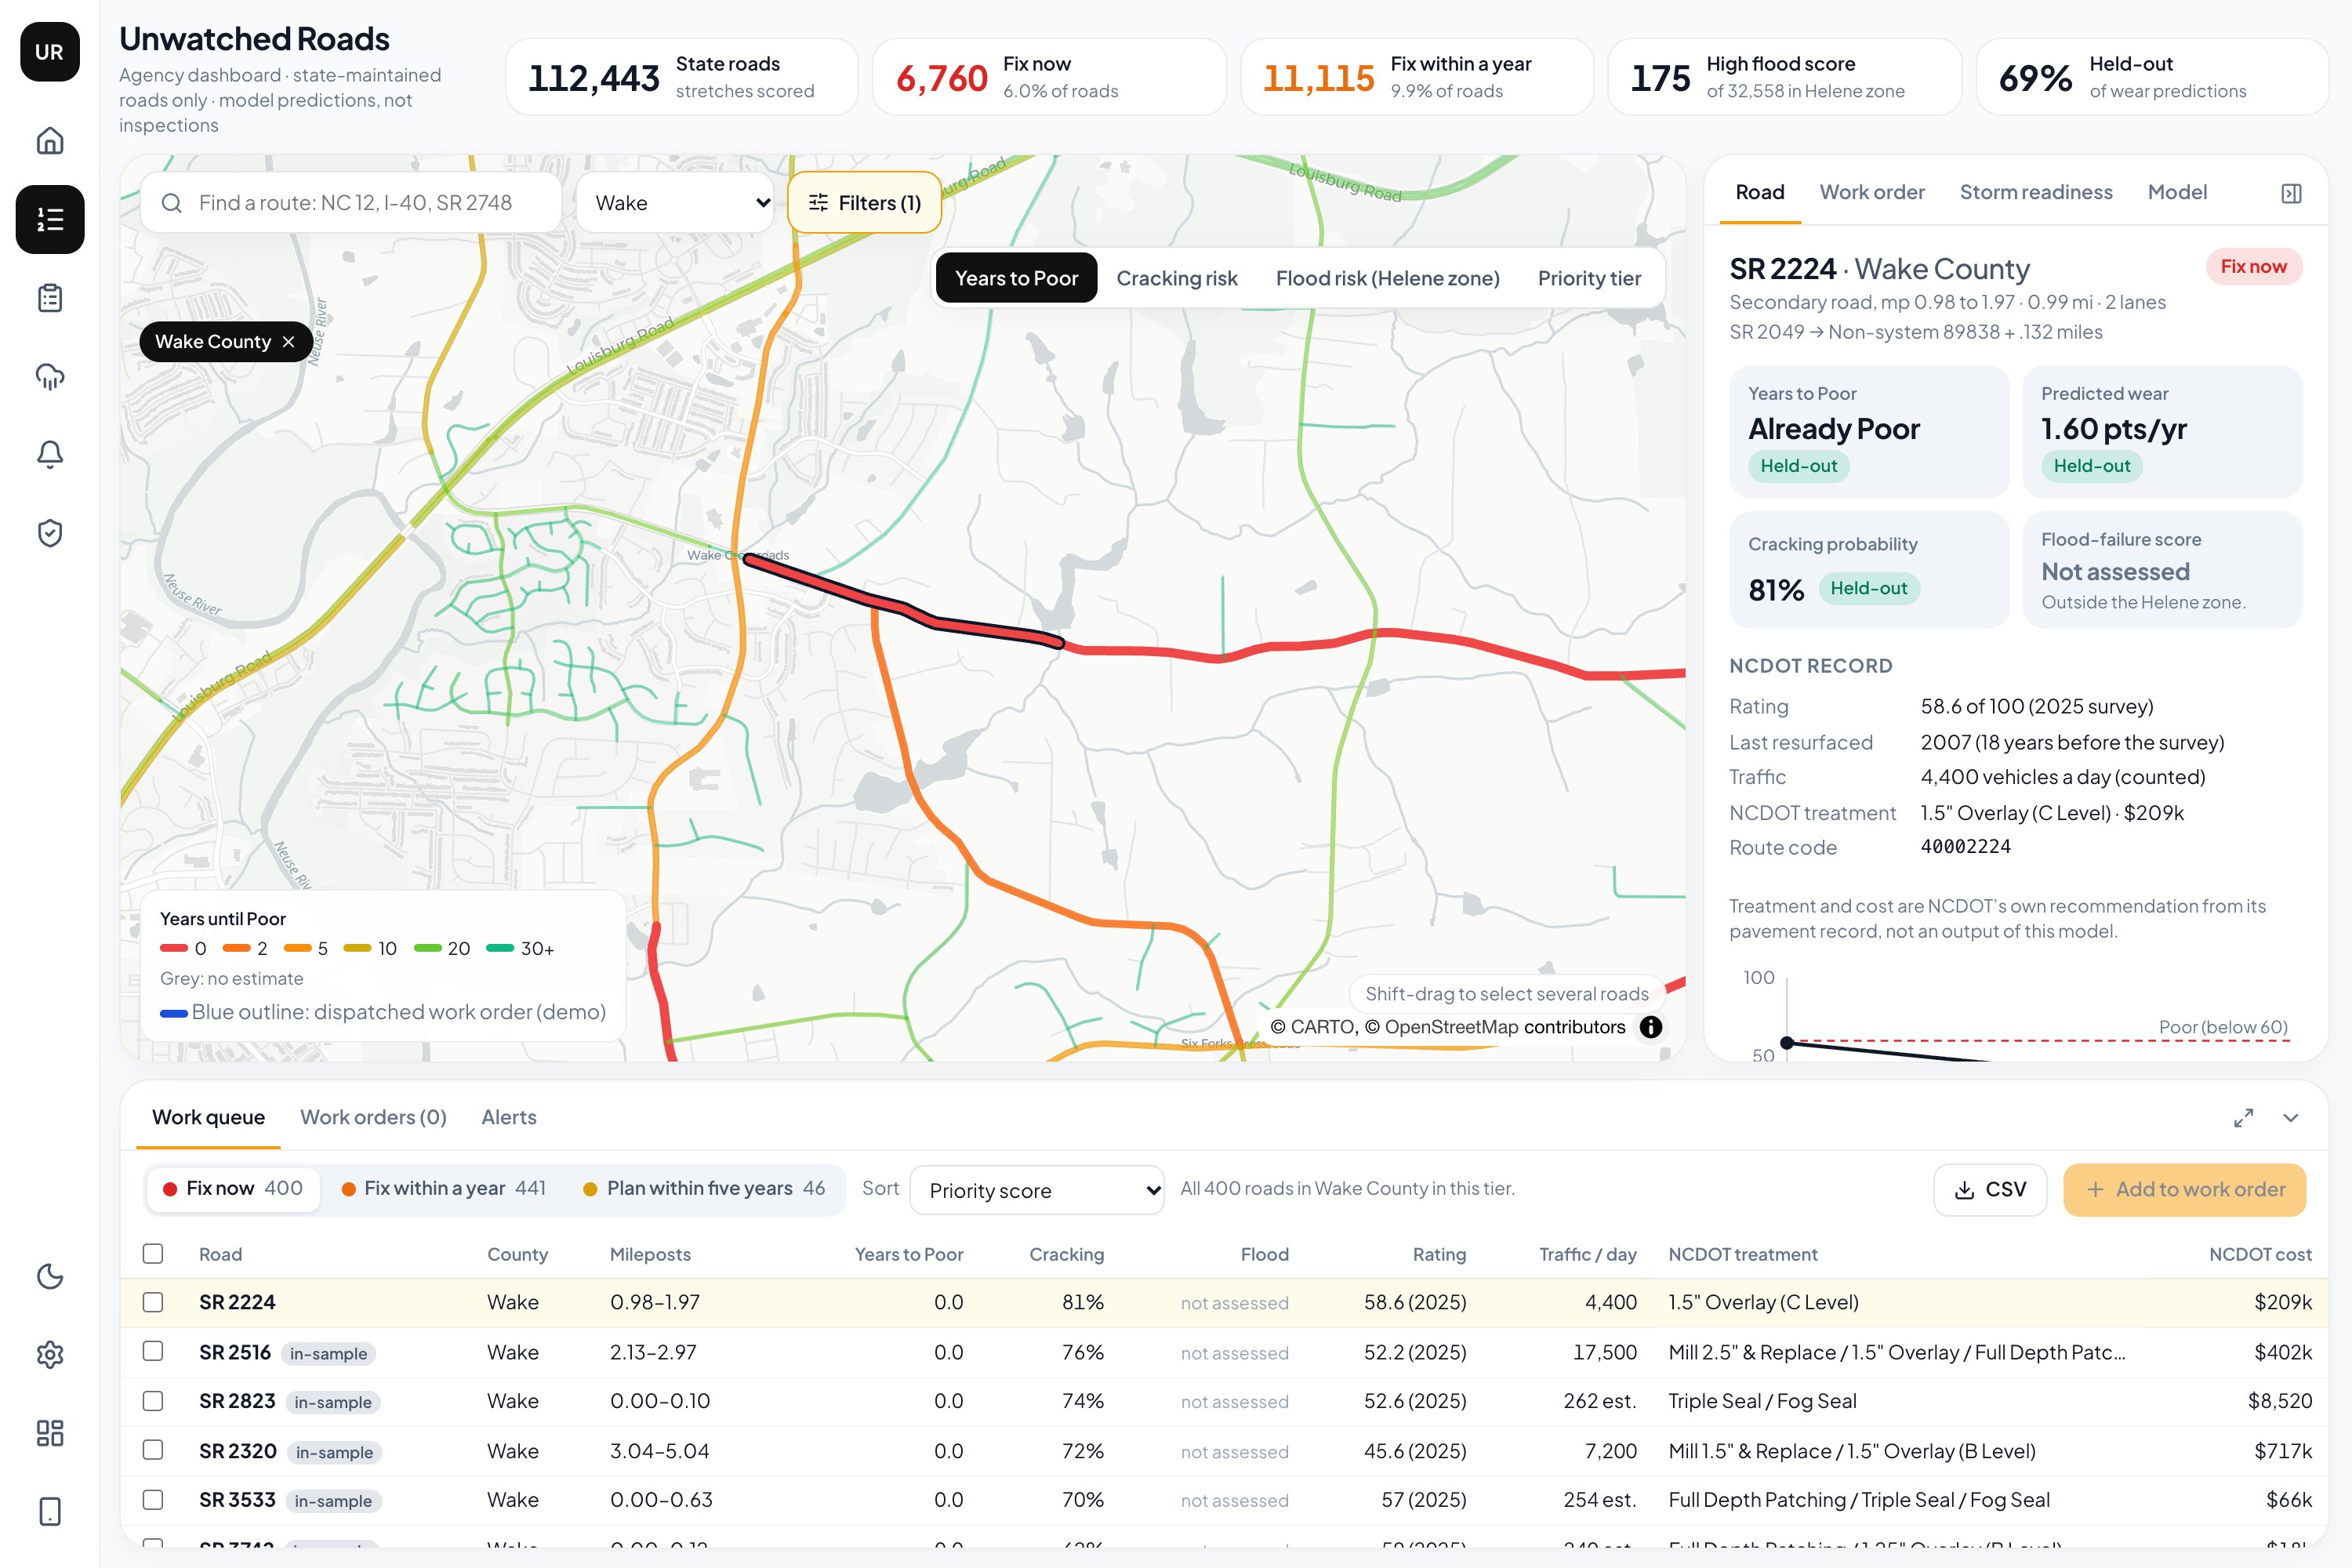
- Wear: how many rating points it loses a year, and how many years until NCDOT would call it Poor.
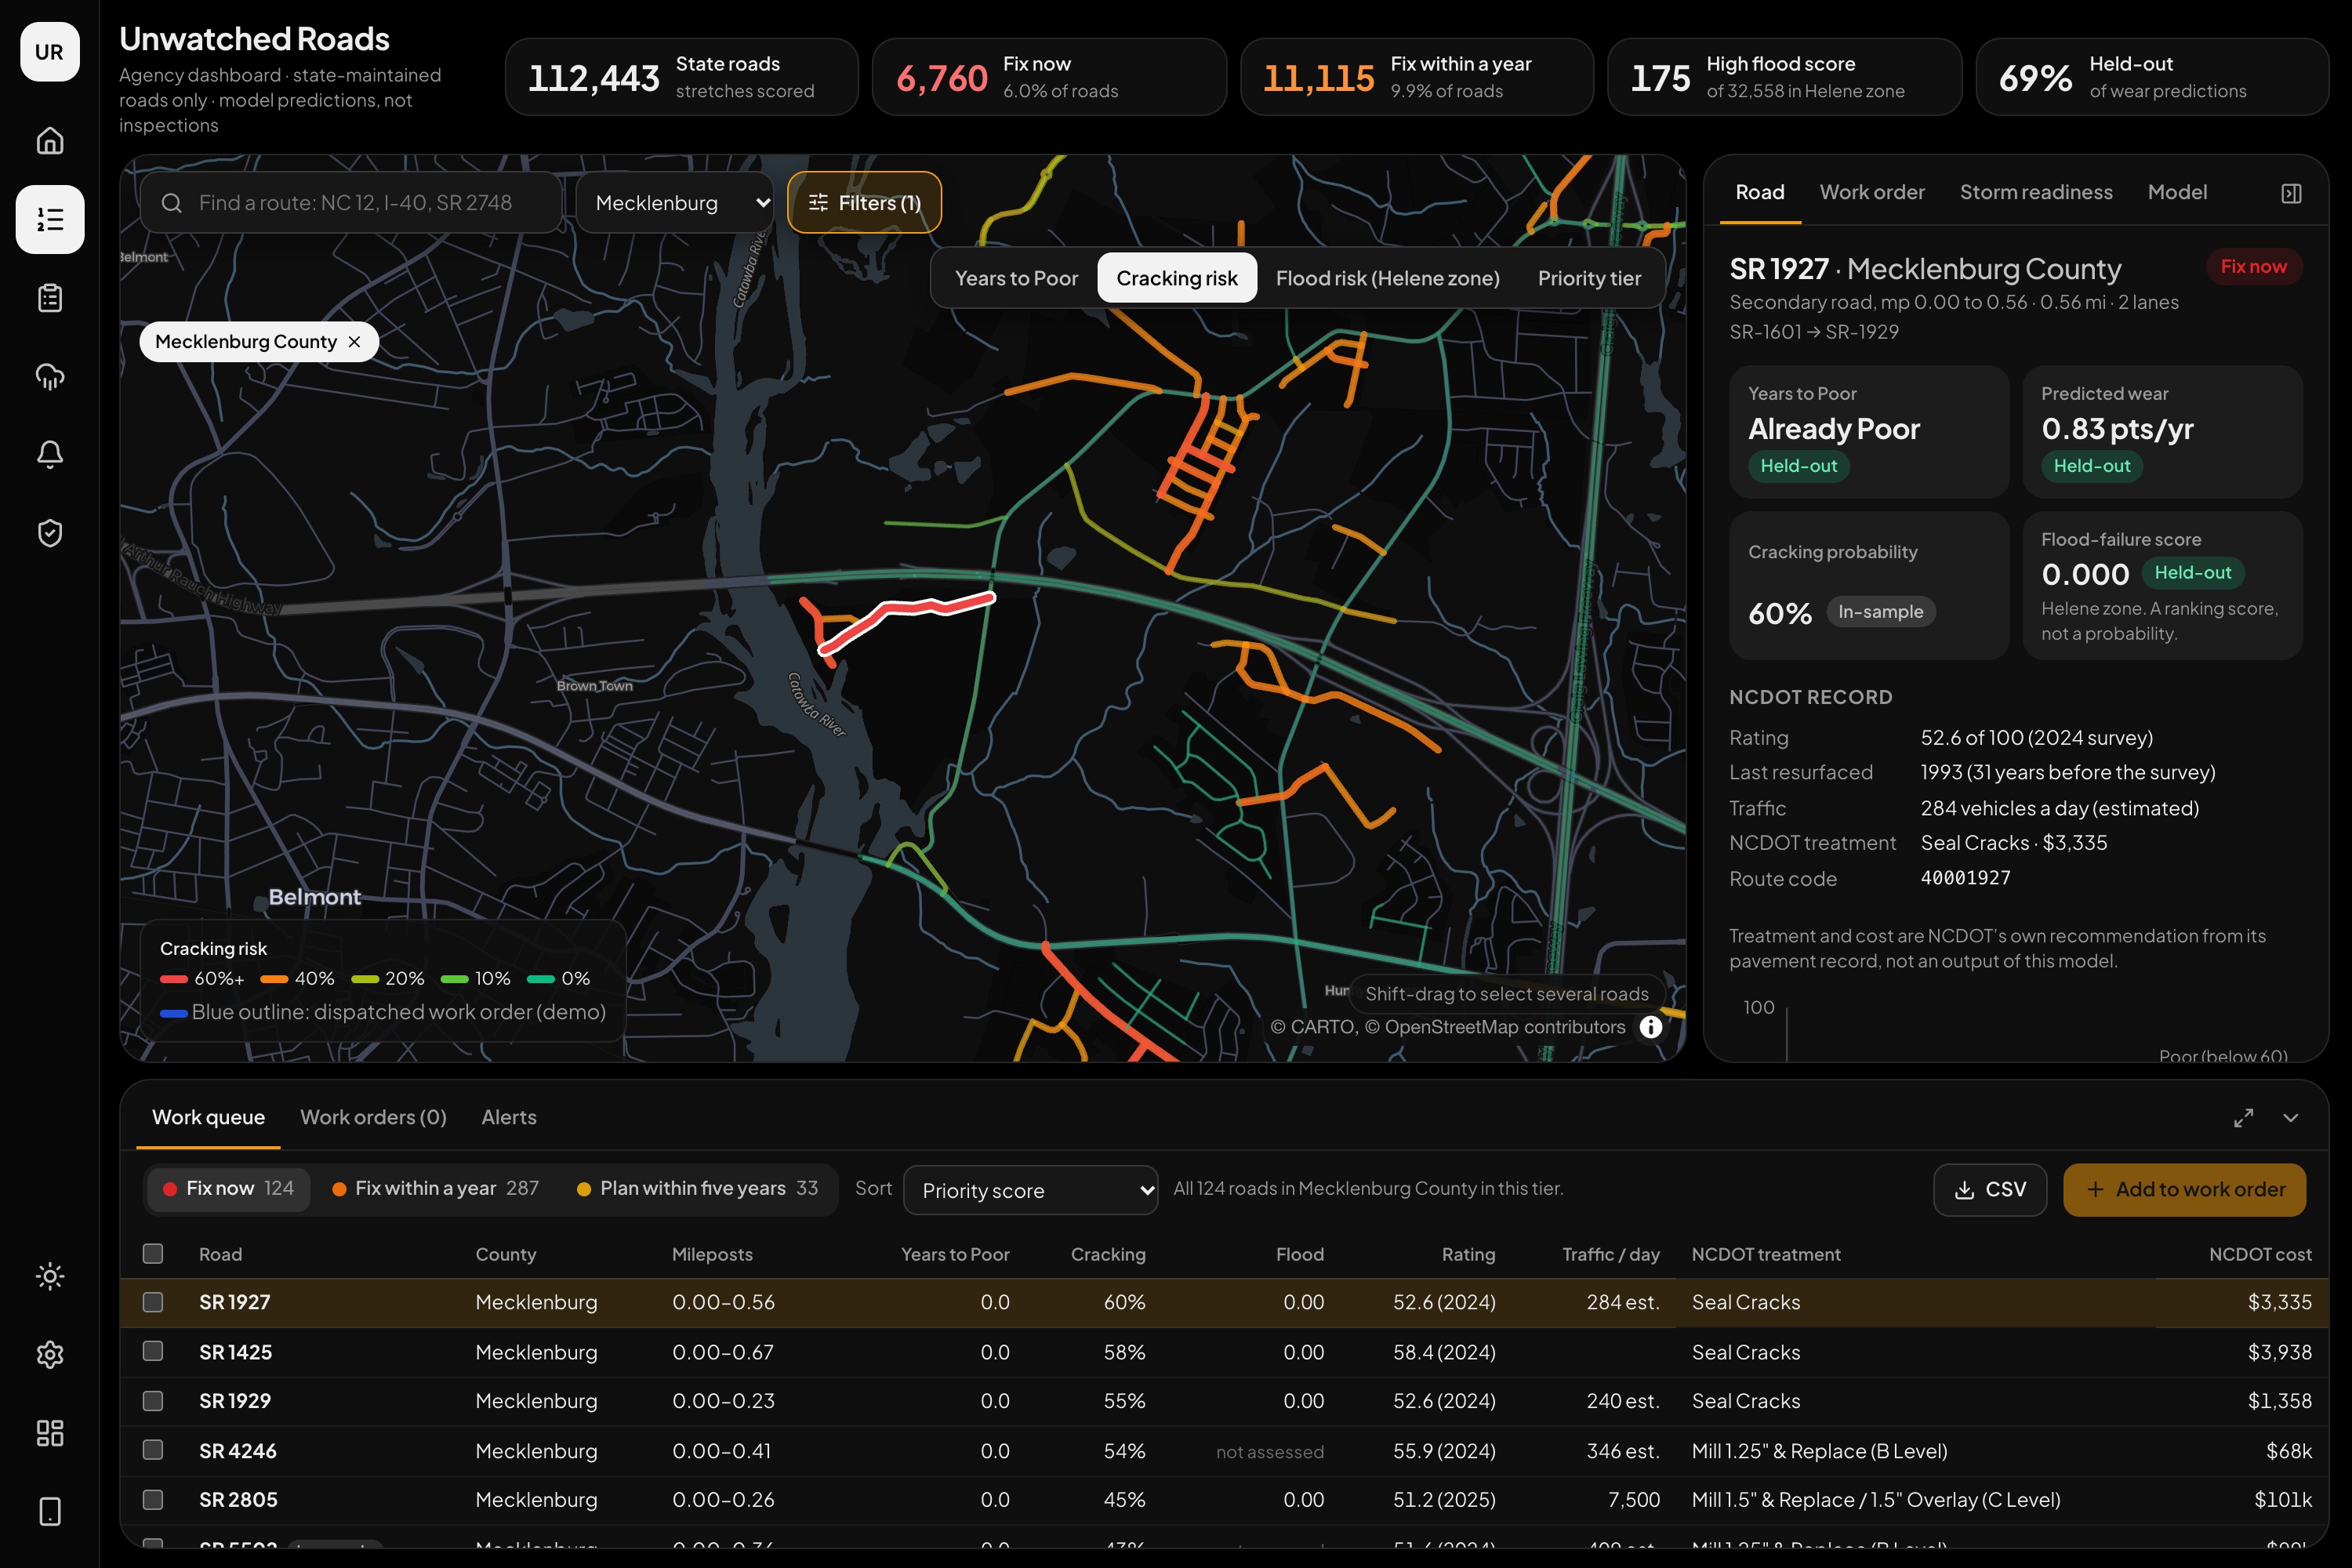
- Cracking: the chance it has serious alligator cracking.
- Flood failure: for the 32,558 roads in the Hurricane Helene zone, how likely it is to wash out.
Those predictions drive three views of one web app:
- Agency dashboard (
/gov): a statewide map, a ranked work queue (6,760 roads to fix now, 11,115 within a year), work orders, CSV export, and a storm-readiness list of the 50 riskiest roads to stage crews near. - Phone view (
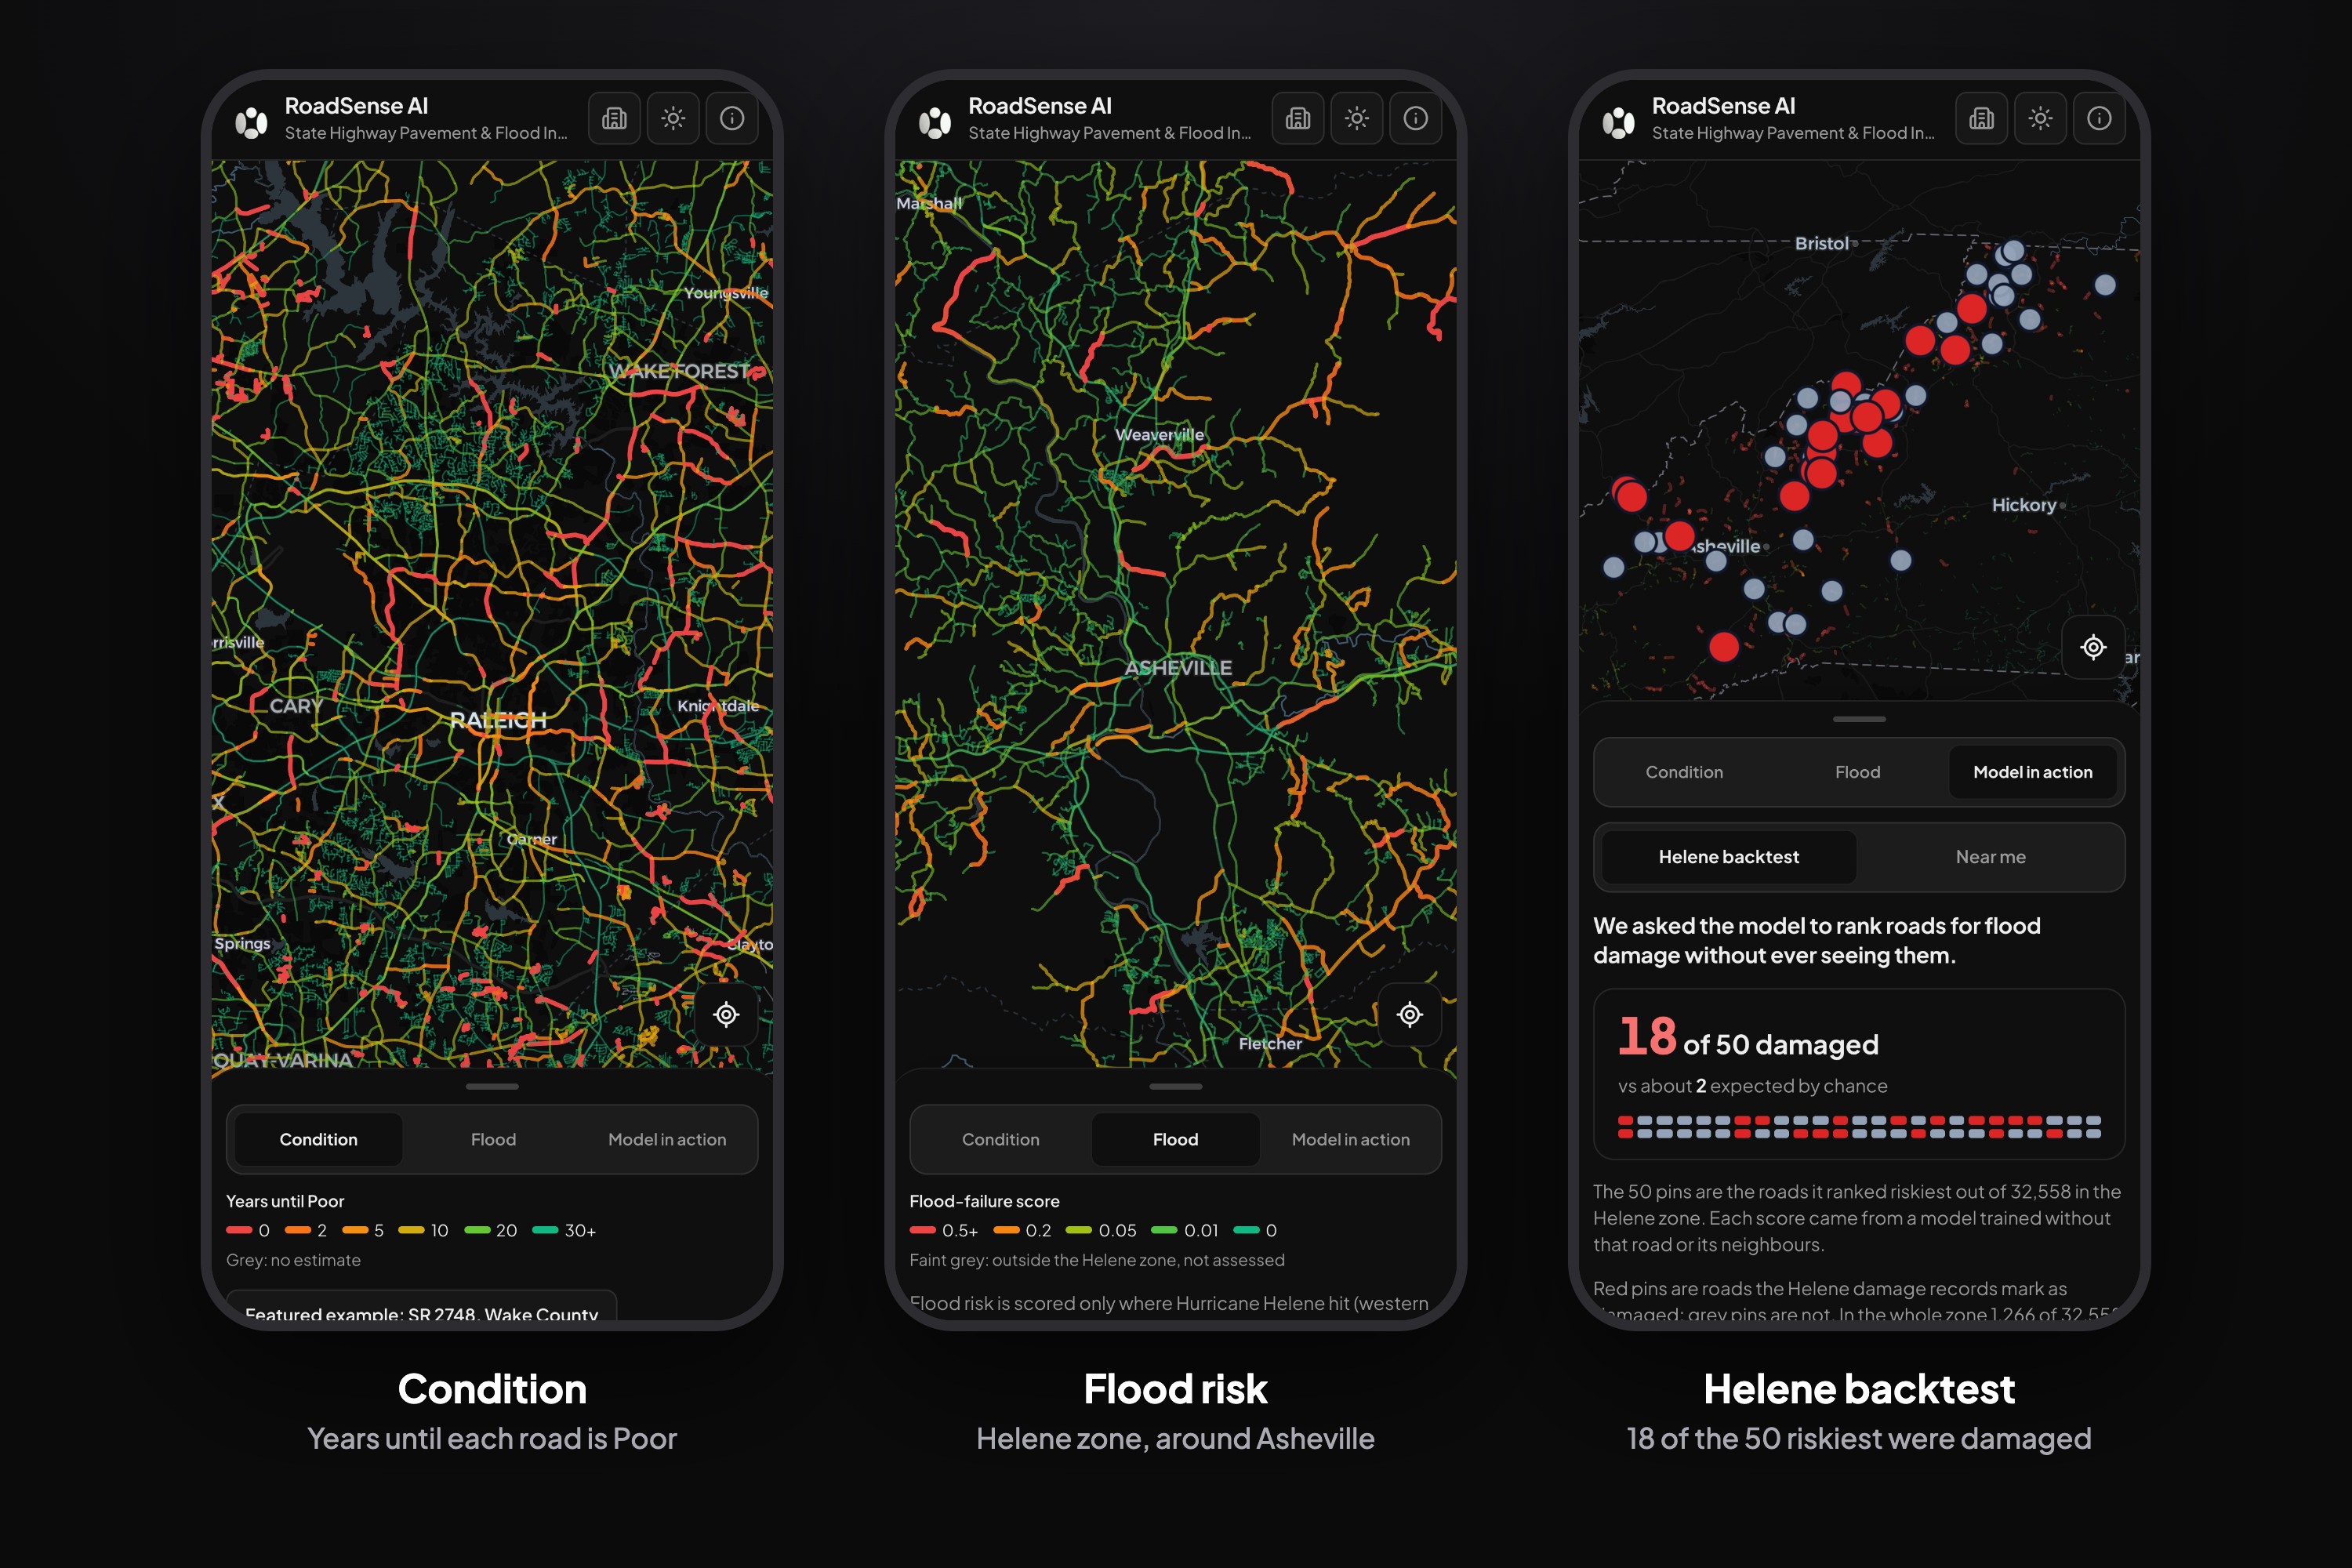
/m): the same map for the field, plus a Helene backtest you can reveal yourself. - Executive view (
/dashboard): a concept for safest-route navigation with live weather. The route comparison there is a design demo, not model output.
A second model reads a roadside camera photo and says whether the road is flooded and how deep the water is.
How we built it
Data, all public. NCDOT Pavement Condition Survey, USGS 3DEP elevation (30 m), USDA NAIP 2022 aerial imagery, Hurricane Helene damage records from NCDOT, the NC Geological Survey and USGS high-water marks, Charlotte and Raleigh pothole reports, NCDOT traffic cameras, and ten coastal roadside cameras paired with water-level sensors.
Models. LightGBM on pavement age, traffic and terrain features (elevation, slope, relief, height above the nearest low ground). A DINOv2 vision transformer (PyTorch, timm) for the camera flood reader and for the aerial photo test.
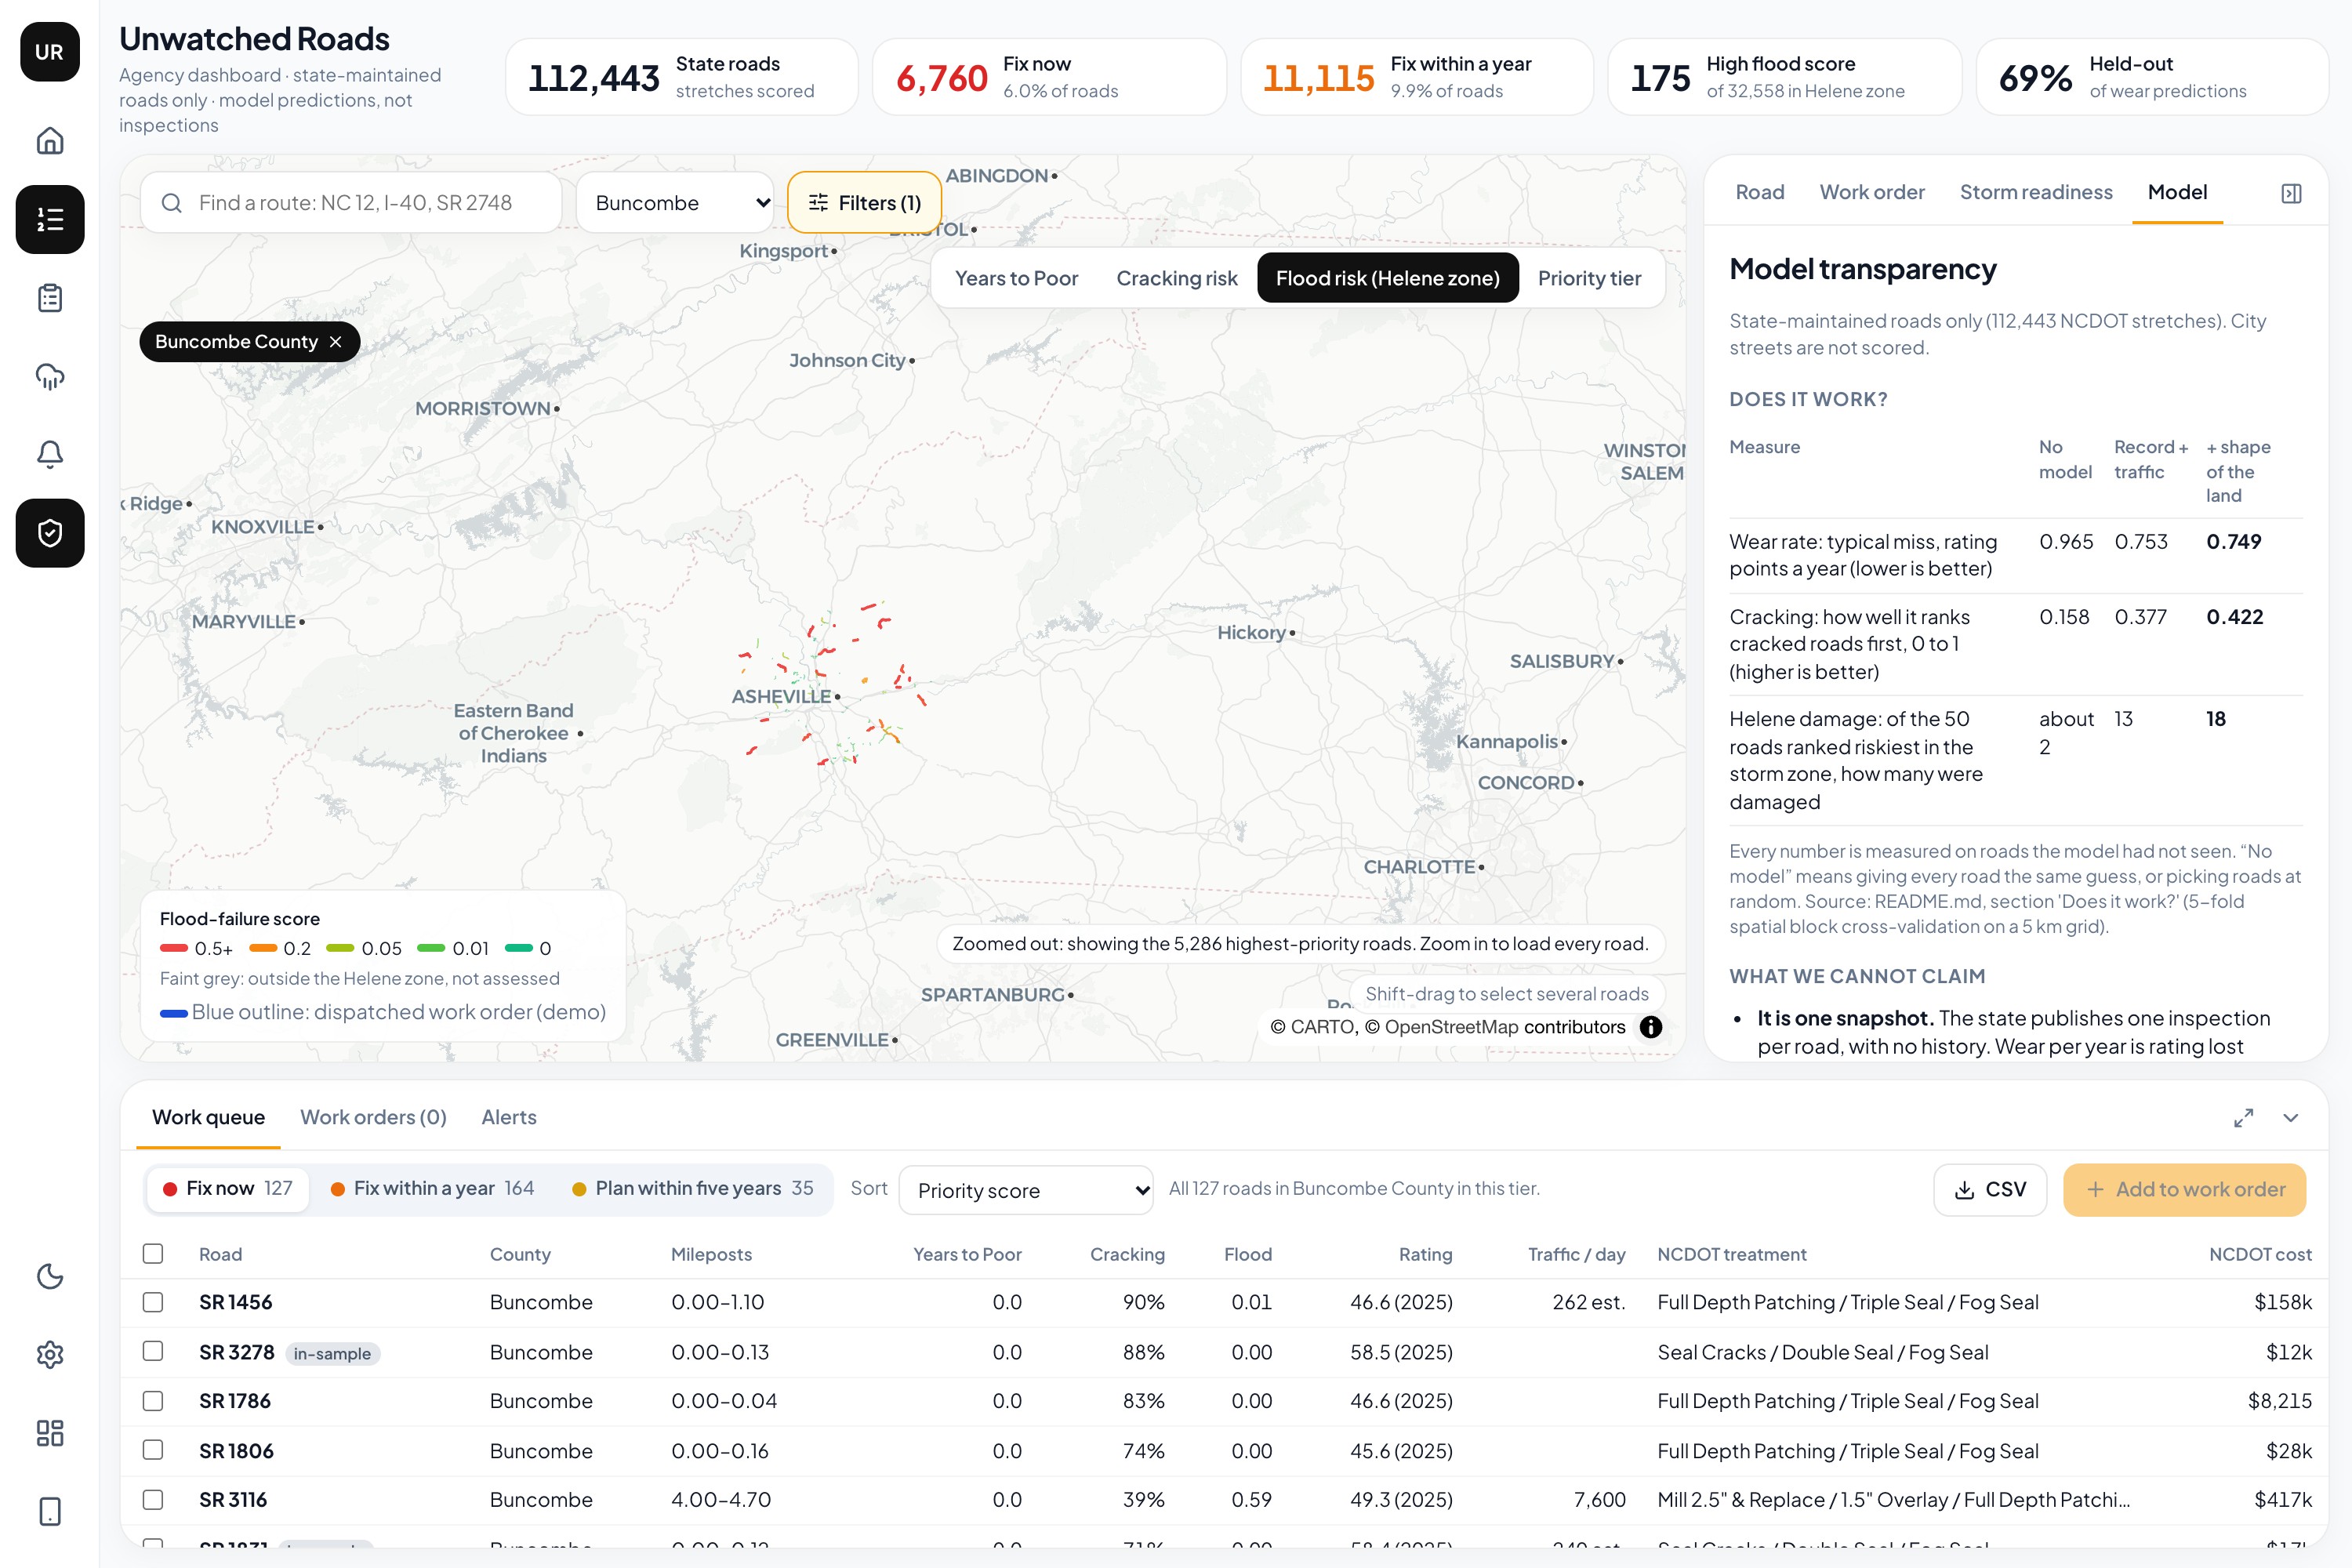
Honest testing. We split the state into 5 km squares and scored every road with a model that never saw that road or any neighbour in its square. A banned-column list stops the model from peeking at the inspection rating or anything measured in the same survey.
Web. Vite, React and TypeScript with deck.gl on MapLibre, reading static files built from the prediction table, plus a small FastAPI service, deployed on Vercel. Behind it we built a Postgres + TimescaleDB (Tiger Data) layer for camera readings, sensor levels and pothole reports, with hypertables and continuous aggregates.
Challenges we ran into
- One snapshot, no history. The state publishes one inspection per road. We had to define wear as rating lost divided by years since resurfacing.
- Route IDs that do not match. Two NCDOT layers encode the same route differently, so the first join matched nothing until we rebuilt the key.
- A laptop with 18 GB of memory. The statewide elevation grid is about 290 million cells, so we processed it in tiles.
- Our first labels flattered us. Pavement age was counted to the wrong year and "cracked" was too loose. Fixing both made the scores lower and the model more honest.
- The venue network blocked the ports for our rented GPU and for the cloud database, so the database layer was built and tested against a local TimescaleDB.
- Aerial photos did not help. We cut thousands of image chips and they added no reliable lift. We report that instead of hiding it.
Accomplishments that we're proud of
- Helene backtest. Of the 50 roads our model ranked riskiest in the storm zone, 18 were actually damaged. Picking at random finds about 2.
- Checked against real potholes. In Charlotte, the roads we rank worst draw about three times the pothole reports per mile of the roads we rank best, comparing roads with similar traffic.
- Every score on the map is held-out wherever a label exists, and each one carries a badge saying so.
- Flood camera reader. On a camera it had never seen, it caught 91% of flooded photos with a typical depth miss under 10 cm.
- Helene water depth on roads. A depth in metres for 1,602 road segments near surveyed high-water marks, checked against 190 tape-measured depths.
- A dashboard that states its own limits: there is a "What we cannot claim" panel next to the results.
What we learned
- The shape of the land barely changes the wear estimate. It clearly helps find cracked roads, and it helps most with flood damage.
- Random train/test splits lie for map data, because neighbouring roads look alike. Spatial blocks are slower and give numbers you can defend.
- Negative results are results. Crash counts, estimated traffic, aerial photos and a dedicated pothole model all failed to beat the simple version, and knowing that saved us from shipping noise.
What's next for Unwatched Roads
- Score city streets, the roads with no public inspection at all.
- Live camera confirmation, so a flood alert rests on a photo as well as a prediction.
- A budget planner that ranks repairs by benefit per dollar, using NCDOT's own treatment and cost estimates.
- A per-road risk feed for navigation apps, so drivers are routed around rough or flood-prone roads.
- Load the database layer into the hosted Tiger Data service and point the dashboards at it.
Built With
- claude
- codex
- deck.gl
- fastapi
- gemini
- geopandas
- lightgbm
- mapbox
- maplibre
- ncdot
- opencv
- pandas
- postgresql
- python
- pytorch
- rasterio
- react
- scikit-learn
- timescaledb
- typescript
- vercel
- vite
- vscode

Log in or sign up for Devpost to join the conversation.