-
-
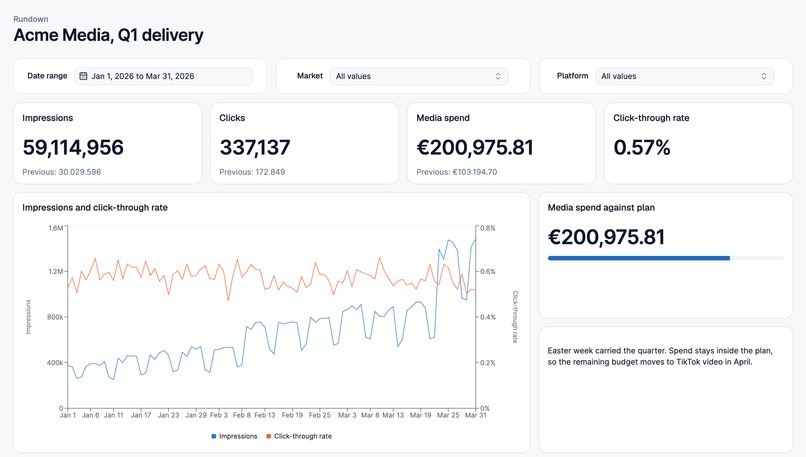
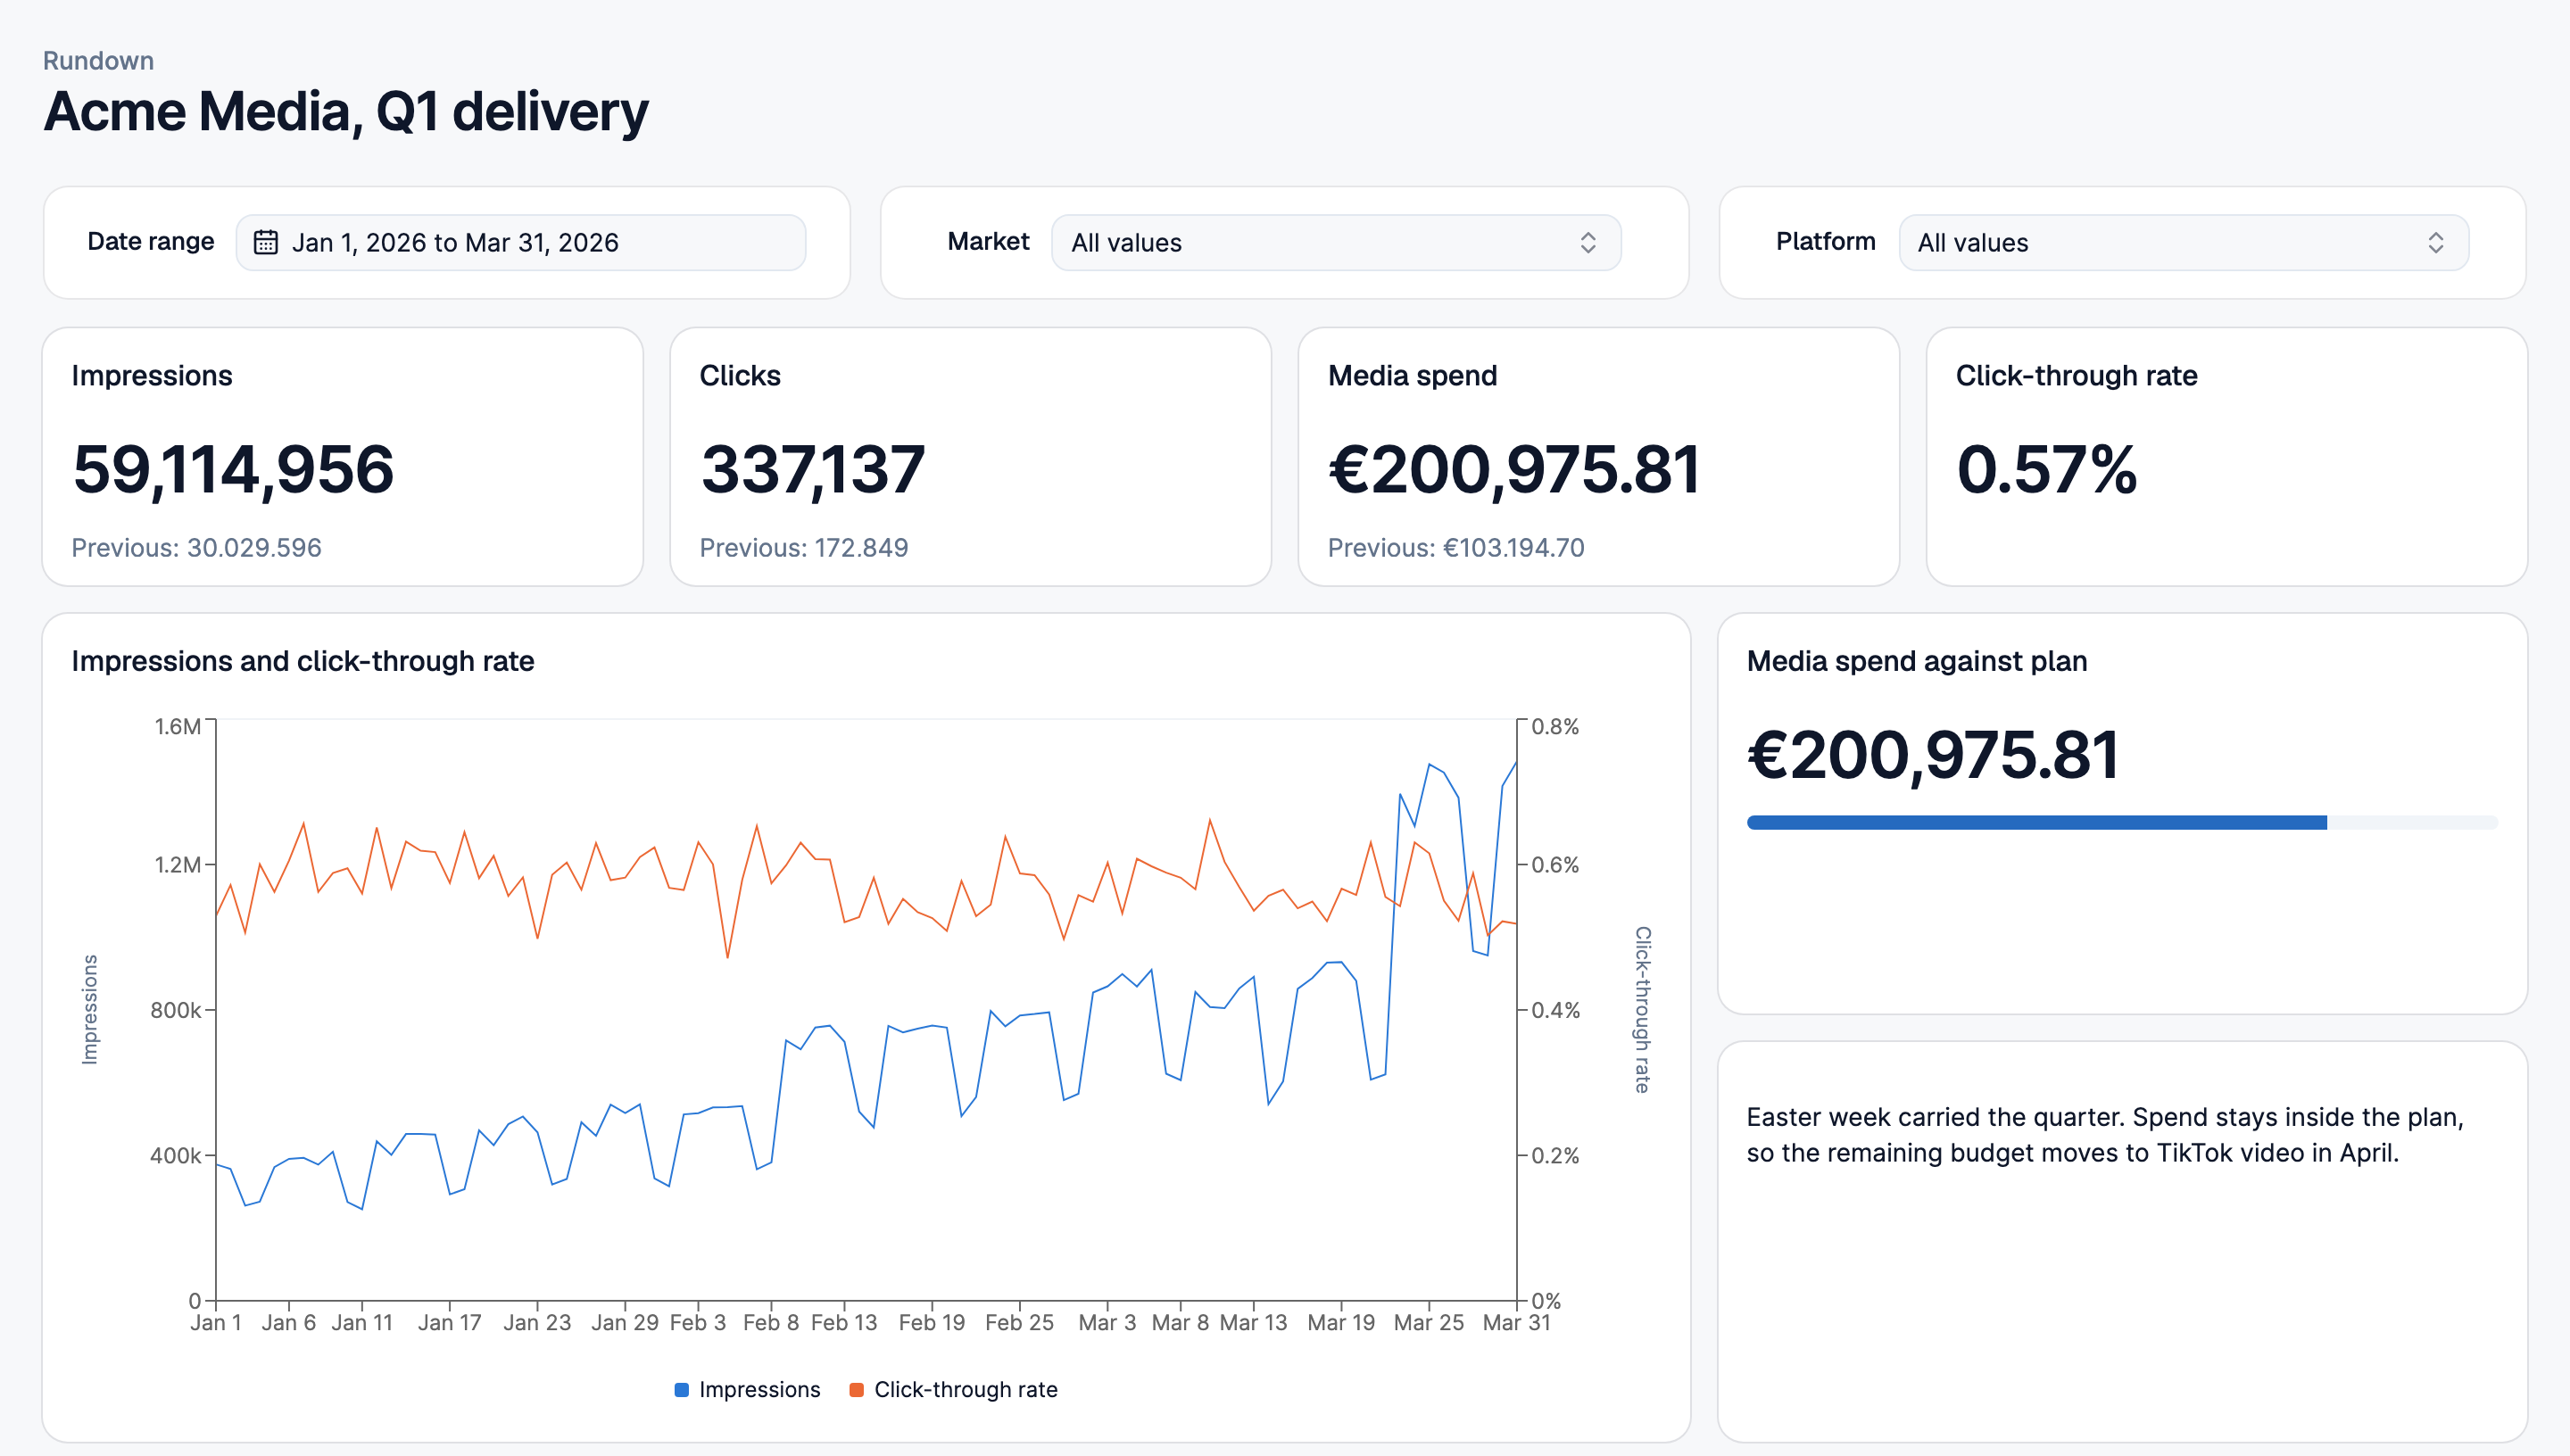
Screenshot of a marketing dashboard, created by rundown
Inspiration
I work as a product engineer at a digital advertising company, and dashboards are part of every working day. Giving clients and partner agencies real-time data takes work off both sides. Users do not have to open Excel files and build charts to understand how a campaign performs. Dashboard creators set a dashboard up once, and new data flows in every day without manual work.
Tools like Looker Studio and Whatagraph let client and agency users work with those dashboards interactively. They filter for the data they need and look at visualizations built for their marketing goal.
None of the tools I tried offer first-class agent support for creating dashboards. The dashboard creator knows the client's goals and therefore knows which data belongs on the dashboard and how. I think of this as the intent in the creator's head. I found no prebuilt way to get that intent into a dashboard without a lot of manual effort.
WebMCP offers a unique angle on this. Dashboards are a visual interface. LLMs and agents are text interfaces. There are early formats like MCP Apps, but the gap is still open. So at the start of the hackathon I asked myself:
Could WebMCP let me build dashboards with an agent while the dashboard, the visual artifact, still carries the intent of the person who made it?
What it does
As a tool, rundown covers most of what Looker Studio or Whatagraph do. You connect data sources, build dashboards out of widgets, add filters and controls, and share dashboards with other users.
What makes rundown different is that every action in the dashboard editor is also a WebMCP tool. Open a dashboard in the ChatGPT desktop app and say "add a bar chart of spend per campaign for the last 30 days". The agent calls describeDatasource to learn the fields, then addWidget, and the chart shows up in the dashboard tab while the tool call runs. You drag it into place with the mouse, or ask the agent to call moveWidget. If a number looks off, explainWidget returns the compiled SQL.
There are around twenty tools, filtered per page. The dashboard editor gets the full set, a datasource page gets the field and metric tools, and a share link only exposes read-only tools like queryWidget and getControlOptions, so an agent can answer questions about a dashboard it is not allowed to edit. The tools are deliberately generic: addWidget, updateWidget, updateLayout, upsertCalculatedField, shareDashboard, and so on, rather than one tool per chart type.
Why your use case is a strong fit for WebMCP?
A dashboard is a visual artifact. Its value is in how it looks, not in its JSON. A classic MCP server could expose the same tools, but the person would be editing something they cannot see. WebMCP puts the agent inside the page that already renders the result. The agent works in text, the human checks in pixels, and both look at the same state. The intent I described above survives because the creator sees every change the moment it happens and can correct it by hand or by prompt.
The tools also get the page's context for free. The hook knows which dashboard is open, whether the user may edit it, and whether it is a share link. The agent does not need to be told any of that.
How does it create a better user experience?
Without WebMCP, the user has the tool in one window and the agent in another. The agent changes something through an API, and the user refreshes the tool to see what happened. The alternative is building a chat assistant into the tool, which locks the user out of their own agent setup: their skills, their AGENTS.md, their memory, their preferred model.
With WebMCP the user keeps their agent and gets the live view. Rundown goes one step further. The first tool call switches the editor into agent mode, which hides the editor sidebars and gives the dashboard the whole screen. The user can switch back manually at any time. During an agent session the page turns into a preview of the result, not a form.
How I built it
What existed before
About 1.5 years ago I drafted a data structure for a dashboard tool, at the time mostly inspired by what Looker Studio can do. It came closest to what agency users need. The draft and its iterations are in this folder.
From that draft and a rough idea of the behavior, I wrote a plan for the first vertical slice together with GPT 5.6-Sol and Claude Fable 5. Architecture decisions like using DuckDB as the data layer were made at that point.
After that the work was a loop of unattended implementation runs, GitHub review flows, and human-in-the-loop sessions to try different versions of a feature. Most of the code was written in T3 Code with GPT 5.6-Sol, with Opus 5 and Fable 5 pulled in for second opinions on specific tasks.
Architecture
How do I implement WebMCP?
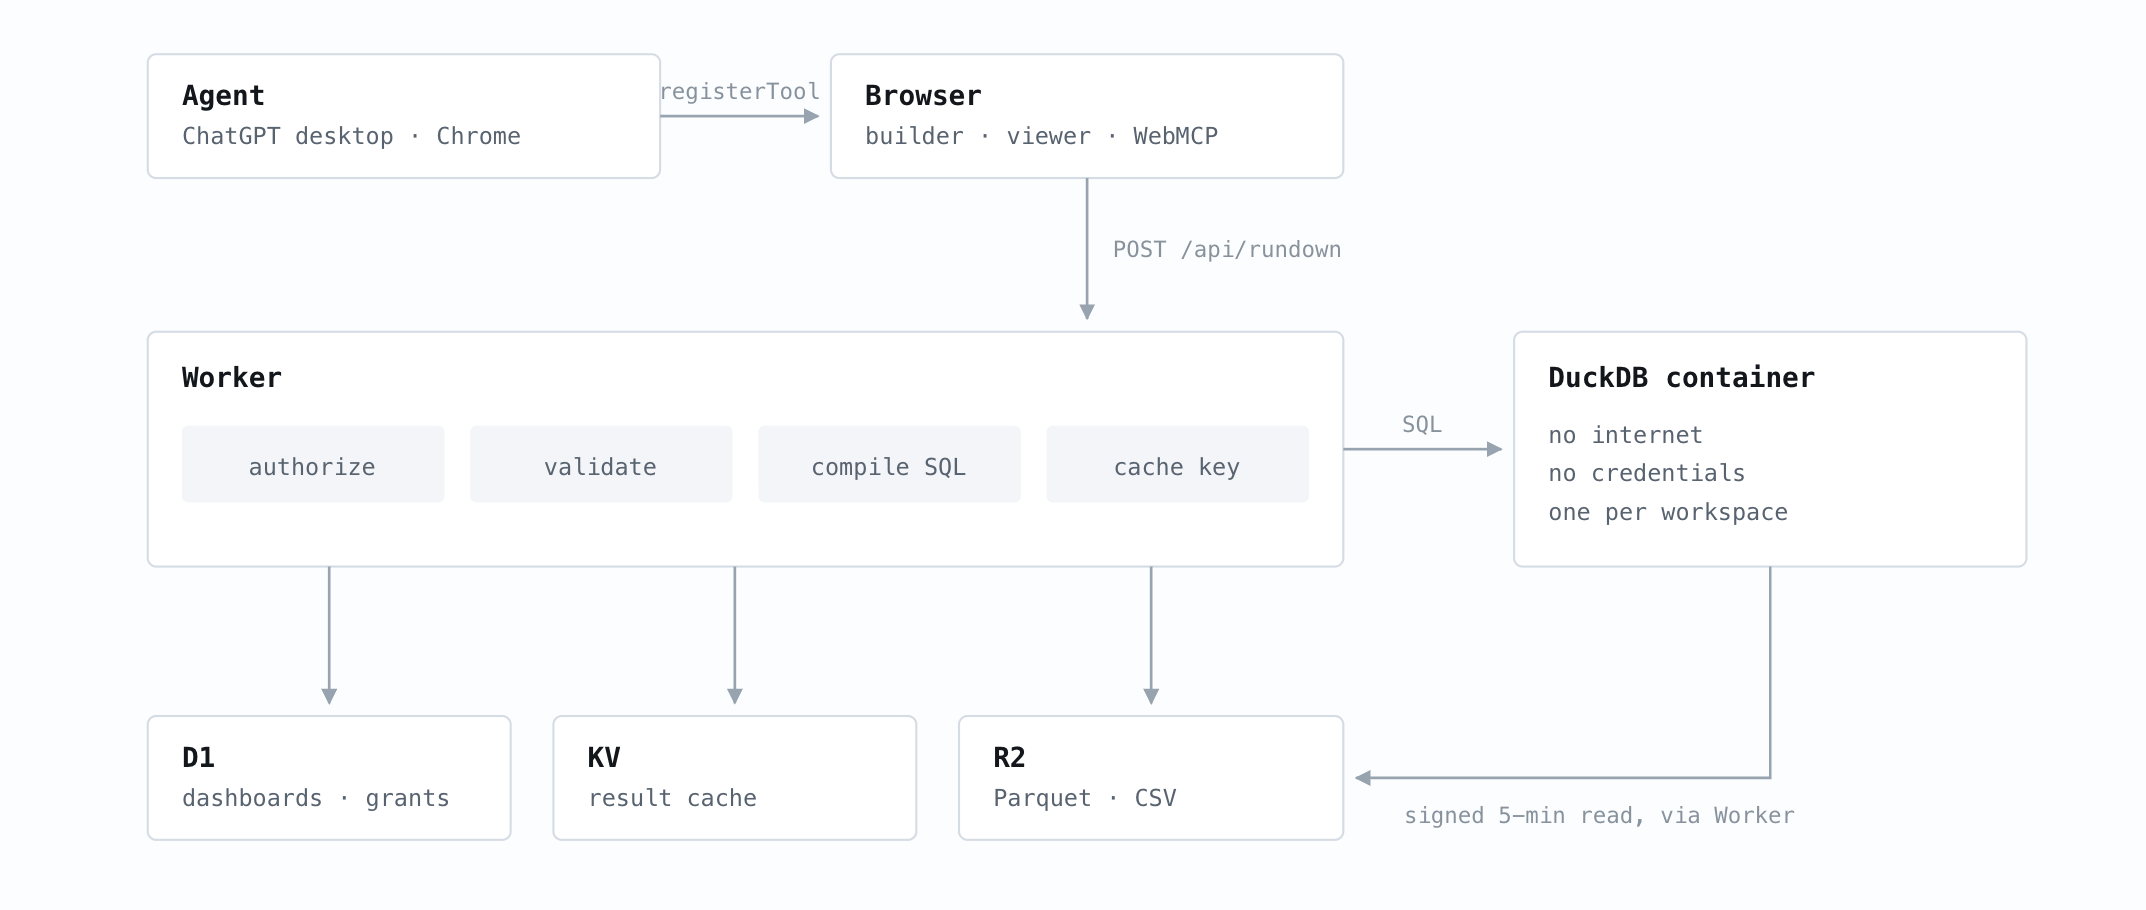
A React hook called useWebMcpTools() runs on every route. It receives the route's context (open dashboard, permissions, share token) and registers the matching set of tools with document.modelContext.registerTool(...). The tools call the same API the GUI editor calls, so the agent and the mouse go through one code path and stay in sync.
After a mutation the hook refreshes the page state, so the change is visible immediately. The first tool call also activates agent mode, which hides the editor chrome, unless the user has chosen a mode by hand.
Challenges I ran into
This was my first project on Cloudflare, and I had little experience with serverless functions. Early on I struggled to deploy DuckDB, the credentials, and the data in R2 in a way that worked together. Workers cap at 128 MB RAM and 10 MB of gzipped code, and DuckDB blows through both. In the end I moved the query engine into a Cloudflare Container, which has far higher limits and lets DuckDB read Parquet and CSV files straight from R2.
Accomplishments that I'm proud of
Every editor action has a tool equivalent. There is nothing the mouse can do that the agent cannot, and nothing the agent can do that the user cannot see.
The architecture scales without code changes. DuckDB is a fast OLAP engine, and combined with R2 storage and Cloudflare's scaling it handles complex dashboards without special handling in the code.
What I learned
- WebMCP sits in a different place than a classic MCP server. The standardized agent-tool interface is the same, but staying close to the UI lets the user inspect and act on the result. That makes it a good fit for GUI-heavy workflows, and a bad fit for things that are better done headless.
- Agents call tools faster than a page refreshes. Refreshing state after every mutation, and switching the UI into a preview mode on the first call, mattered more for the experience than any single tool.
What's next for Rundown - agentic dashboard builder
- Blended data sources. Combining several sources into one is a niche but very valuable use case. Matching fields across sources is the hardest problem non-technical users face here, and an agent that can introspect both sources through WebMCP could do most of that matching.
- More data source types. Today rundown reads CSV and Parquet uploads stored in R2. For real use it needs SQL sources like PostgreSQL and BigQuery.
- Workspace metrics. A shared set of calculated fields per workspace is planned and partly built, but hidden from the UI until it is complete.
- Self-service registration. The tool is invite-only. Before opening it up I want a proper security audit and the GDPR work needed to run it in the EU.
Project availible under MIT license at https://github.com/patriksimms/rundown
Built With
- bun
- cloudflare
- drizzle
- duckdb
- shadcn
- tanstack
- vite
- zod

Log in or sign up for Devpost to join the conversation.