-
-
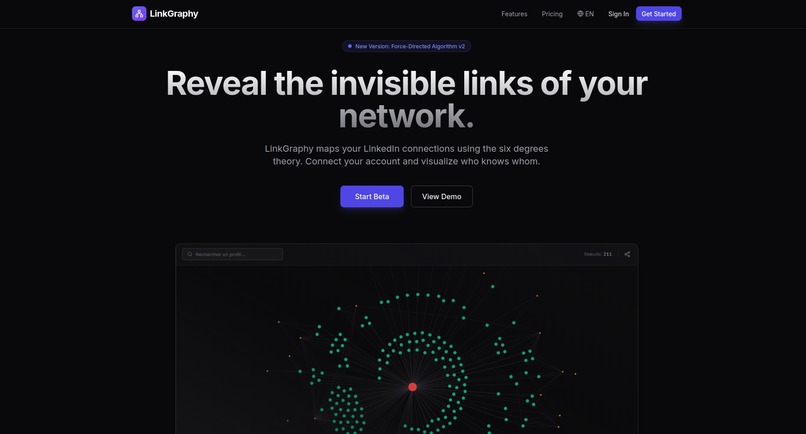
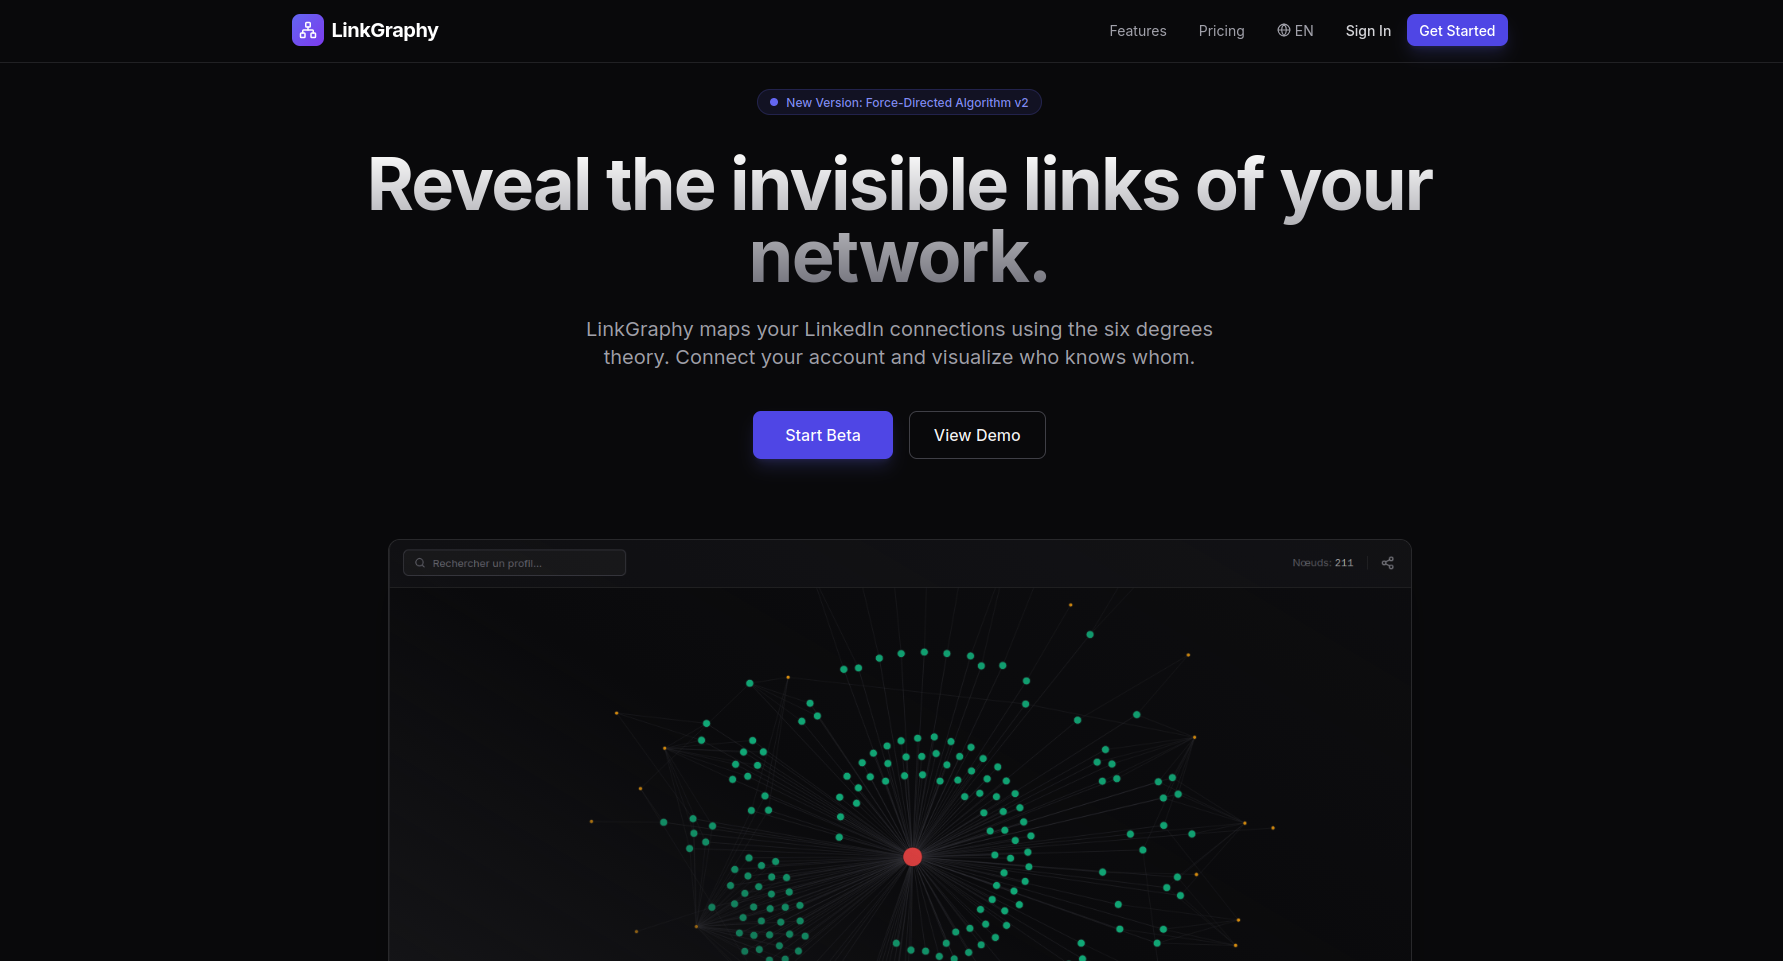
landing page
-
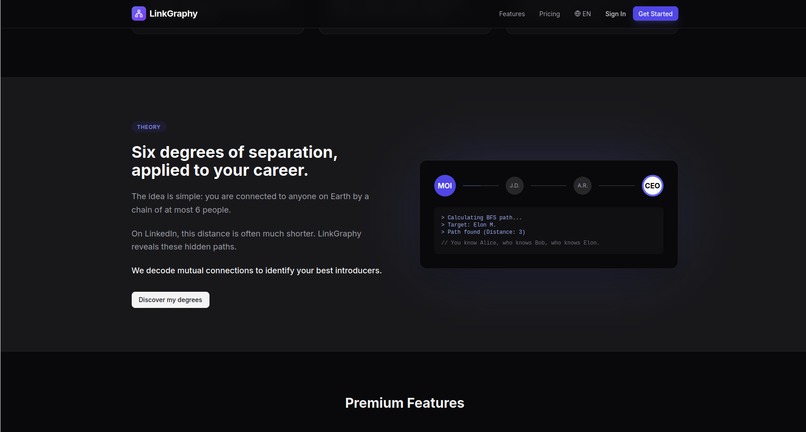
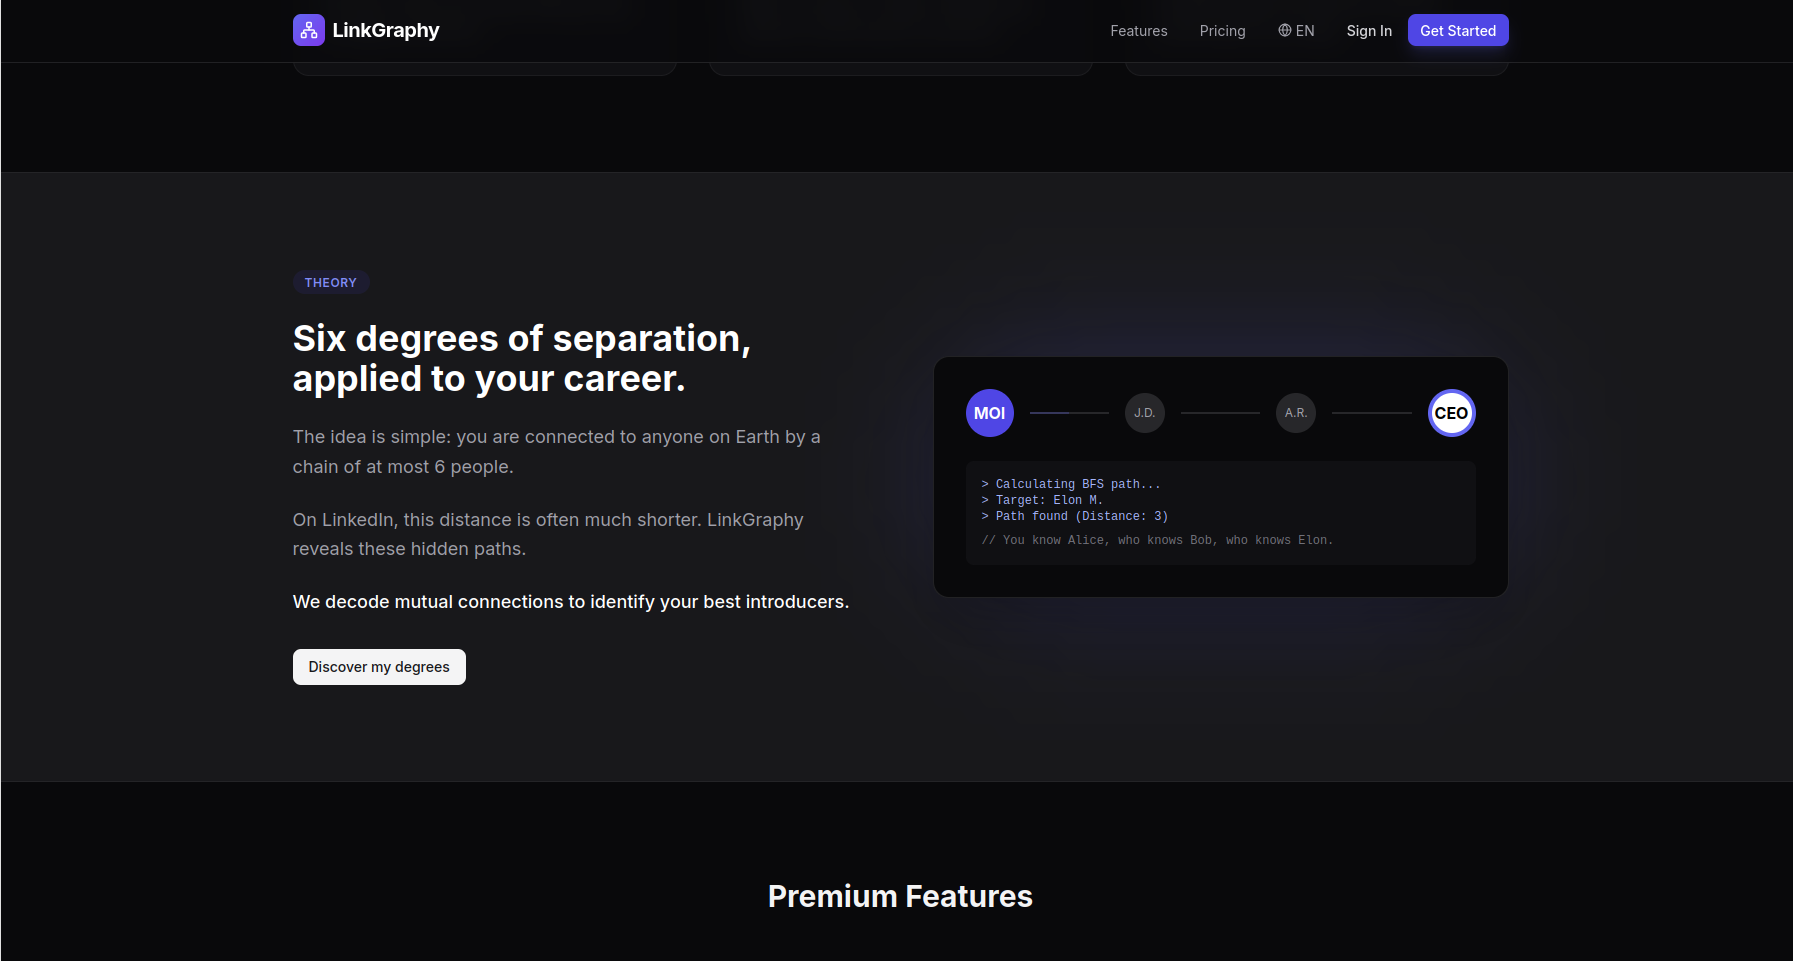
inspiration
-

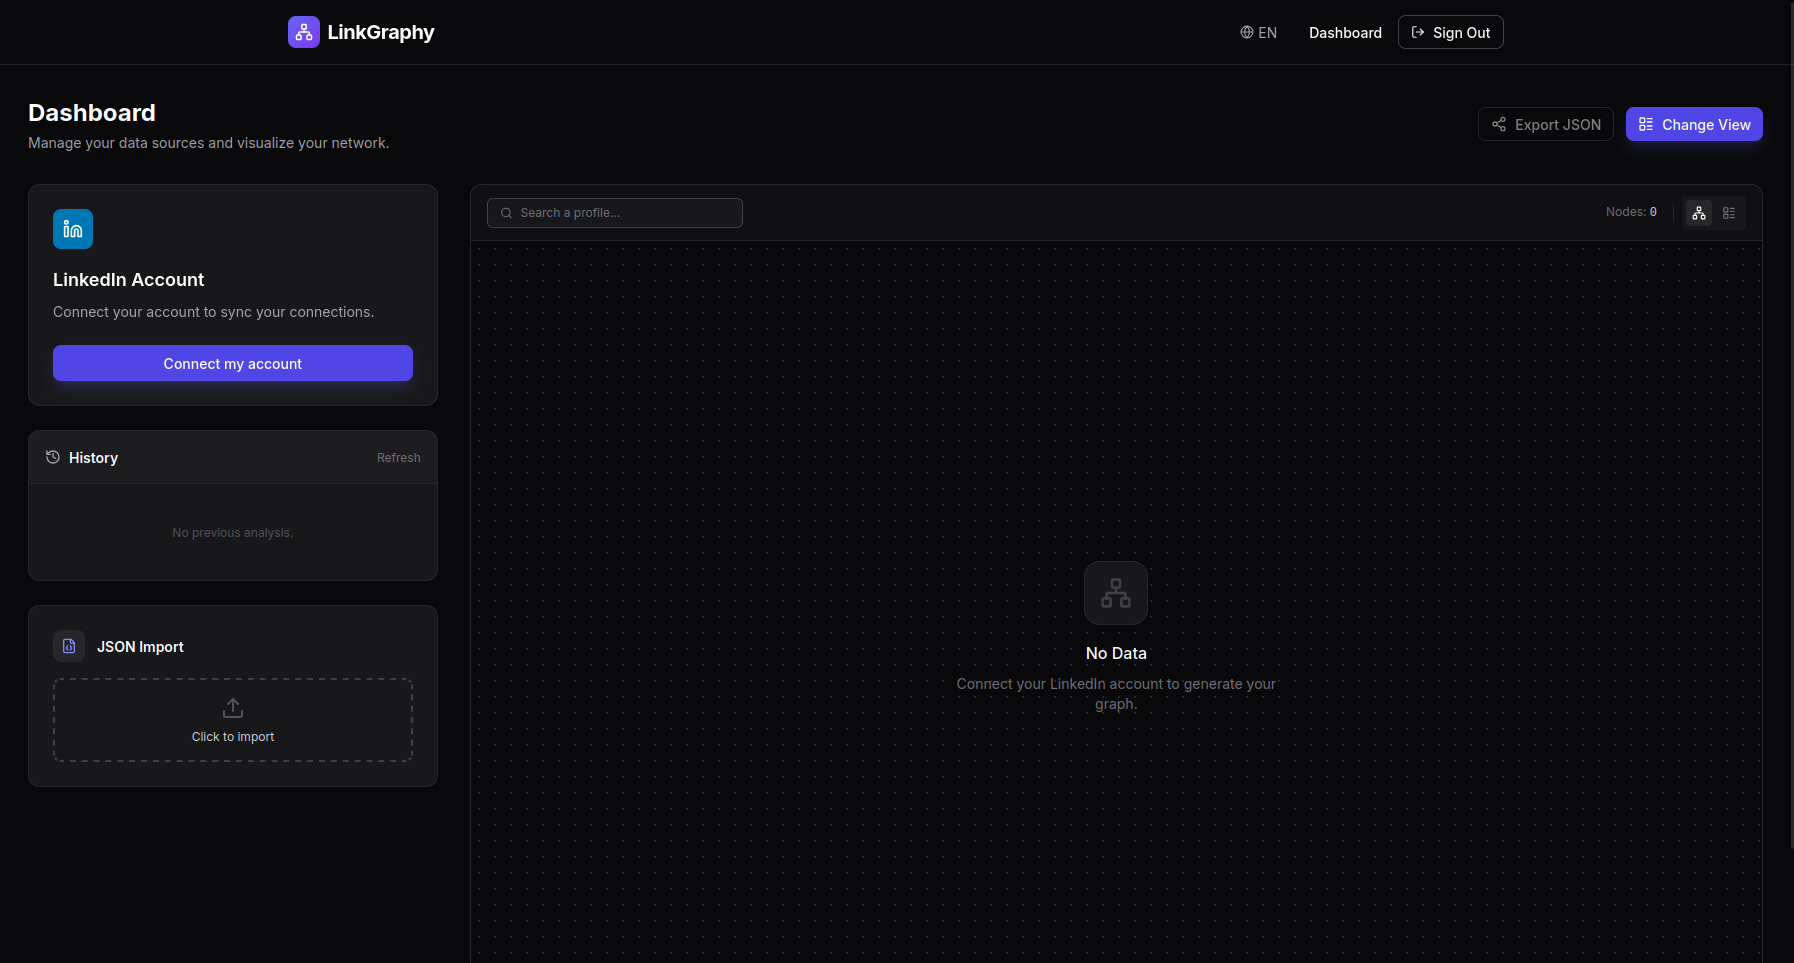
dashboard empty
-
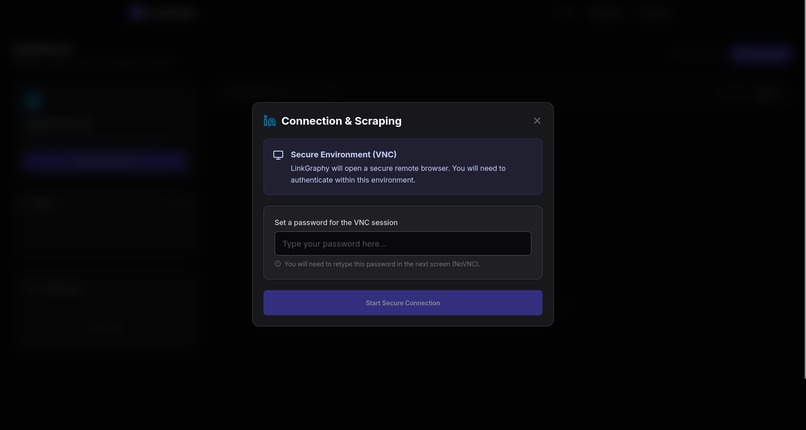
connect account
-
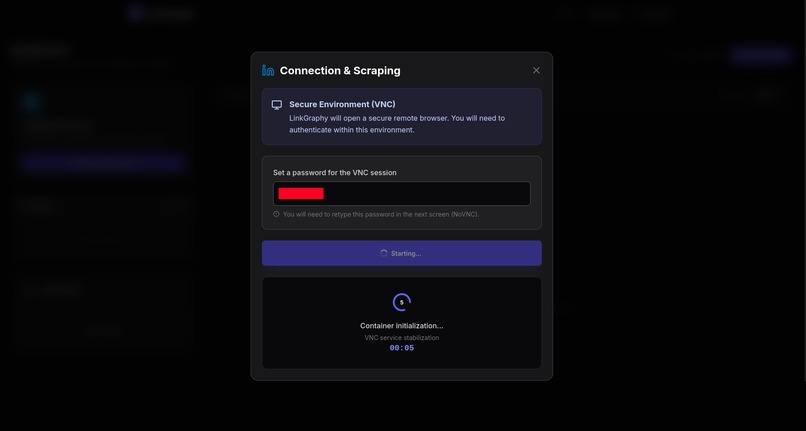
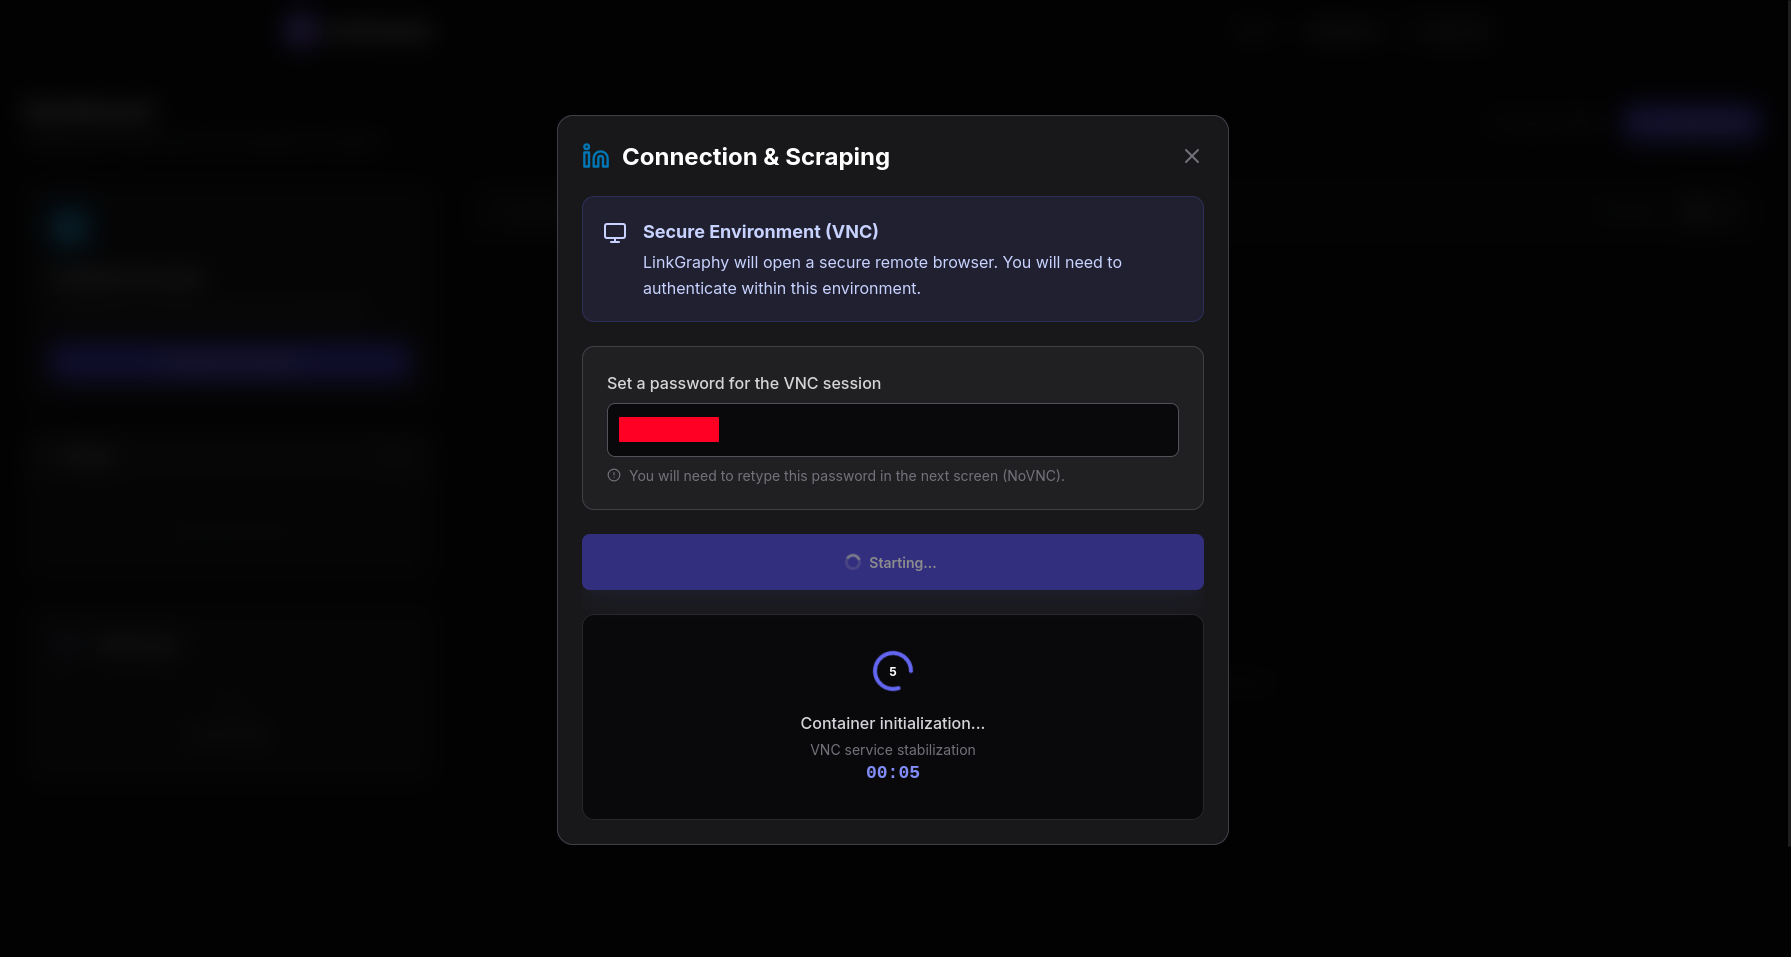
connexion in progress
-
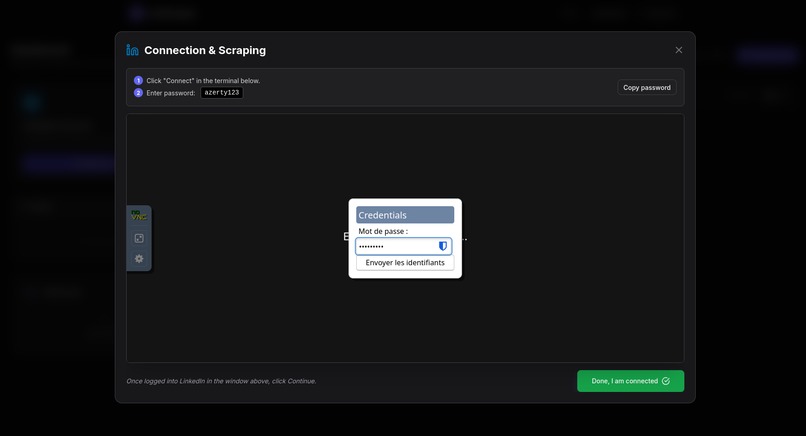
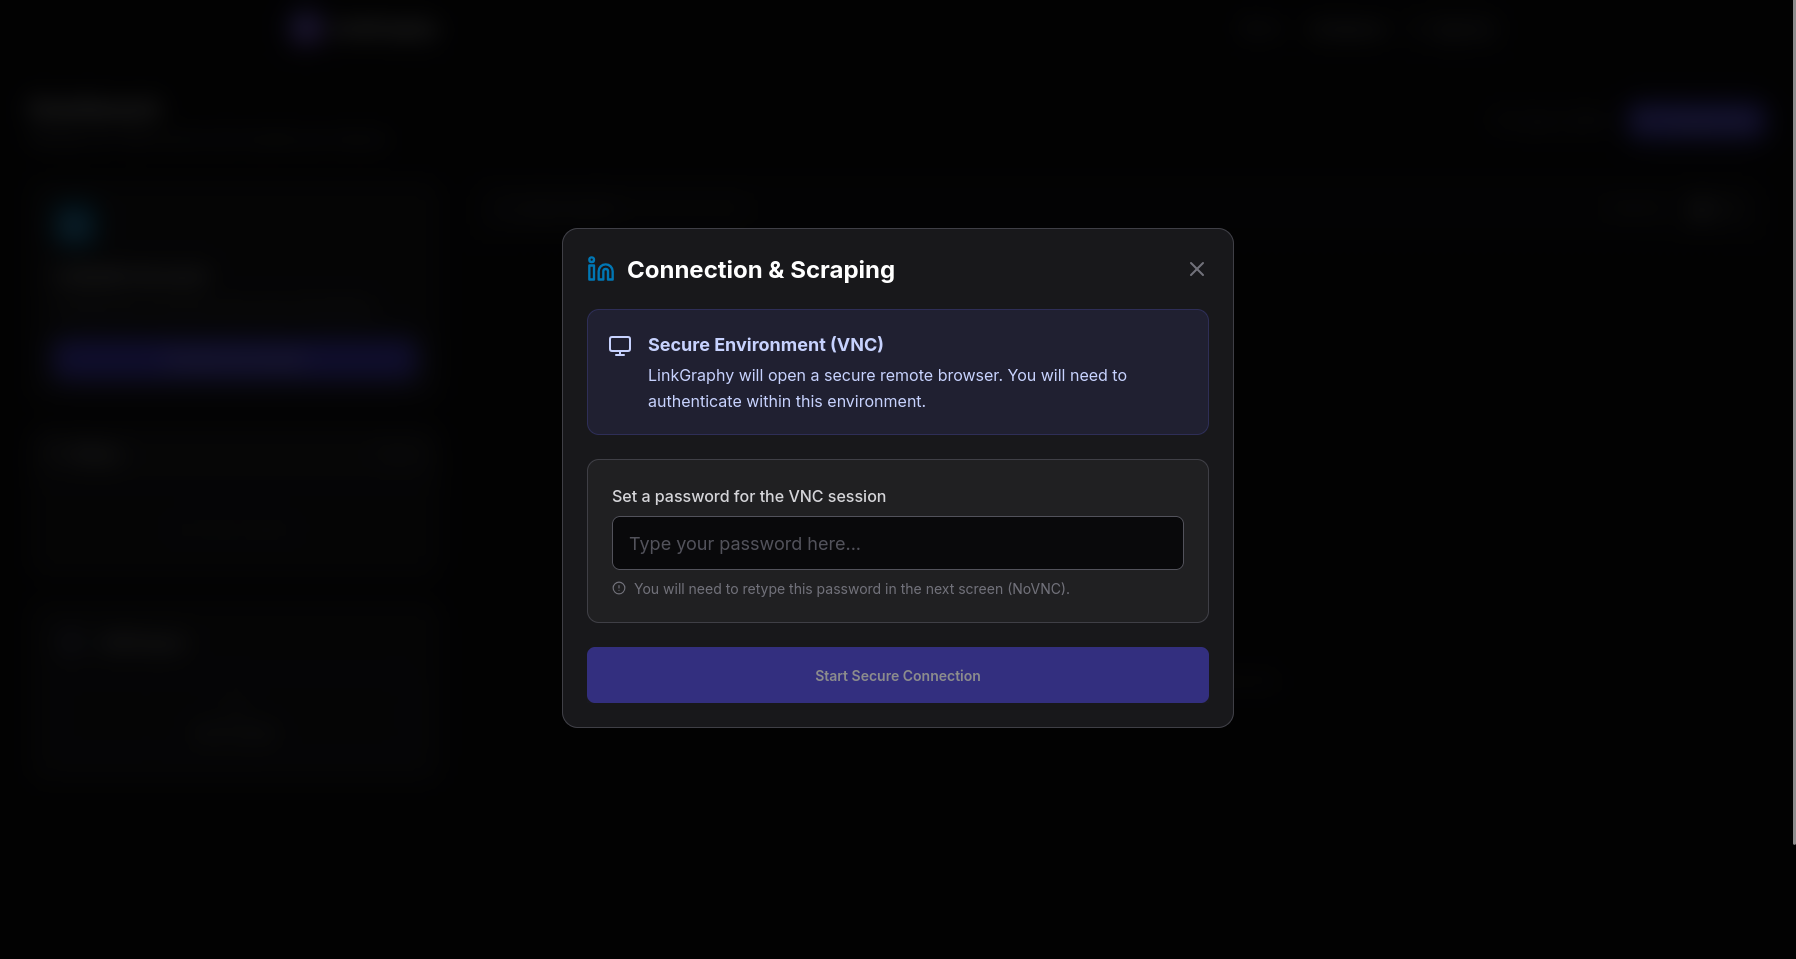
set connexion
-
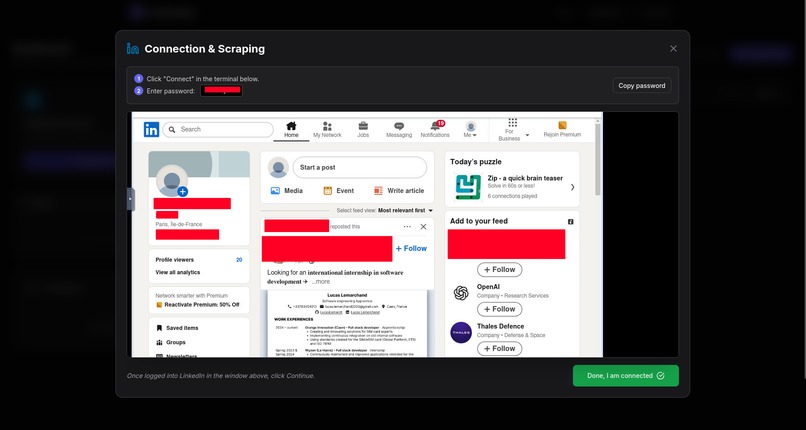
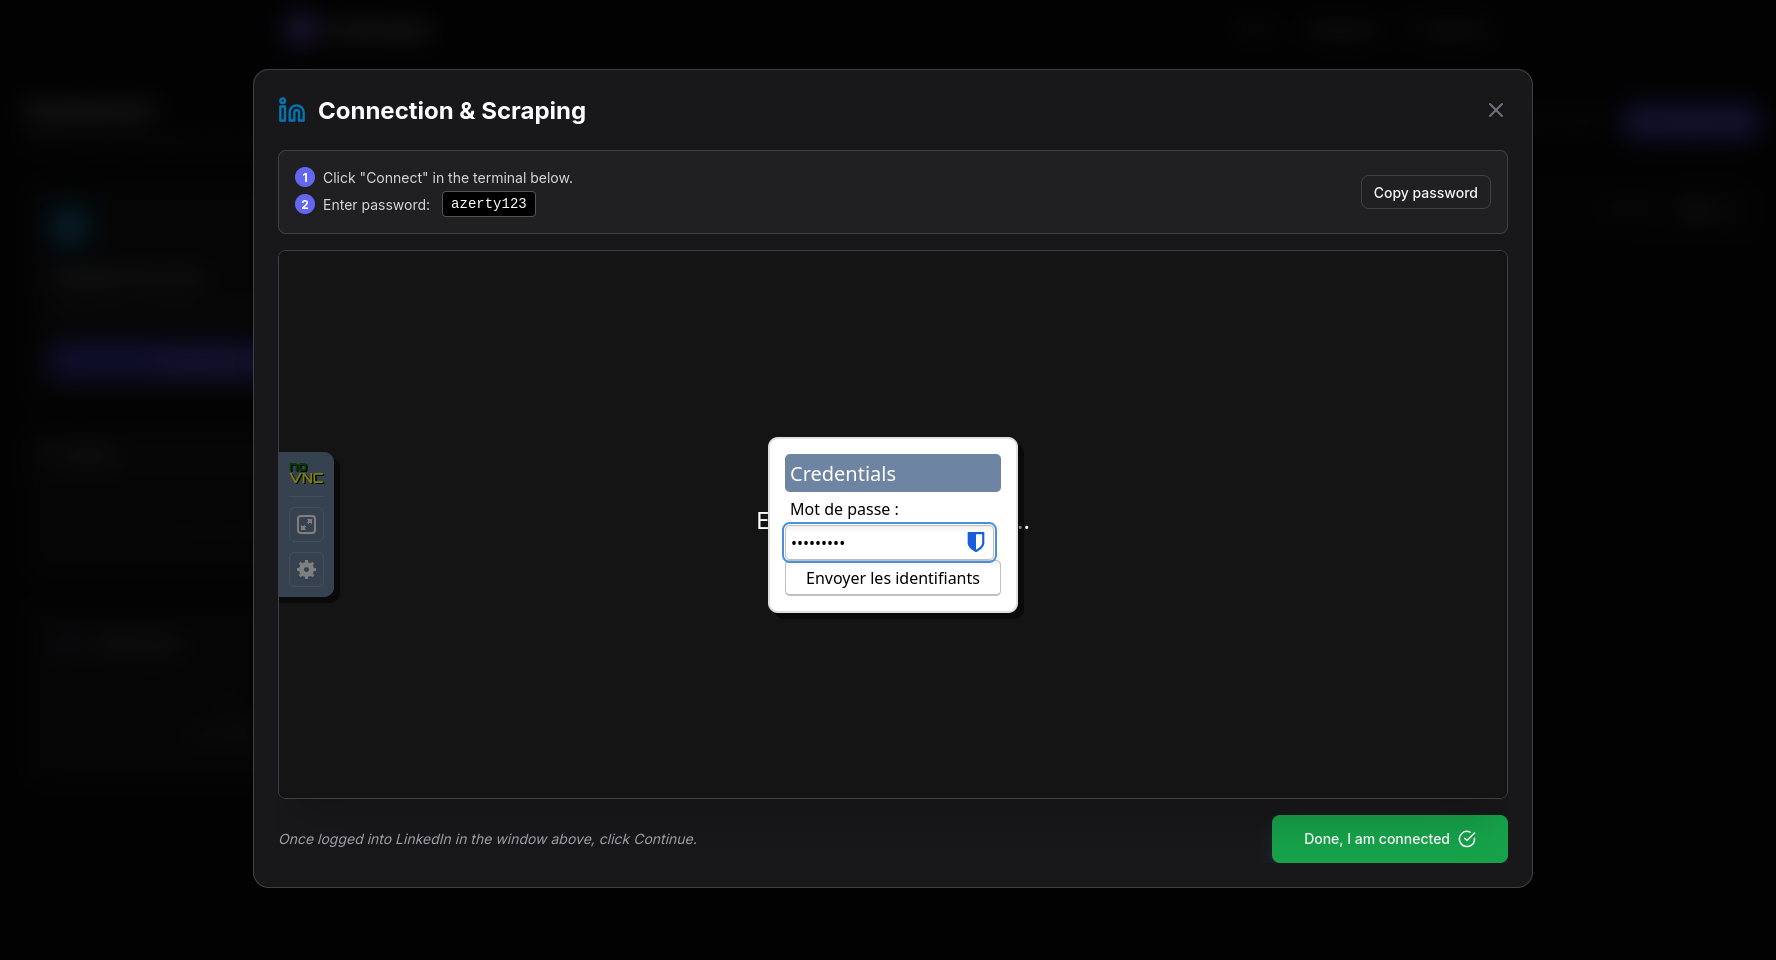
connect in to linkedin
-
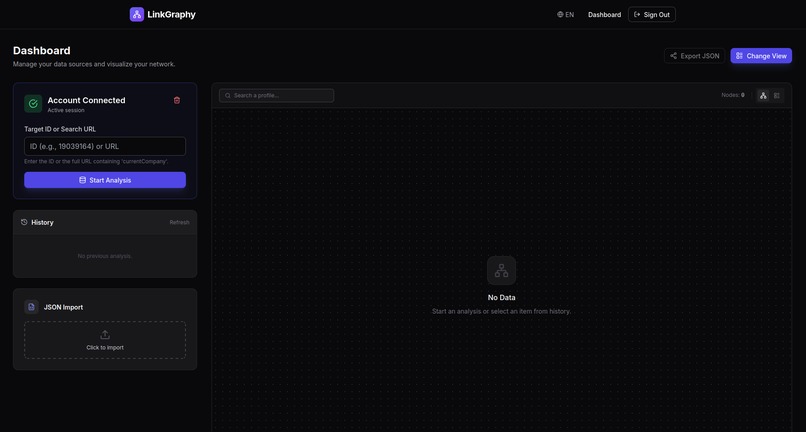
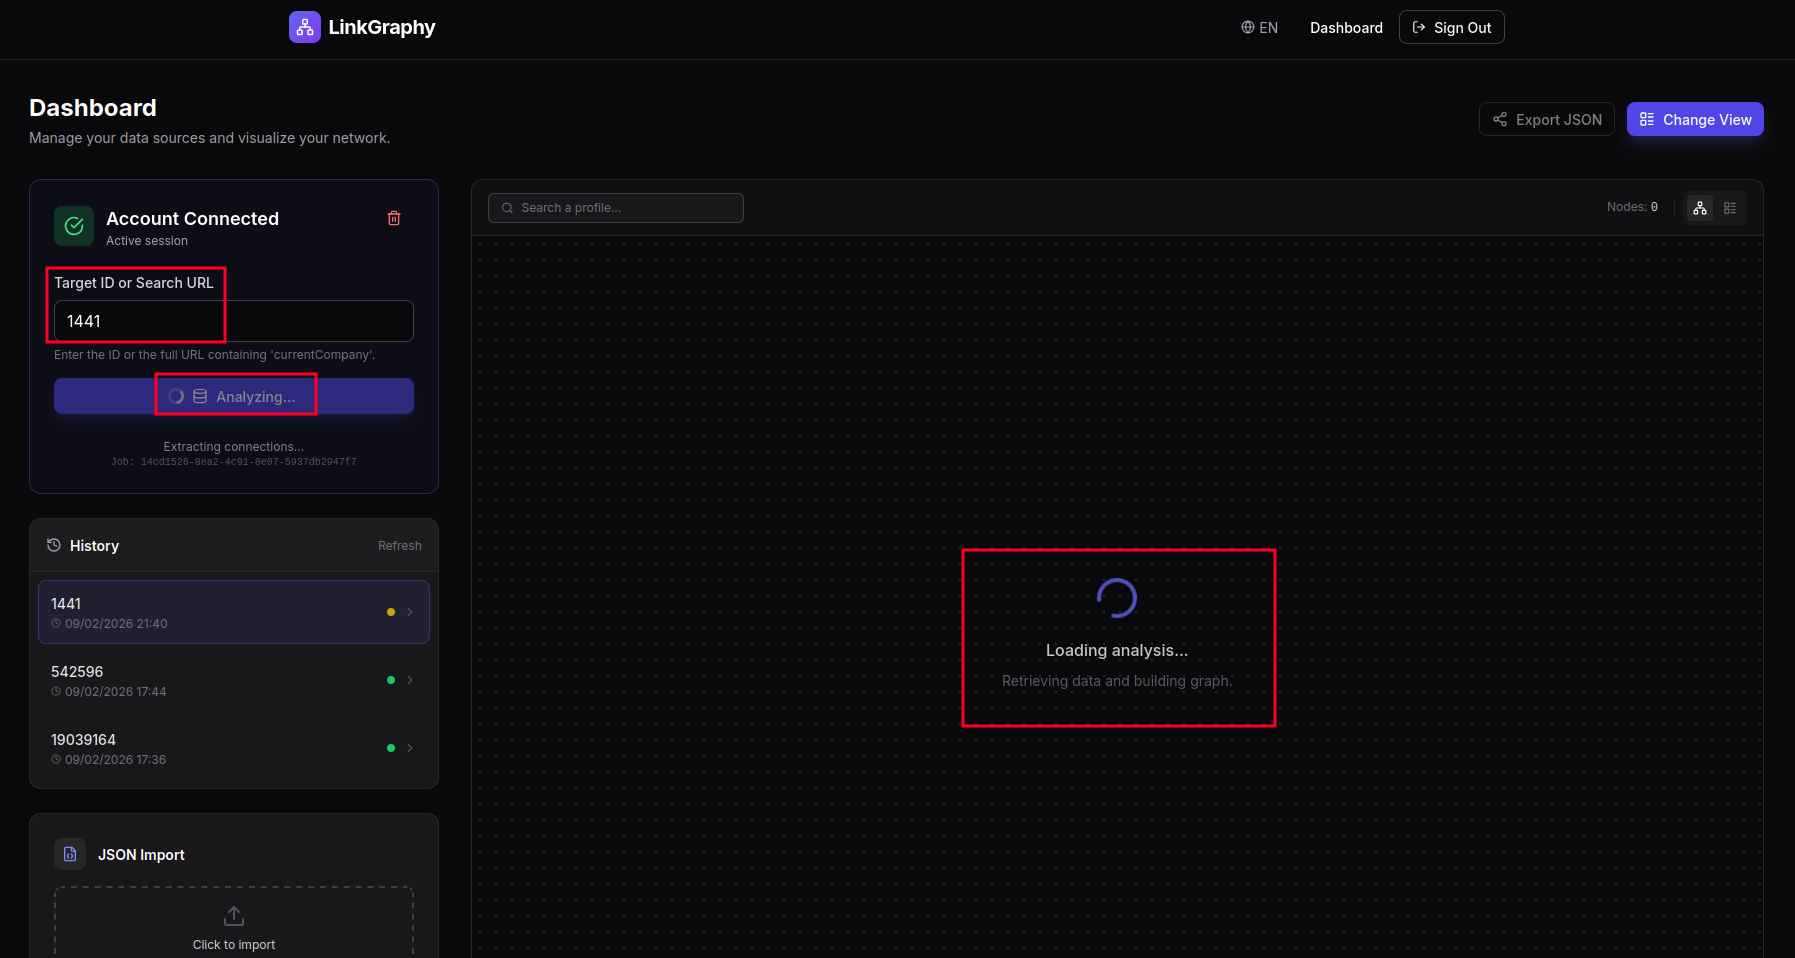
account connected
-
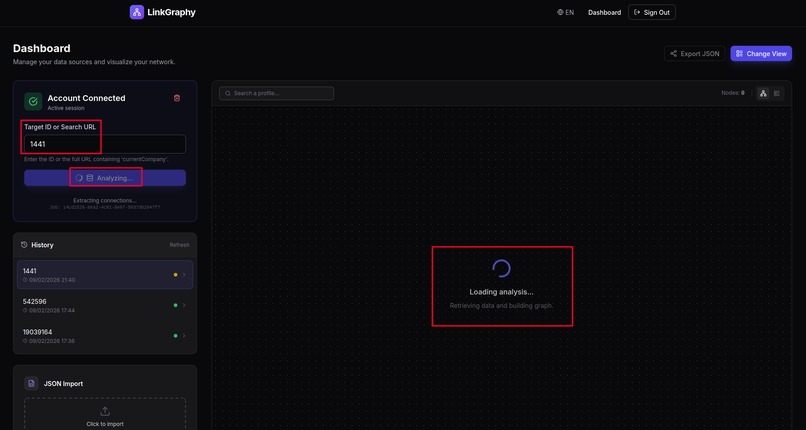
search in progress
-
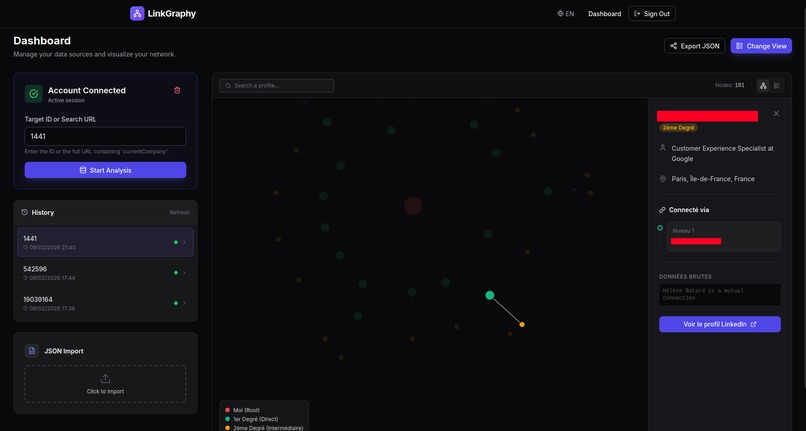
consult graph


LinkGraphy
Inspiration
The project is directly inspired by the theory of Six Degrees of Separation — the idea that a short path almost always connects any two people.
LinkGraphy applies this concept to LinkedIn networks to uncover hidden connection paths and identify the best intermediaries for introductions.
Our goal is to transform abstract social proximity into something visual, measurable, and actionable.
What it does
LinkGraphy allows users to:
- Connect a LinkedIn account through a secure browser (VNC / noVNC)
- Run targeted scraping by company (ID or URL)
- Build a relationship graph (degree 1 / 2 / 3) using a force-directed layout
- Filter and explore paths using BFS / shortest path algorithms
- Import manual JSON datasets
- Export results to JSON or CSV
- Keep a history of previous analyses
This provides a complete workflow from data acquisition to interactive network exploration.
How we built it
Frontend
- React
- Graph visualization with D3.js
- Alternative table view
- Import / export system
- FR / EN i18n
- Supabase integration for JWT authentication
Backend API
- FastAPI
- Supabase JWT authentication
- Endpoints to:
- Create / delete browser containers
- Retrieve DevTools endpoints
- Save cookies
- Launch and monitor scraping jobs
Worker
- Simple polling worker executing extraction scripts
- Merges results and stores them in the database
Docker
- Chromium image with noVNC + DevTools
- Provides a secure remote browser environment
Python scripts
- Cookie extraction via Chrome DevTools Protocol (CDP)
- LinkedIn requests
- HTML profile parsing
- Deduplication and JSON merging
Challenges we ran into
- Stabilizing a reliable LinkedIn session through a remote browser (VNC + DevTools)
- Parsing unstable LinkedIn HTML and properly cleaning text (mojibake, tags, missing fields)
- Building a coherent graph from incomplete signals (degrees and mutual connections)
- Managing cookie security and user sessions correctly on the backend
Accomplishments that we're proud of
- End-to-end pipeline: secure login → scraping → interactive graph
- Clean force-directed rendering with graph / table switching
- Manual JSON import + JSON / CSV export
- Modular architecture: Python scripts + API + worker + frontend
What we learned
- “Seamless” steps (authentication, cookies, sessions) are often the hardest part
- A small, clean graph is more valuable than a large noisy one
- Data quality (cleaning and normalization) dramatically impacts visualization
- Graph traversal algorithms unlock powerful insights when applied to social data
What's next for LinkGraphy
- Improve pathfinding (multi-criteria paths, introduction scoring)
- Add advanced filters (role, location, industry)
- Optimize visualization for very large graphs
- Replace polling with a real job queue system
Built With
- cdp)
- chromium
- d3.js
- devtools
- docker
- fastapi
- jwt
- novnc
- postgresql
- postgresql)
- protocol
- psycopg
- pydantic
- python
- requests
- router
- supabase
- typescript
- uvicorn
- vite
- vnc
- xvfb/openbox)

Log in or sign up for Devpost to join the conversation.