


Inspiration
Purpose
If there are two things our team loves, it's data and tacos! So when we were presented with this vast dataset, we were excited to see how we could use it to feed our addiction to tortilla-encased goodness. However, we quickly realized that while the dataset was quite large, it didn't necessarily have everything we wanted to know. Specifically, we wanted to figure out how we could not only find the best tacos at the best prices, but support local businesses as well. That's why we developed multiple models and metrics to expand the dataset, using item classifiers, keyword analysis, Yelp reviews, and physically accurate radius calculations.
What it does
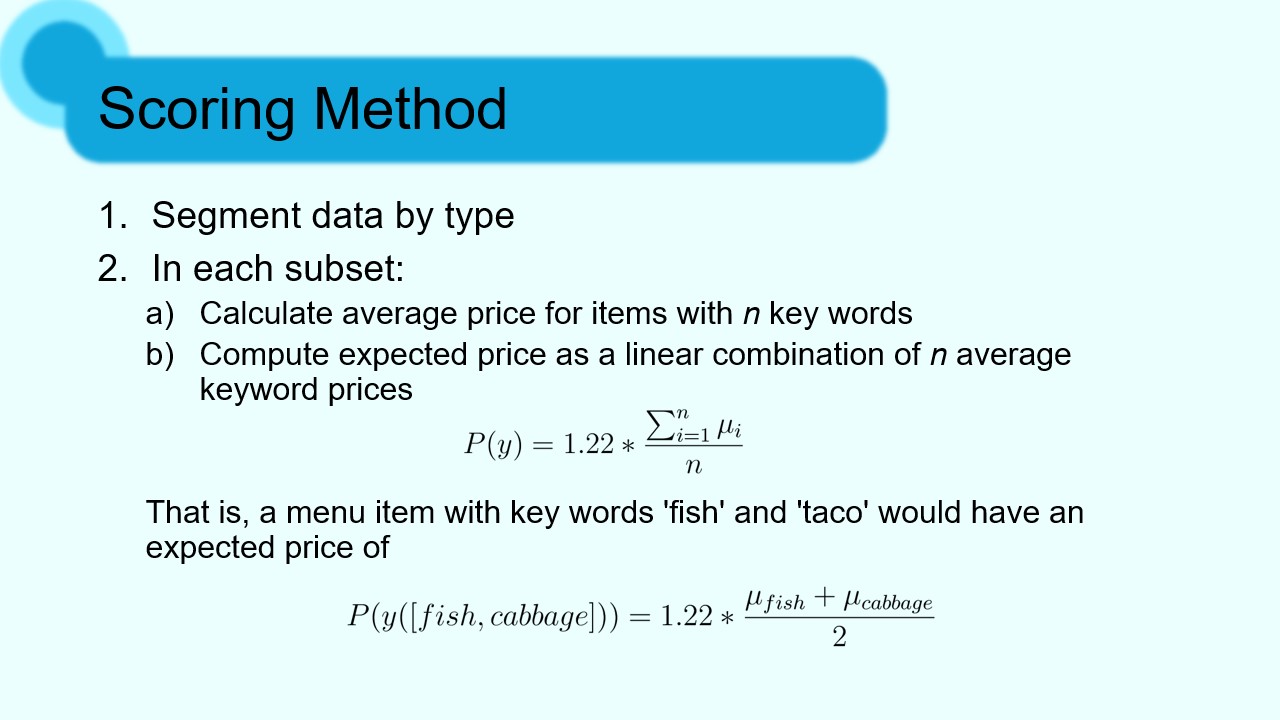
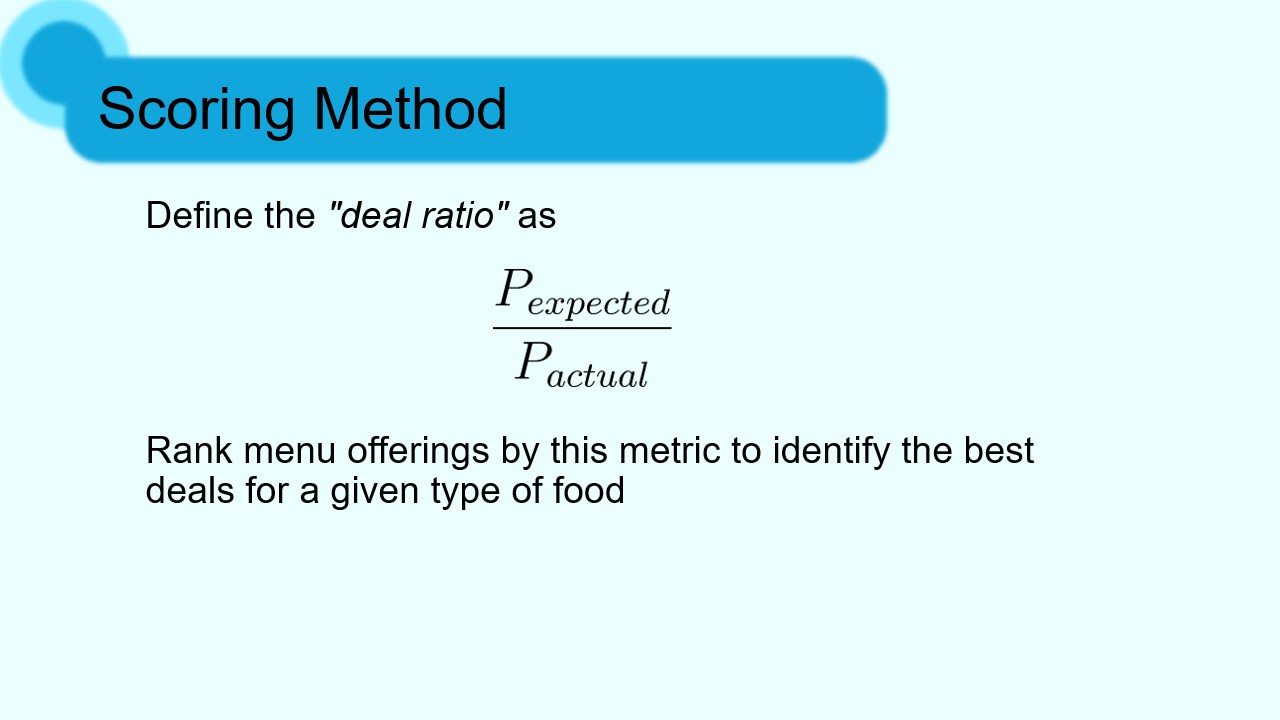
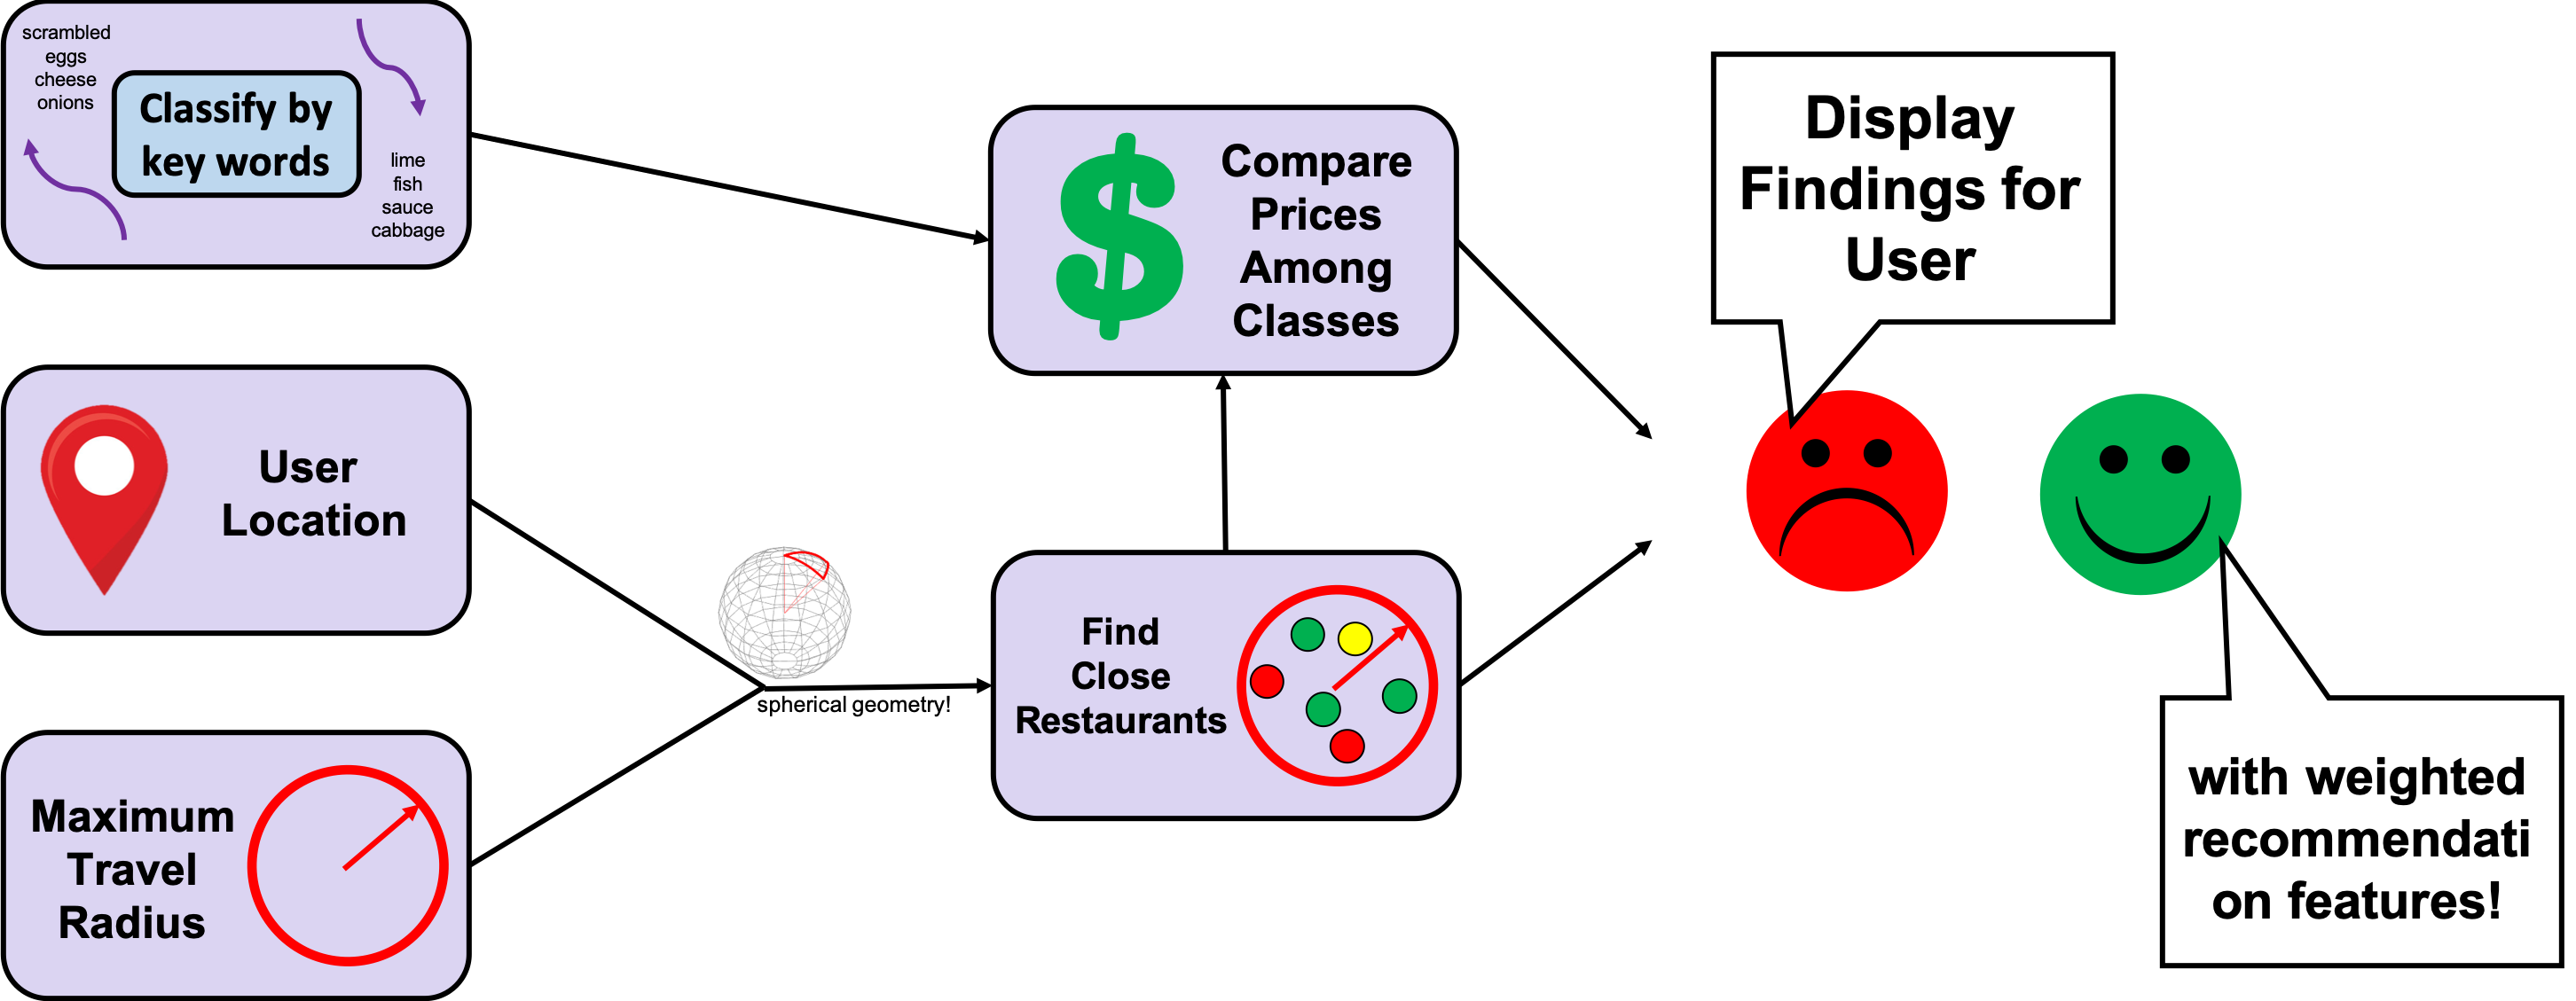
One of the key functions of the project is to sort and rank items, a problem which Levi and Evan tackled using a combination of data models. Levi started off by classifying items using a topic clustering model. This looks at combinations of keywords in item descriptions to identify what type of item it is. Manual inspection of these clusters revealed recognizable classes, such as rice and bean burrito, or ground beef taco. Evan then took this classification method and used it to subset the full dataset. Then, he used another set of description keywords to calculate the average prices for items featuring each keyword. A simple linear model was then constructed which predicts the price for an item based on its keywords. Evan then constructed a metric which computes how good of a deal an item is, which is its expected price over its actual price.
This scoring algorithm is then implemented by the web front-end, run by Sola. It prompts the user for different filters, such as search radius. These factors are then passed to Cat's code, which uses spherical geometry to accurately subset out the entries which are within the specified radius of the user.
When combined, this results in a seamless user-experience which recommends nearby tacos to a user based on distance and value relative to price. It ensures that consumers receive the best meal, and that all businesses receive fair recommendations based on quality, rather than size. This strengthens communities and local economies.
Show equation
How we built it
Framework
Our project is hosted as a live web app built on Webflow which pulls in our expanded dataset using a Tableau plug-in. It also features a Python neural network which interfaces between our Python analysis scripts and Tableau.
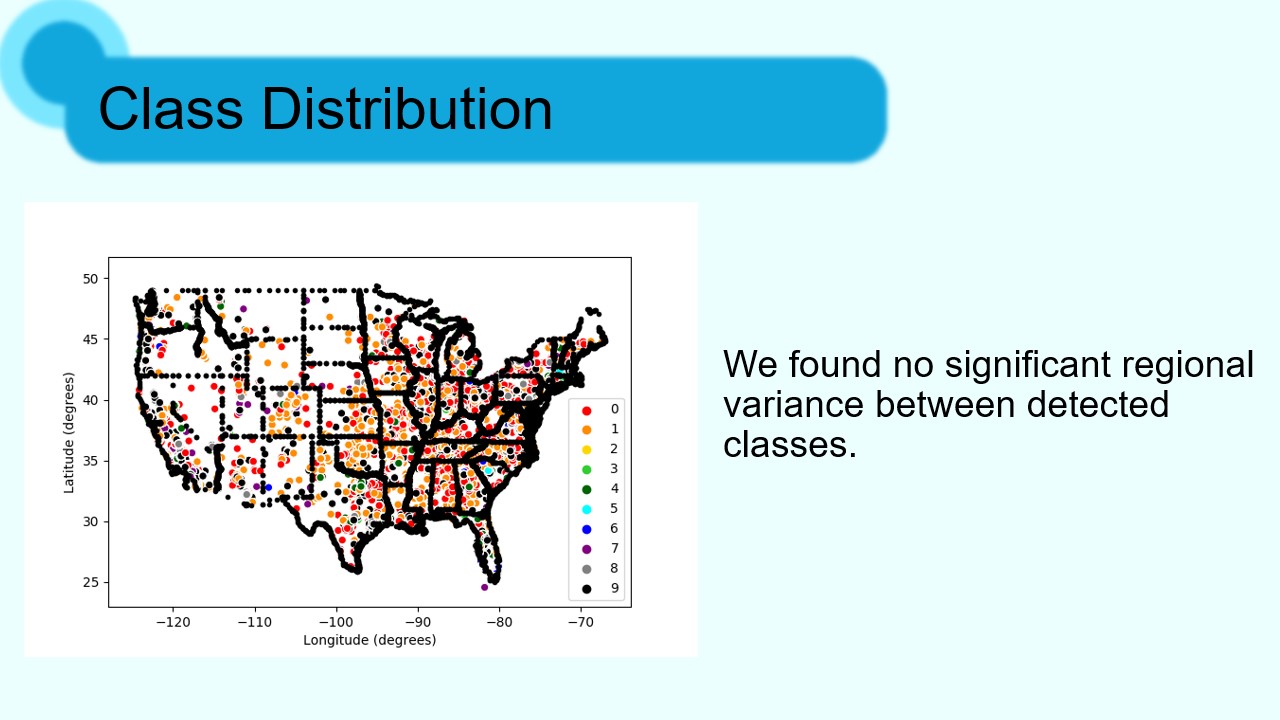
Our project uses a topic classifier from scikit-learn to identify item type clusters based on keywords in their descriptions. After testing variations of multiple model parameters, we achieved best results using 10 categories. A manual inspection of the top keywords for each category revealed recognizable classes of items, such as egg and sausage breakfast tacos, or fish tacos.
Scoring is done by a separate Python script which uses custom functions to calculate price distributions for each keyword and calculates resulting expected prices. All of this data used by different scripts is stored centrally in a .csv plugged into Tableau.
Data use
We started our analysis by trimming out empty columns from the dataset and restricting it to entries within the United States. This was done to ensure a statistically significant number of samples in a given geographic region, since non-US regions were sparsely populated. Additionally, it allowed us to focus on our target domestic market.
After cleaning the data, we expanded it using our classification model. These classifications were then used to subset the data and develop a linear price prediction model which used price statistics for each keyword. A scoring metric was then calculated using the "value" of the taco (the expected price) divided by the actual price. Thus, tacos which are cheaper than their quality would imply have higher scores since you are getting a better product for the money.
Next, we developed a Python script which subsets the data into entries within a given radius of a given point. One of our mathematicians used spherical geometry to ensure accurate distance calculations taking into account Earth's curvature. That ensures the most accurate results whether you're in Arizona, Alaska, or somewhere in-between!
Finally, all this is fed into an interactive map which the user can utilize to find the best bang-for-your-buck taco in a given region. The geometric methods ensure accurate calculation of contender restaurants, while the sorting and scoring methods help users make an easy, informed choice based on factors which are not immediately obvious without mathematical models. In short, it presents a usable guide and visualization to our analysis of optimal taco spots in a given area.
Challenges we ran into
Team issues
One of our members, Levi, got sick on the first day and was unable to complete his topic analysis of the dataset. He was integral to creating the analytic approach which found the keyword correlations to each object category. His work was fantastically clear and concise, allowing other members to finish applying his classifications after he left. Had he continued, he would have performed a sentiment analysis to more accurately approximate the value of a given taco, thus boosting the performance of our scoring algorithm. We made adjustments to overcome this by using the deal metric by itself instead.
Our team also became heavily involved in the workshops, and spent a lot of time assisting the learner track team members. One of our members spent 2 hours teaching a beginner developer how to do machine learning with Python and Excel. While this did hamper our productivity somewhat, we wanted to make sure that we were embodying the community values that our project stands for by educating those around us.
Validation
After calculating deal metrics over the whole dataset, we analyzed basic statistical parameters for the variable's distribution. It gave a mean and median of approximately 1, which is in line with expectations for an accurate prediction algorithm. This is because it means that, on average, the expected price equals the actual price. The variance between actual and expected is what offers us insights into which items deliver disproportionately high or low value relative to their price, which is the key factor in our ranking.
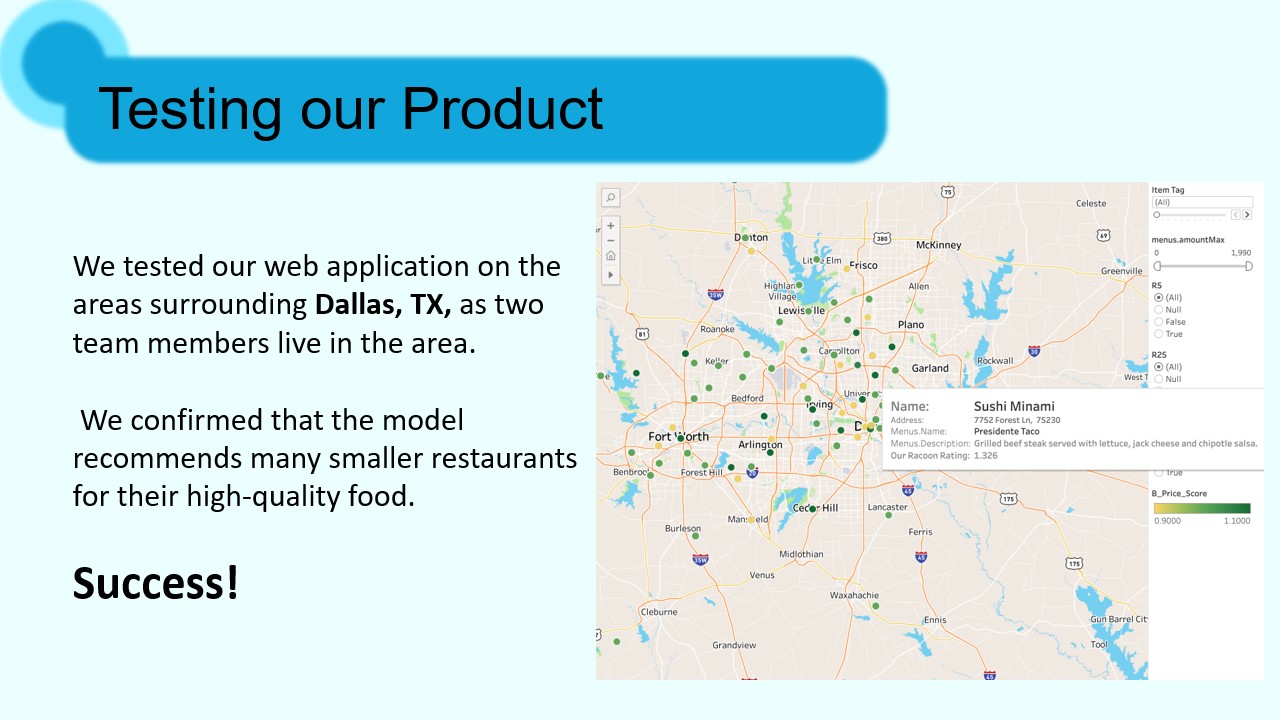
Additionally, our mapping methods were clearly accurate, since clusters emerged in the approximate location of cities. This shows that our spherical geometry allowed us to obtain a more accurate visualization of restaurants in the user's area.
Accomplishments that we're proud of
Models & Analytics
The classifications successfully resulted in recognizable categories of foods, which could be verified by manual inspection. Additionally, the deal metrics were found to have a distribution centered around a mean of 1, which implies that, on average, the expected price is equal to the actual price. The variance in this variable is what results in the great spread of scores which help to rank restaurants in a given area.
We ran tests of our project with a test location set near UT Dallas' campus. This allowed two of our team members, who are from there, to validate that it was finding quality, local restaurants as well as large chains. It performed quite well in that regard, and the web app ran without hindrance.
Impact
Small businesses suffer from a lack of visibility, especially to non-locals, as people prefer the more predictable, standard offerings of large chains. We aim to level the playing field for local restaurants by providing evaluation metrics based solely on quality. Our project delivers on this goal by providing statistically complex, yet accurately validated models which rank items based on a number of attributes. As a result, customers can always find good tacos near them.
What we learned
Because our team members come from diverse academic and professional backgrounds, we were all able to teach each other about our personal areas of expertise. For instance, Sola had a lot of front-end and web-stack experience, so he was able to lead us through the creation of our website. By the end, Cat had learned so much from him that she was making her own additions to the site, and was even the one to launch it on the domain! In return, Cat taught Sola about implementing python executables. A similar exchange took place between Levi, who has a strong background in clustering, and Evan, who has a working knowledge of business analytics. Finally, everyone learned more about solid database management practices, as keeping an updated .csv on Tableau was a critical part of our project.
What's next for the Regression Raccoon Restaurants
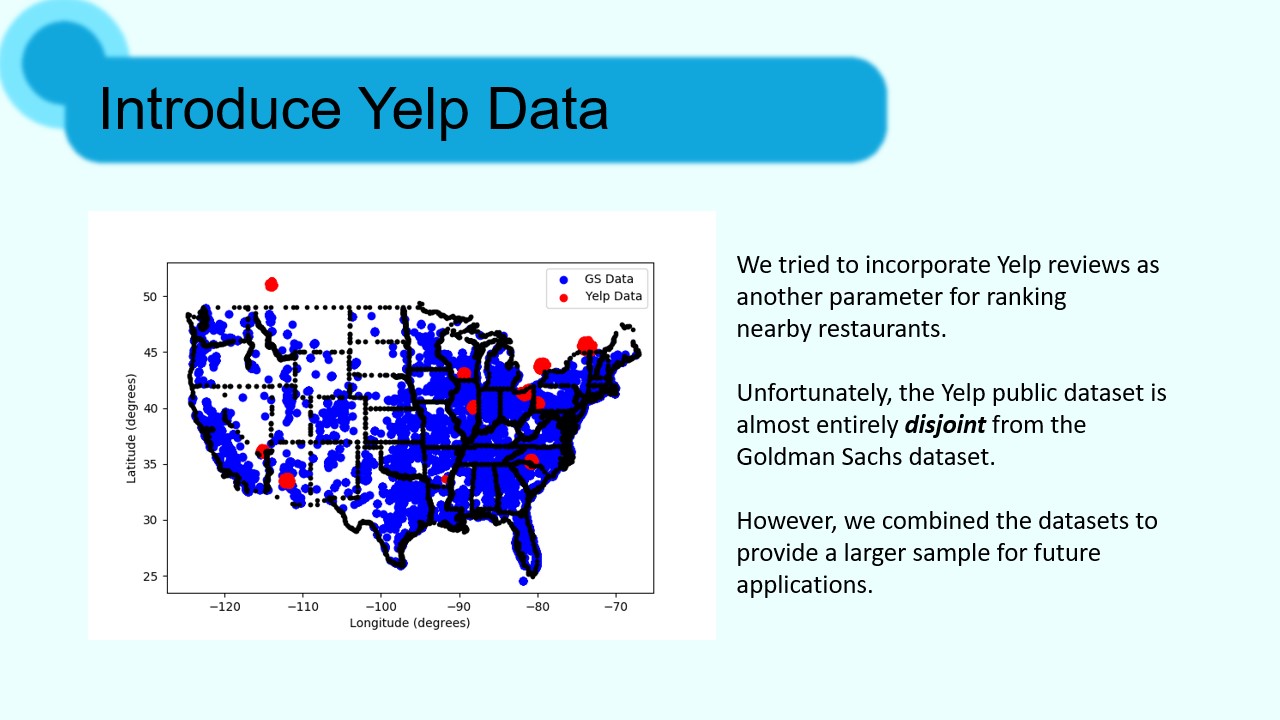
We are looking to continue expanding our dataset with more external information from review sites and user-submitted reviews. This will help us ensure a wide coverage of all businesses, regardless of size. Additionally, we hope to improve our scoring algorithm by incorporating the sentiment analysis that we were unable to complete during the hack. Obviously, any improvement to that algorithm will boost user satisfaction with the recommendations, making repeat use more likely, and aiding our goal of supporting local businesses.
We also managed to dig a bit into using ML options using the workshops and we plan on building a machine learning model to take our information from yelp with our key word categories to make a better algorithm that can identify other kinds of foods besides tacos and burritos.

Log in or sign up for Devpost to join the conversation.