-
-
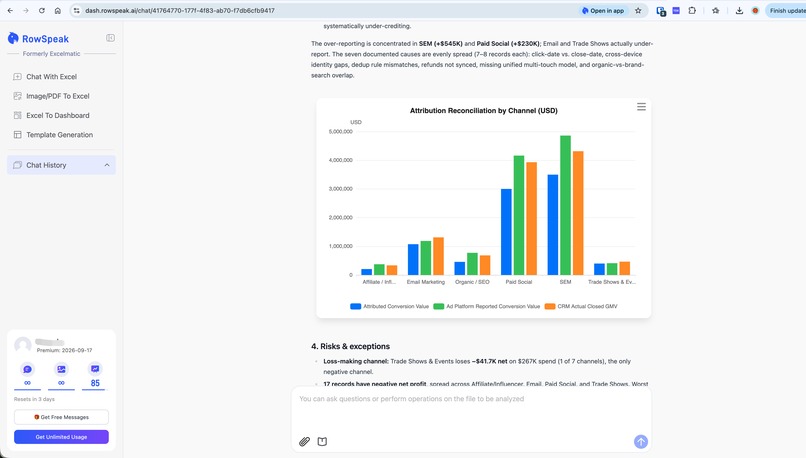
Using RowSpeak AI to generate charts
-
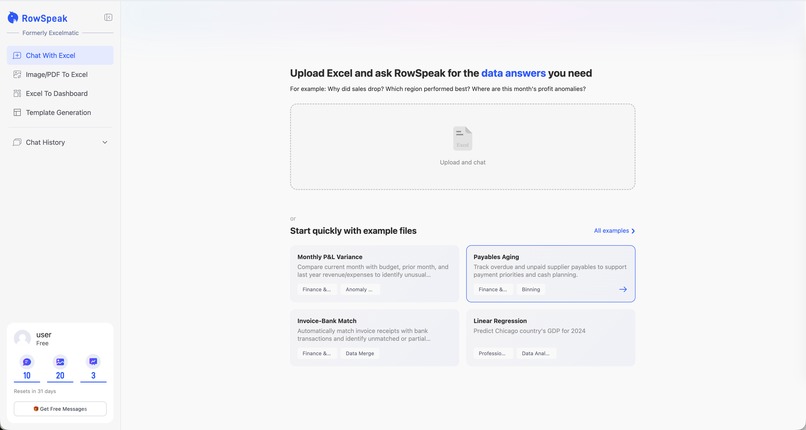
RowSpeak AI can do many kinds of data analysis works
-
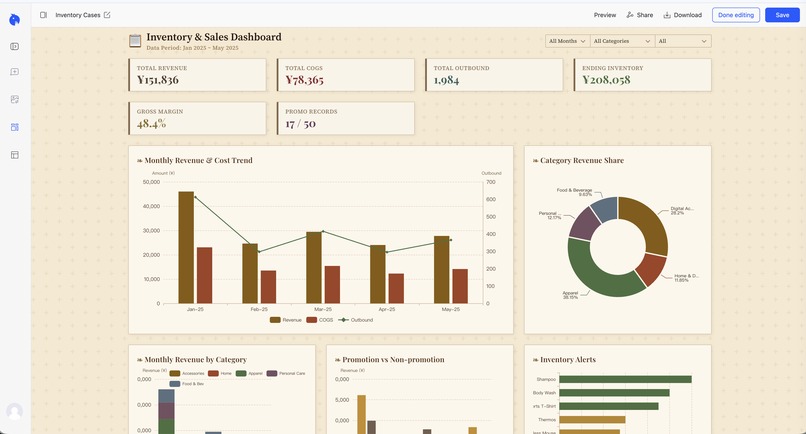
Using RowSpeak AI to generate interactive dashboard
-
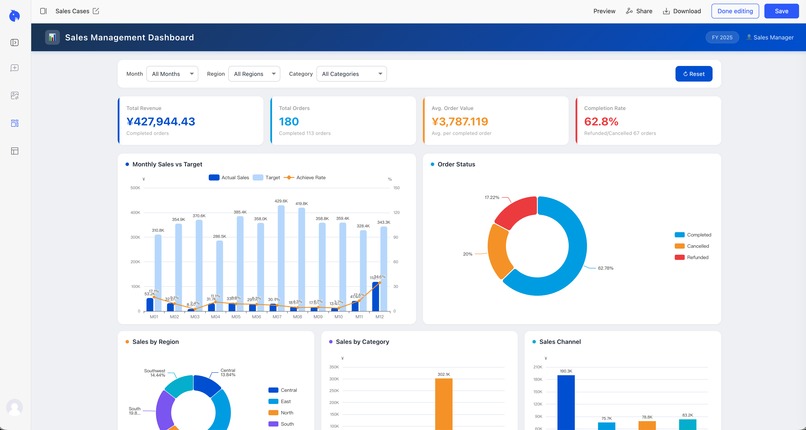
Using RowSpeak AI to generate interactive dashboard
-
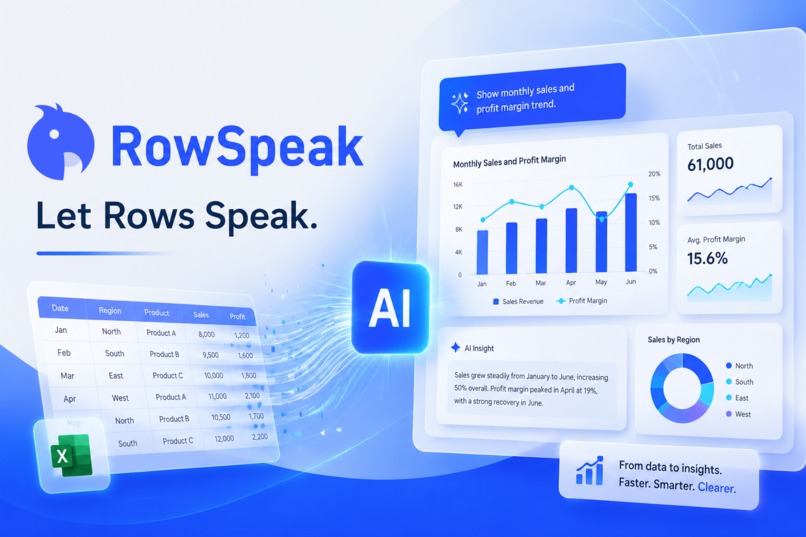
RowSpeak, Let Rows Speak
-
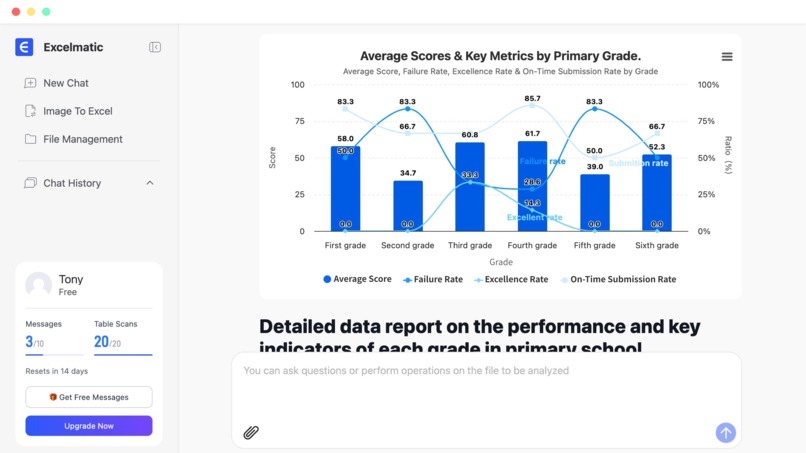
RowSpeak do the analysis
Inspiration
Every day, millions of professionals waste countless hours on repetitive manual data analysis. They get bogged down struggling with complex Excel formulas, designing custom charts, and trying to build functional BI dashboards. As a result, founders, operators, and small business owners are often left making critical business decisions without timely data support simply because the technical barrier is too high.
We built RowSpeak to eliminate this friction: Get insights, charts, and dashboards in seconds—not days.
What it does
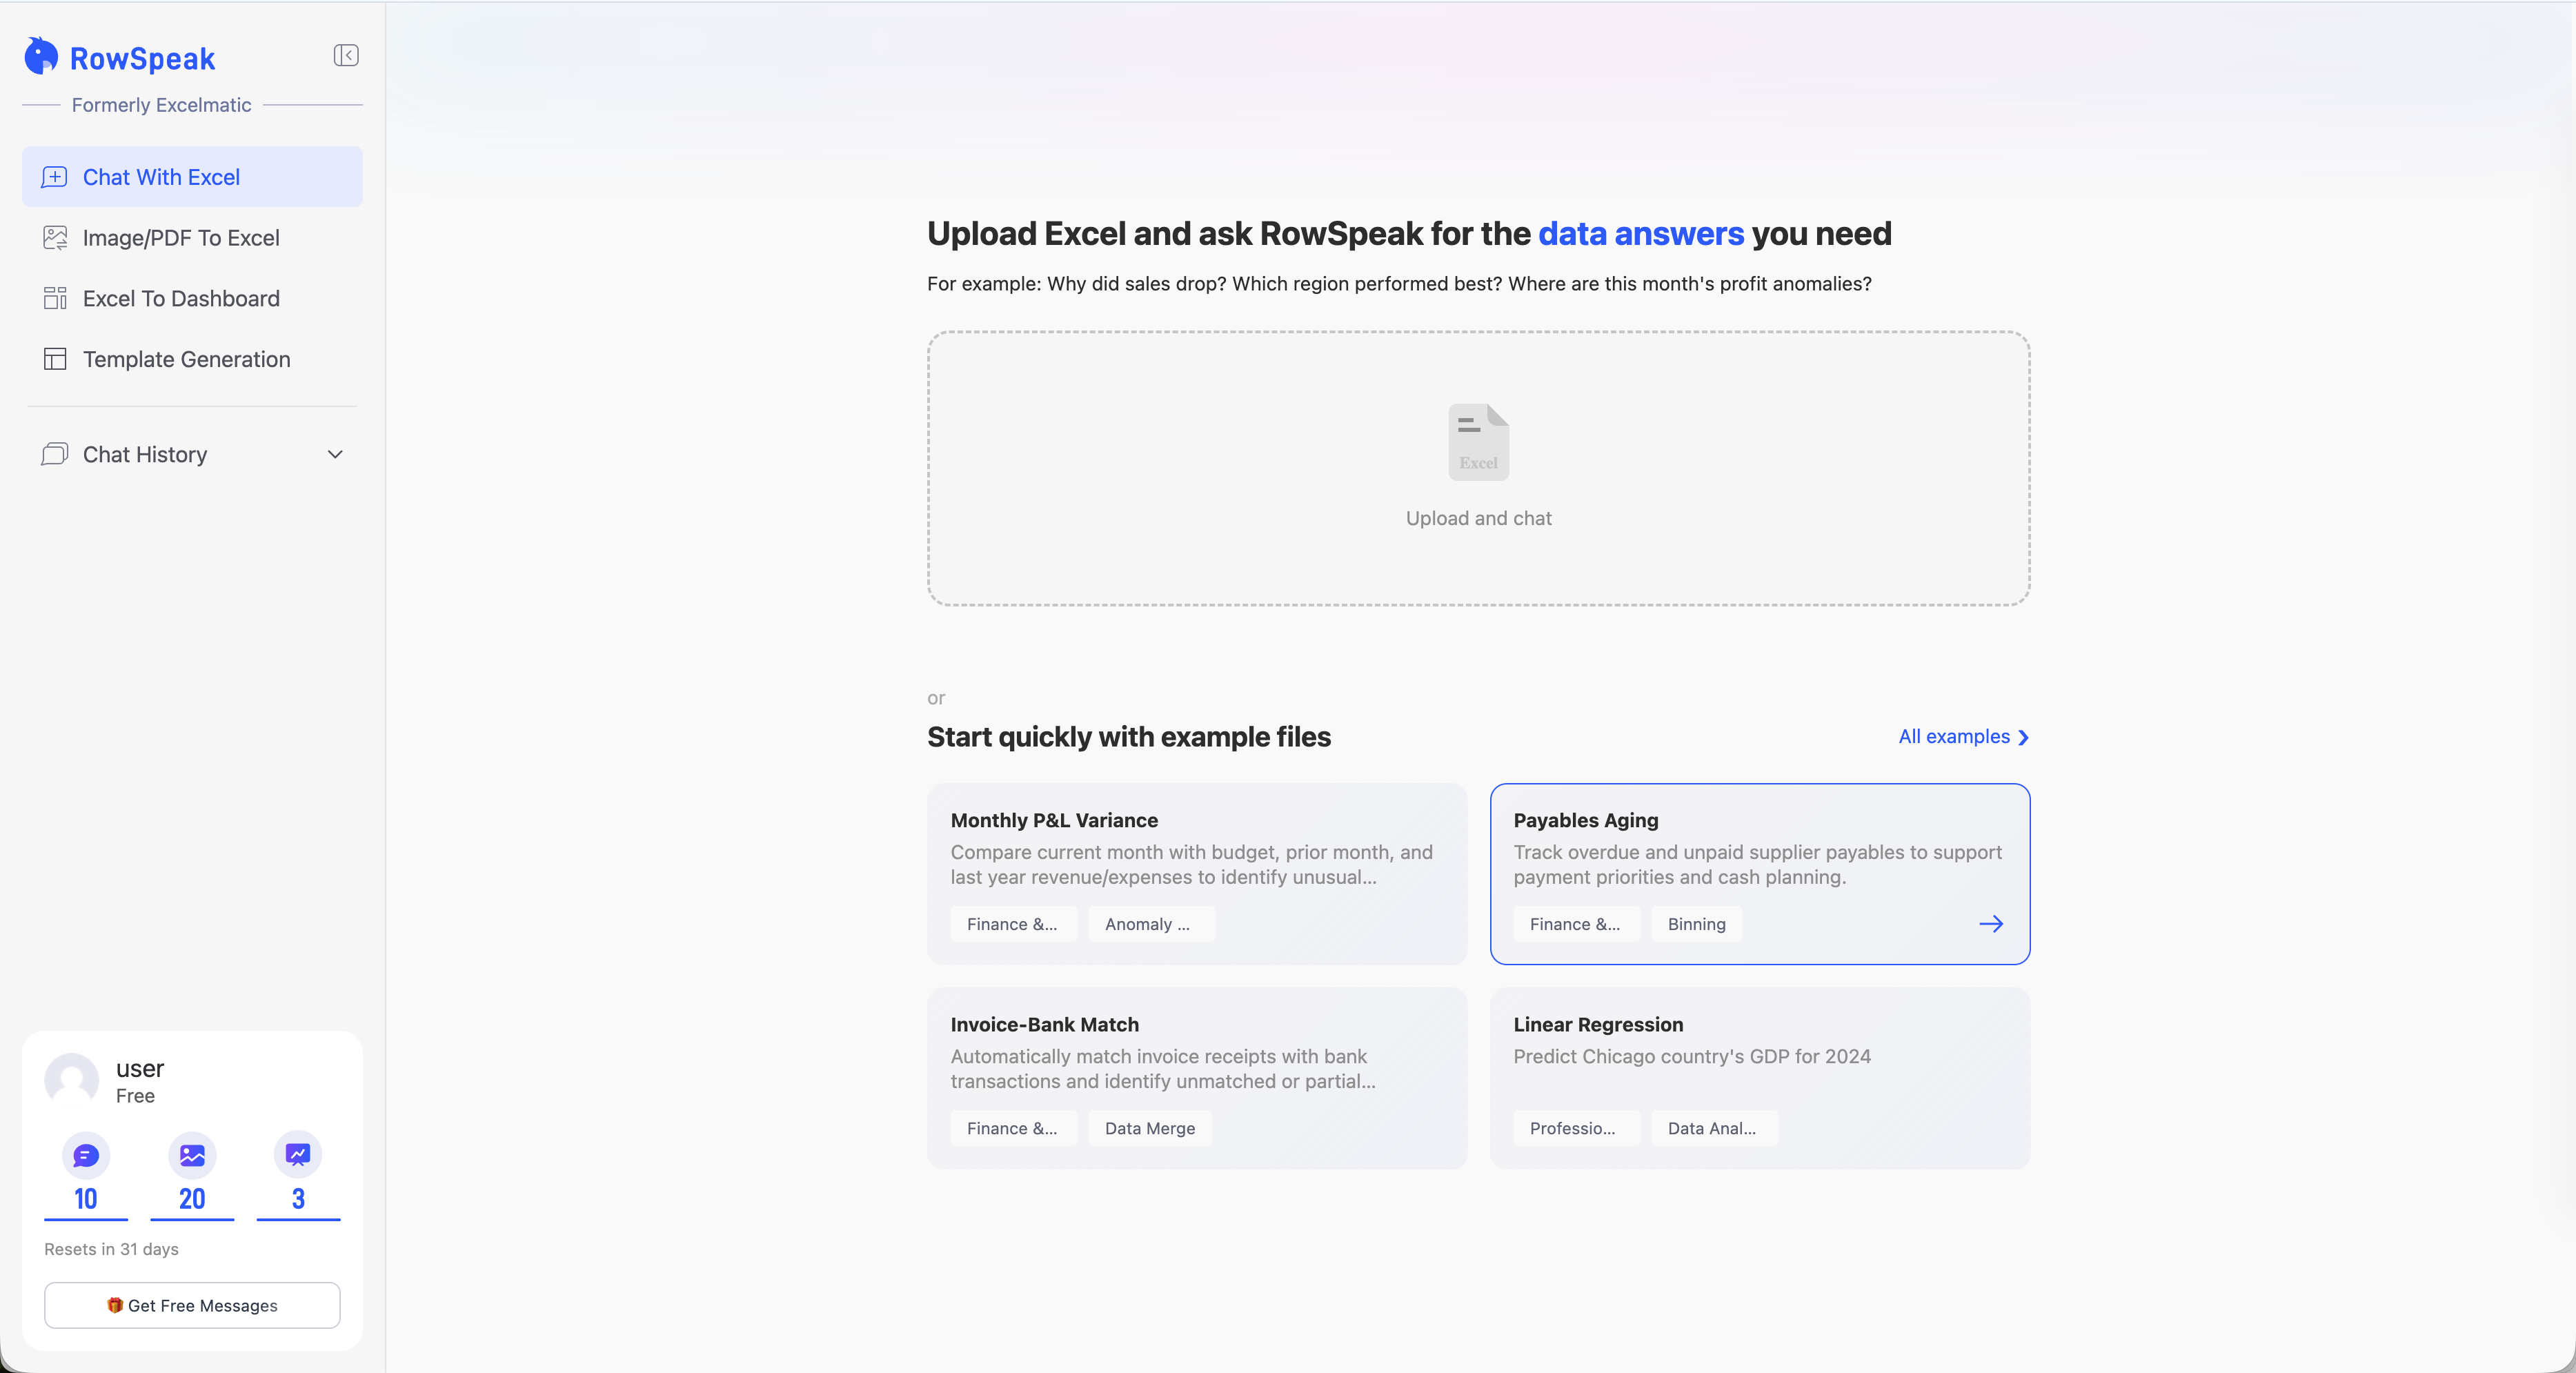
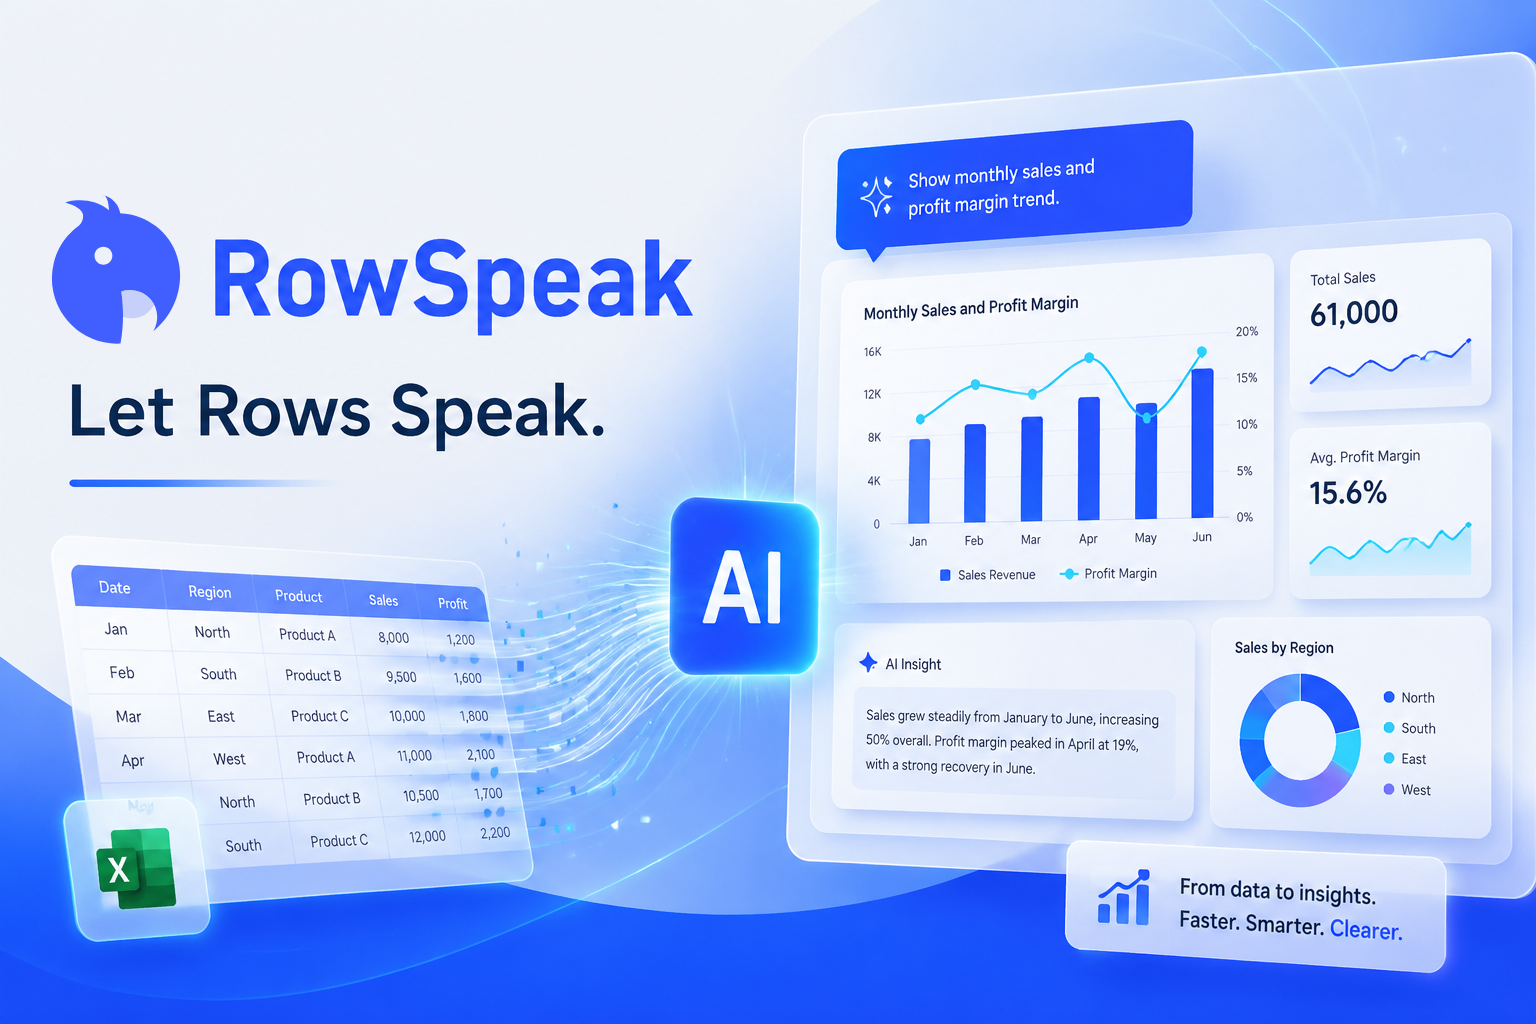
RowSpeak is an AI-powered spreadsheet and data analysis assistant that turns raw files into executive-ready outputs through simple plain English commands.
- Multi-Format Data Ingestion: Upload Excel spreadsheets, CSVs, PDF tables, or even raw screenshots/images, and RowSpeak immediately extracts and cleans the data.
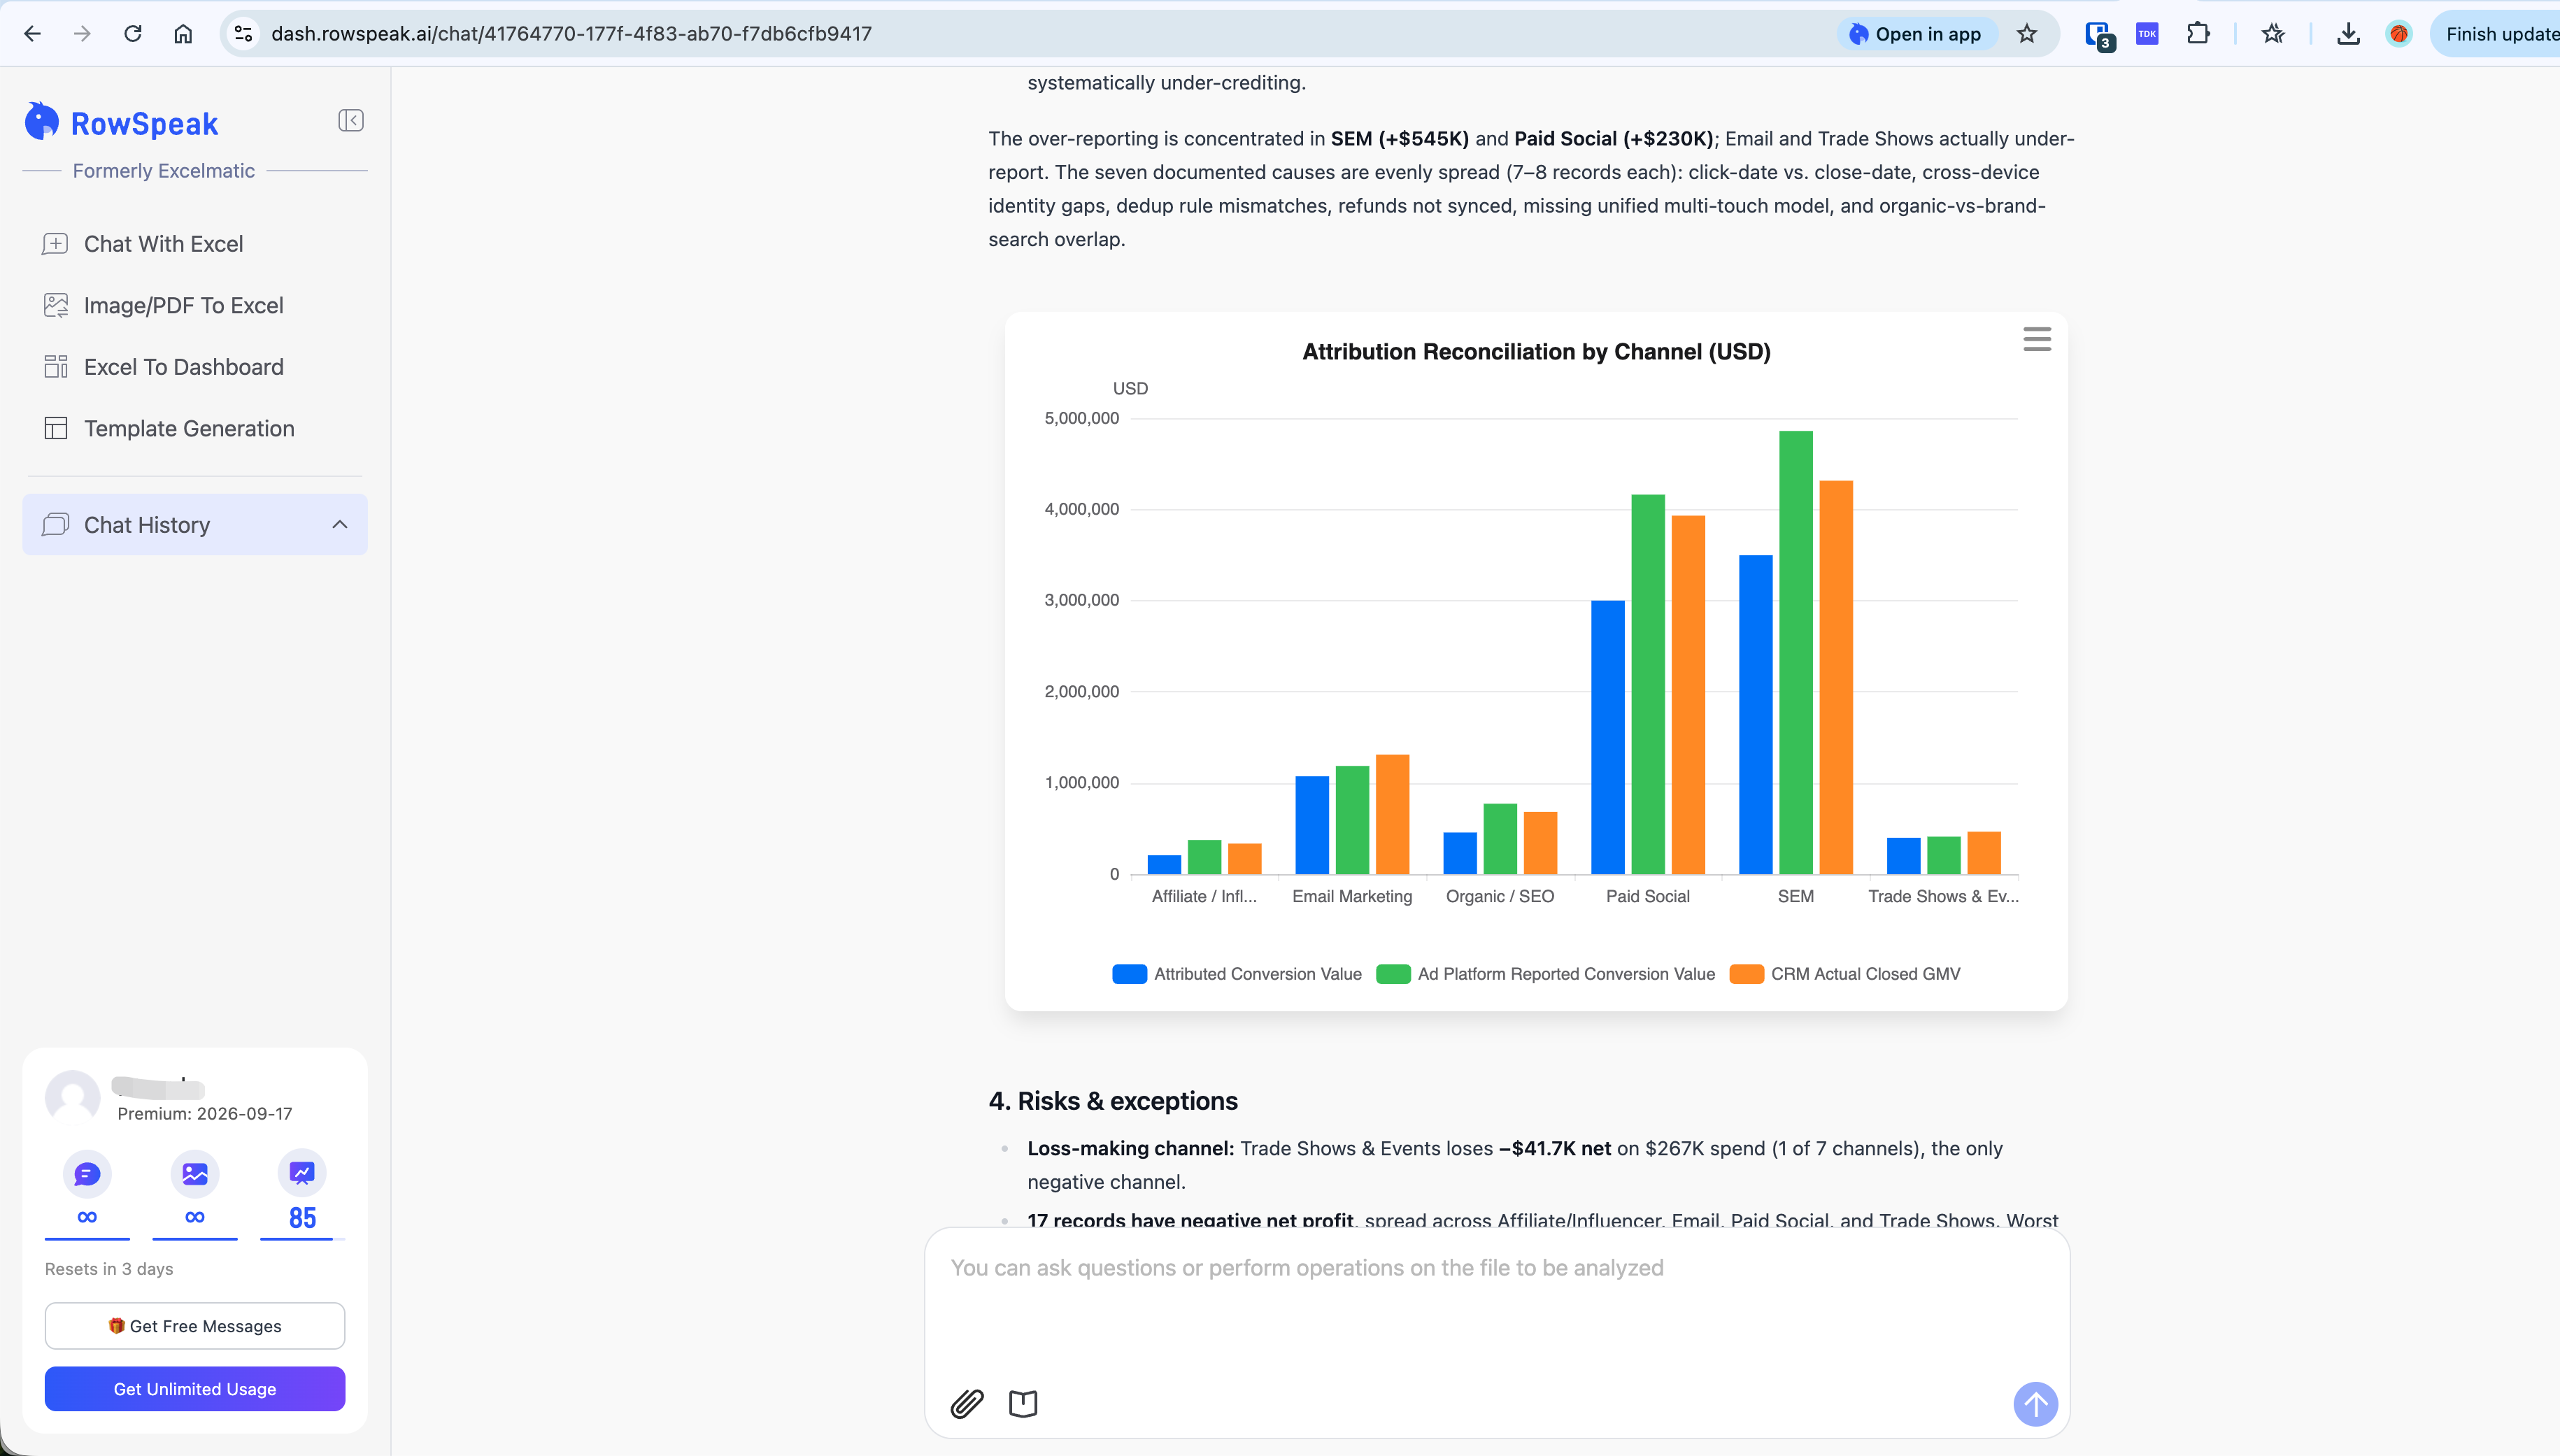
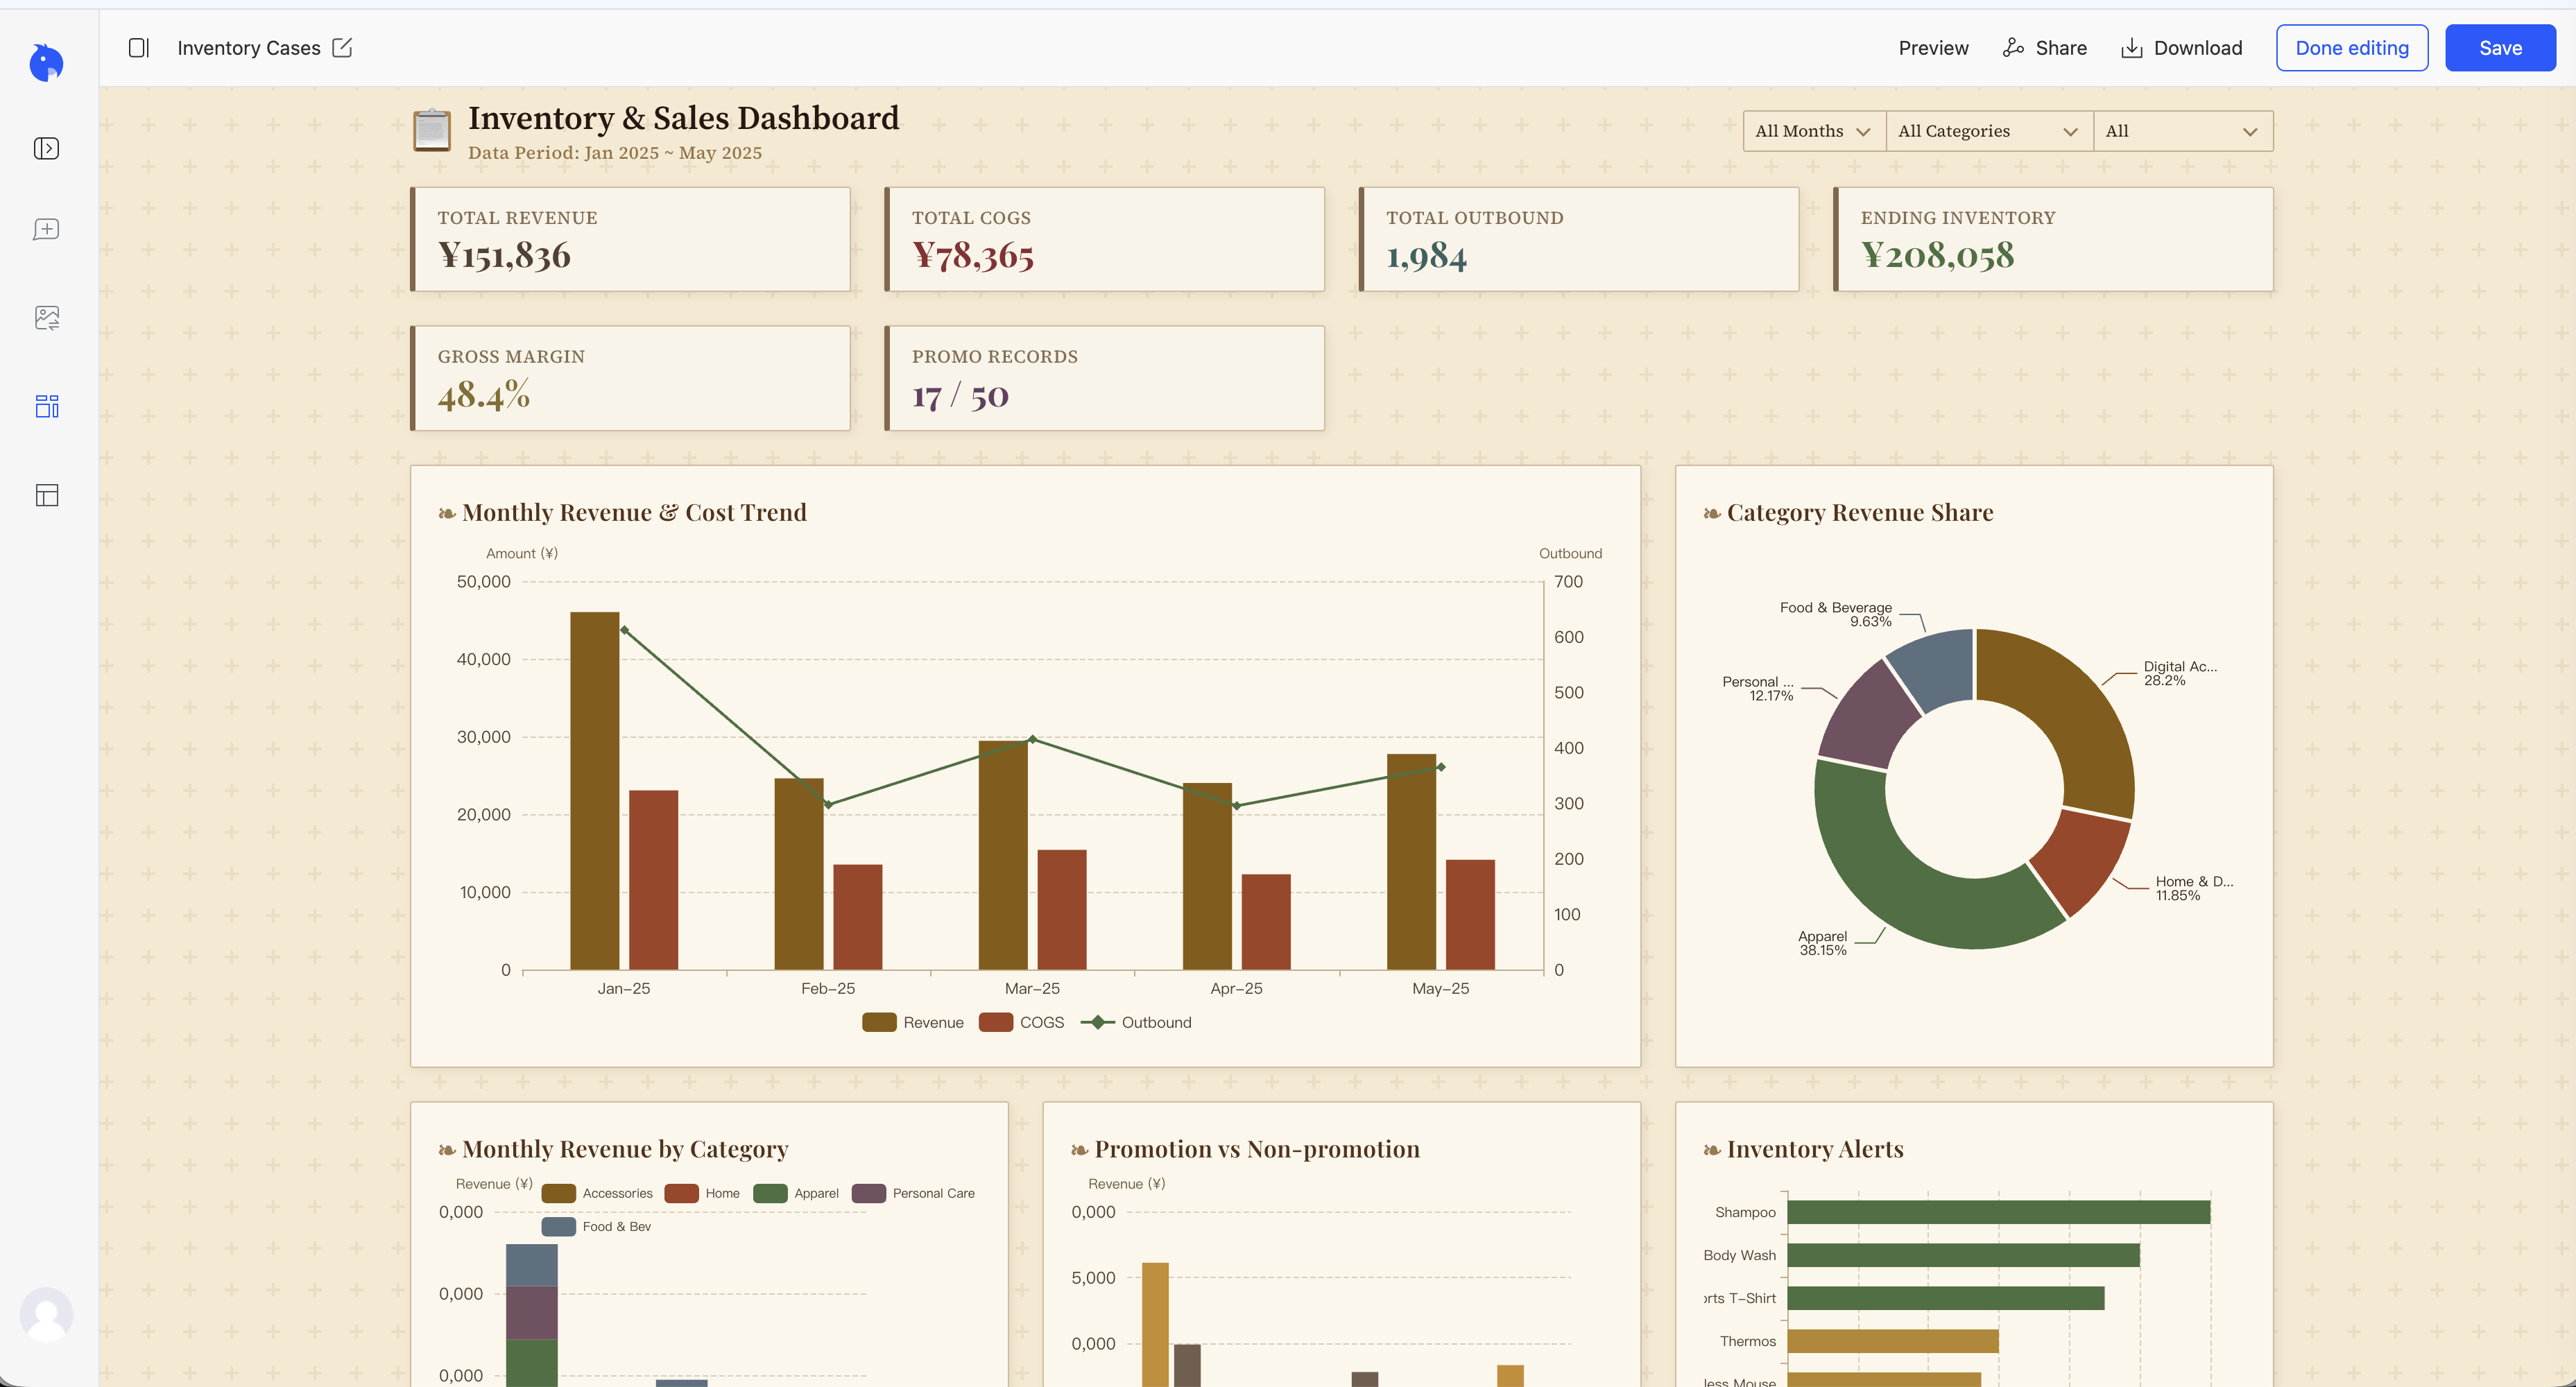
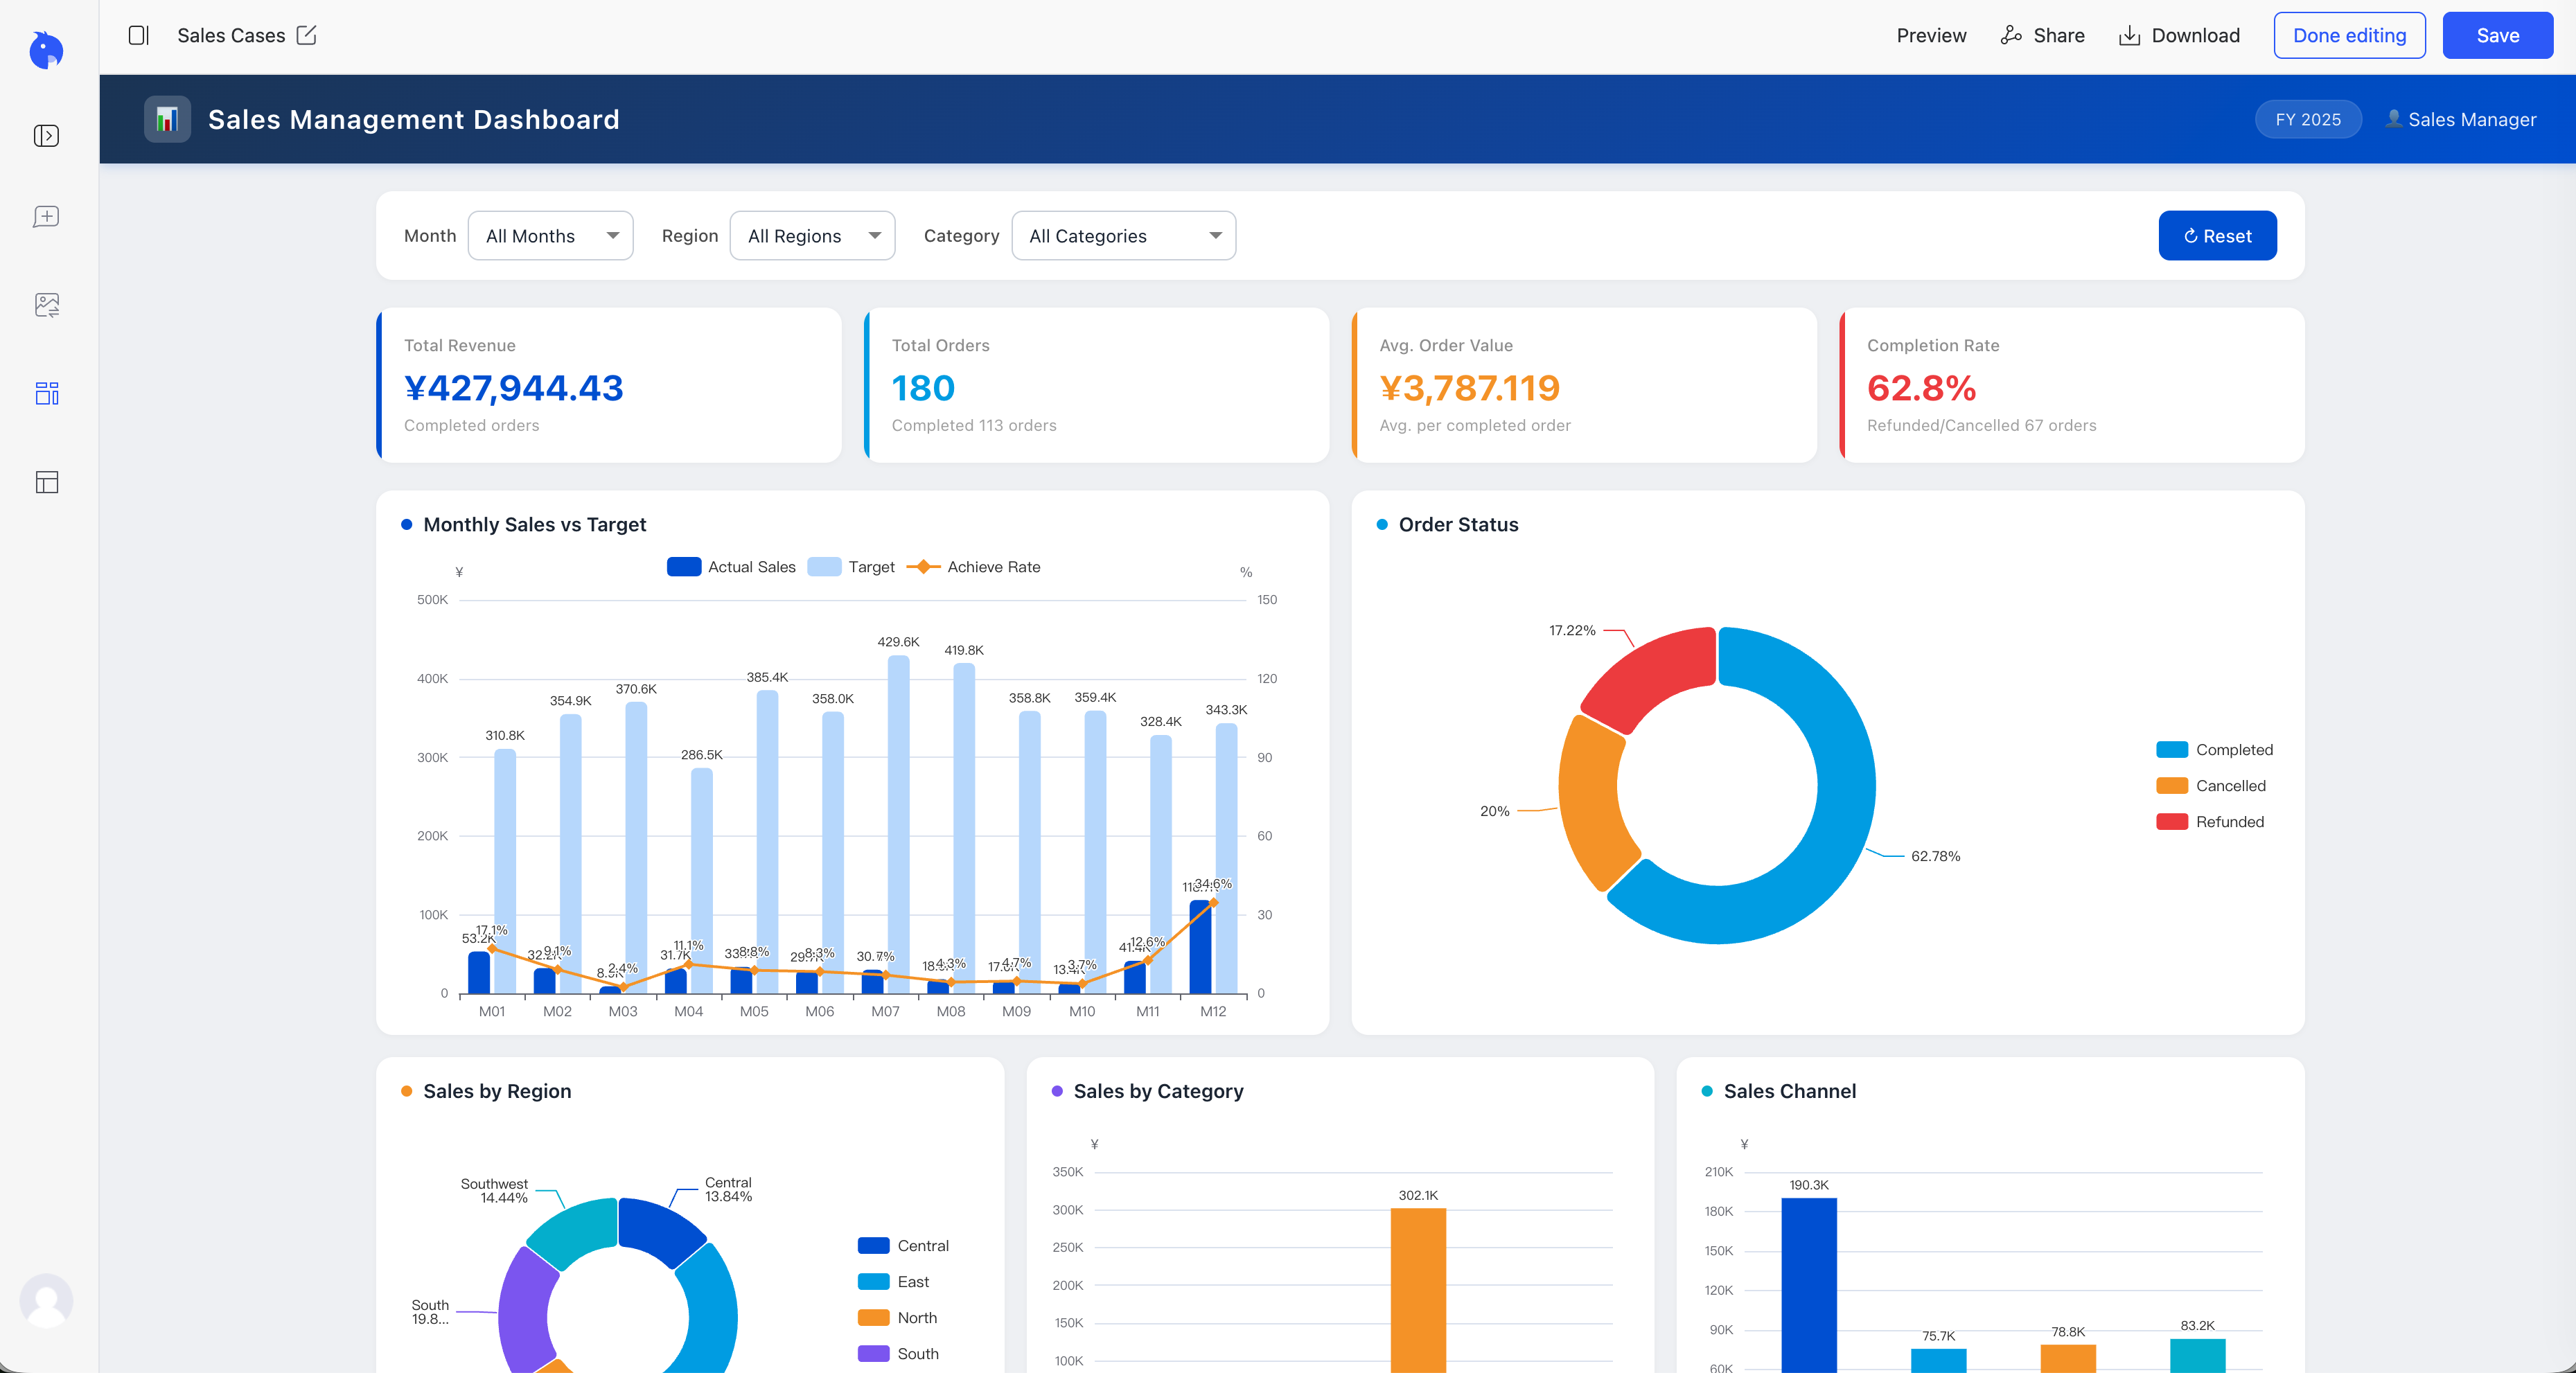
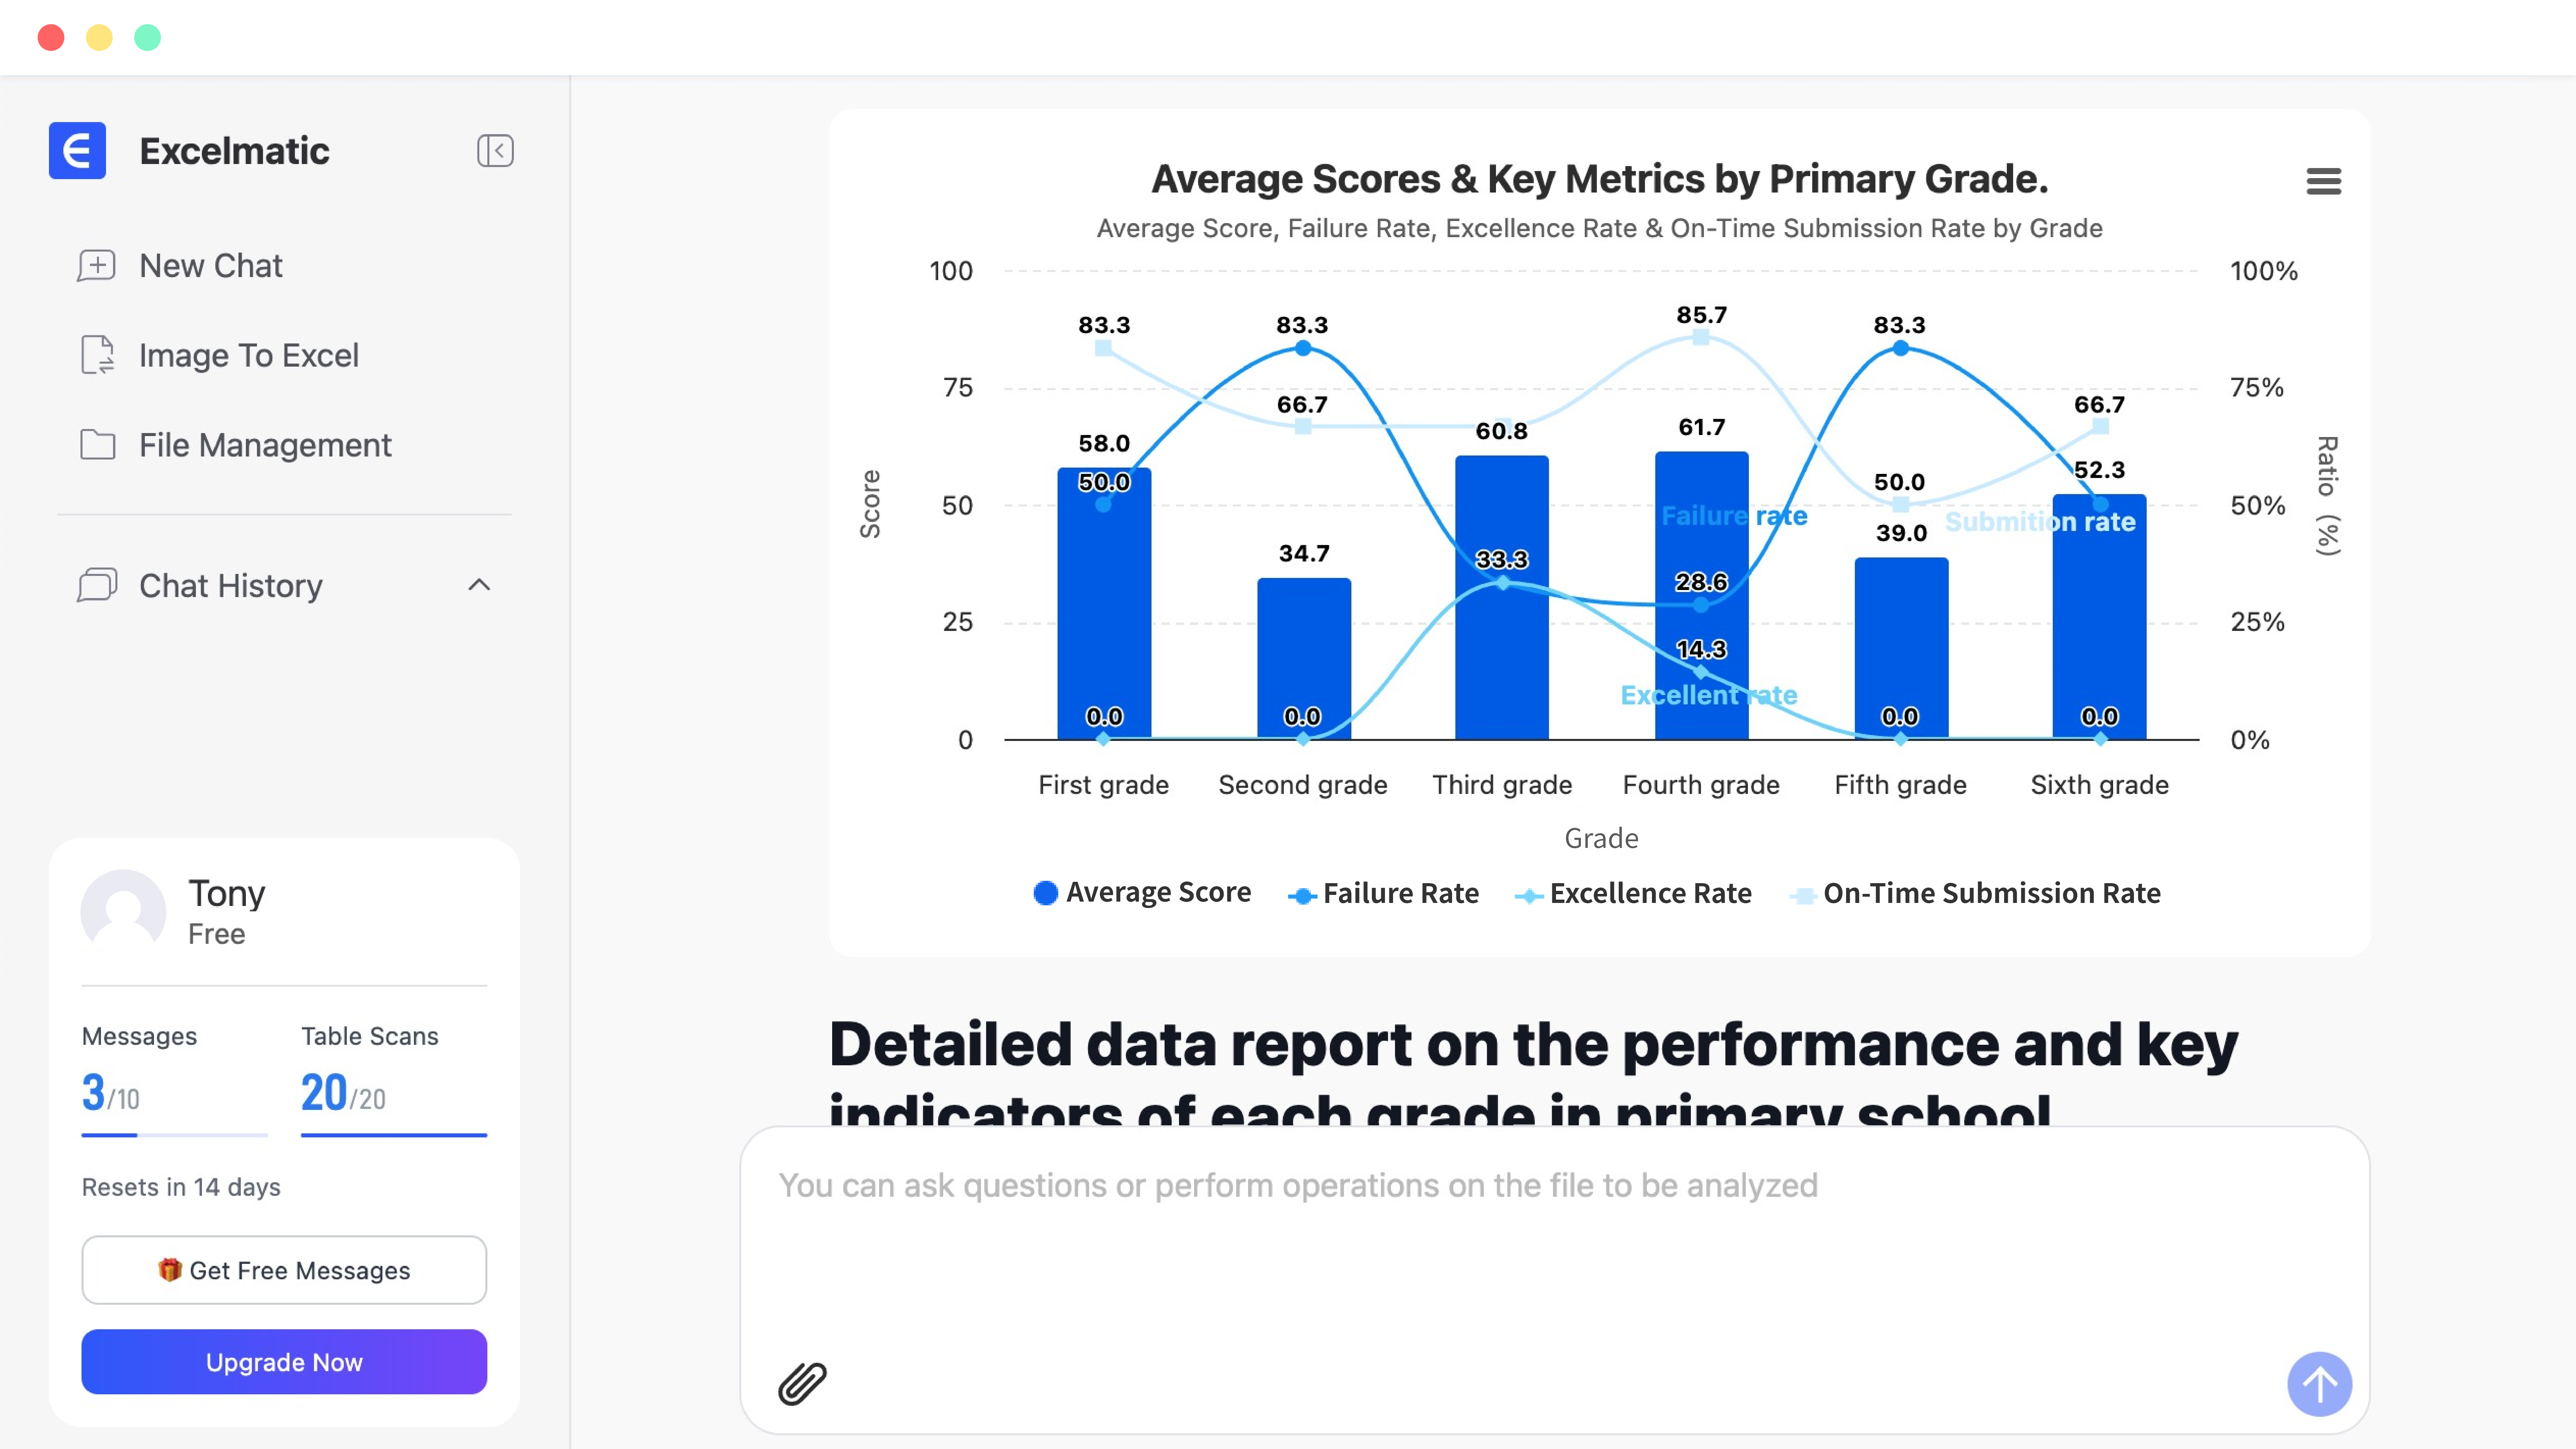
- Instant Visualizations & Dashboards: Turn complex datasets into clean bar graphs, line charts, and interactive dashboards with a single click.
- Natural Language Querying: Ask questions directly about your numbers to perform variance analysis, spot anomalies, and understand underlying business drivers without touching a single VLOOKUP or Pivot Table.
- Reviewable & Actionable Reports: Generates board-ready summary reports and structured tables that can be easily refined, exported, or presented to leadership.
How I built it
RowSpeak was built to bridge the gap between unstructured data exports and polished business intelligence:
- Parsing & Extraction Engine: Integrated document processing models to accurately parse tabular data from PDFs, images, and unformatted spreadsheet exports.
- LLM & Analytics Pipeline: Combined LLMs with standard data processing pipelines to accurately interpret user intent, execute accurate calculations, and return clear data insights.
- Dynamic Frontend & Charting: Developed a responsive interface using custom charting libraries to generate interactive, editable dashboards and customizable visual themes on the fly.
Challenges I ran into
- Handling Messy Real-World Spreadsheets: Raw exports are rarely clean. Resolving inconsistent headers, merged cells, missing values, and mixed data types across different file formats required extensive tuning.
- Ensuring Computational Accuracy: LLMs can struggle with precise numeric aggregation. We engineered an architecture that separates natural language intent interpretation from deterministic mathematical calculations to ensure 100% data accuracy.
- Tailoring Outputs for Decision-Makers: Designing an intuitive UI that gives users immediate insights without cluttering the screen while retaining full control for manual edits and customizations.
Accomplishments that I'm proud of
- Built a end-to-end workflow where non-technical business users can transform a raw CSV into a full KPI dashboard in under 30 seconds.
- Enabled accurate image-to-Excel and PDF-to-Excel table conversions in one click.
- Successfully bridged the gap between flexible natural language AI interaction and structured, presentation-ready business outputs.
What I learned
- Usability Over AI Hype: Users don't just want a chatbot; they want actionable outputs, clean visuals, and reviewable tables they can present right away.
- Data Reliability is Non-Negotiable: In business reporting, close enough isn't enough. Precision in data processing builds trust faster than fancy conversational interface features.
What's next for RowSpeak
- Team Collaboration & Shared Dashboards: Launching collaborative workspace features so teams can share interactive reports and live metrics seamlessly.
- Automated Recurring Workflows: Scheduled weekly/monthly reporting workflows that automatically process new data drops and email executive summaries.
- Deeper Database & Tool Integrations: Direct connections to platforms like Shopify, Stripe, and Google Sheets for real-time automated analytics.


Log in or sign up for Devpost to join the conversation.