-
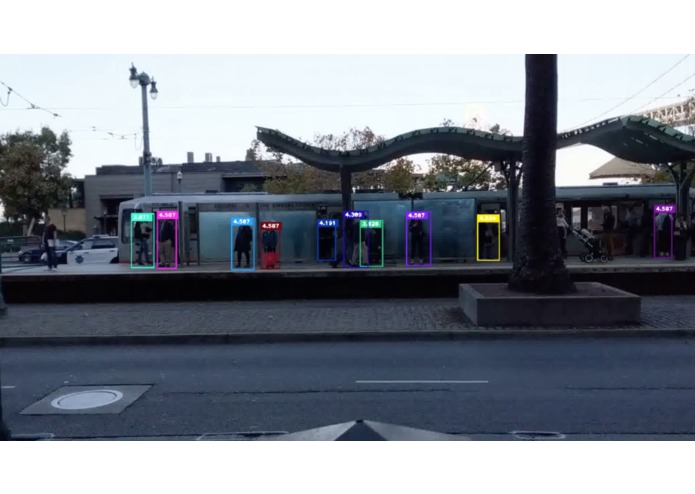
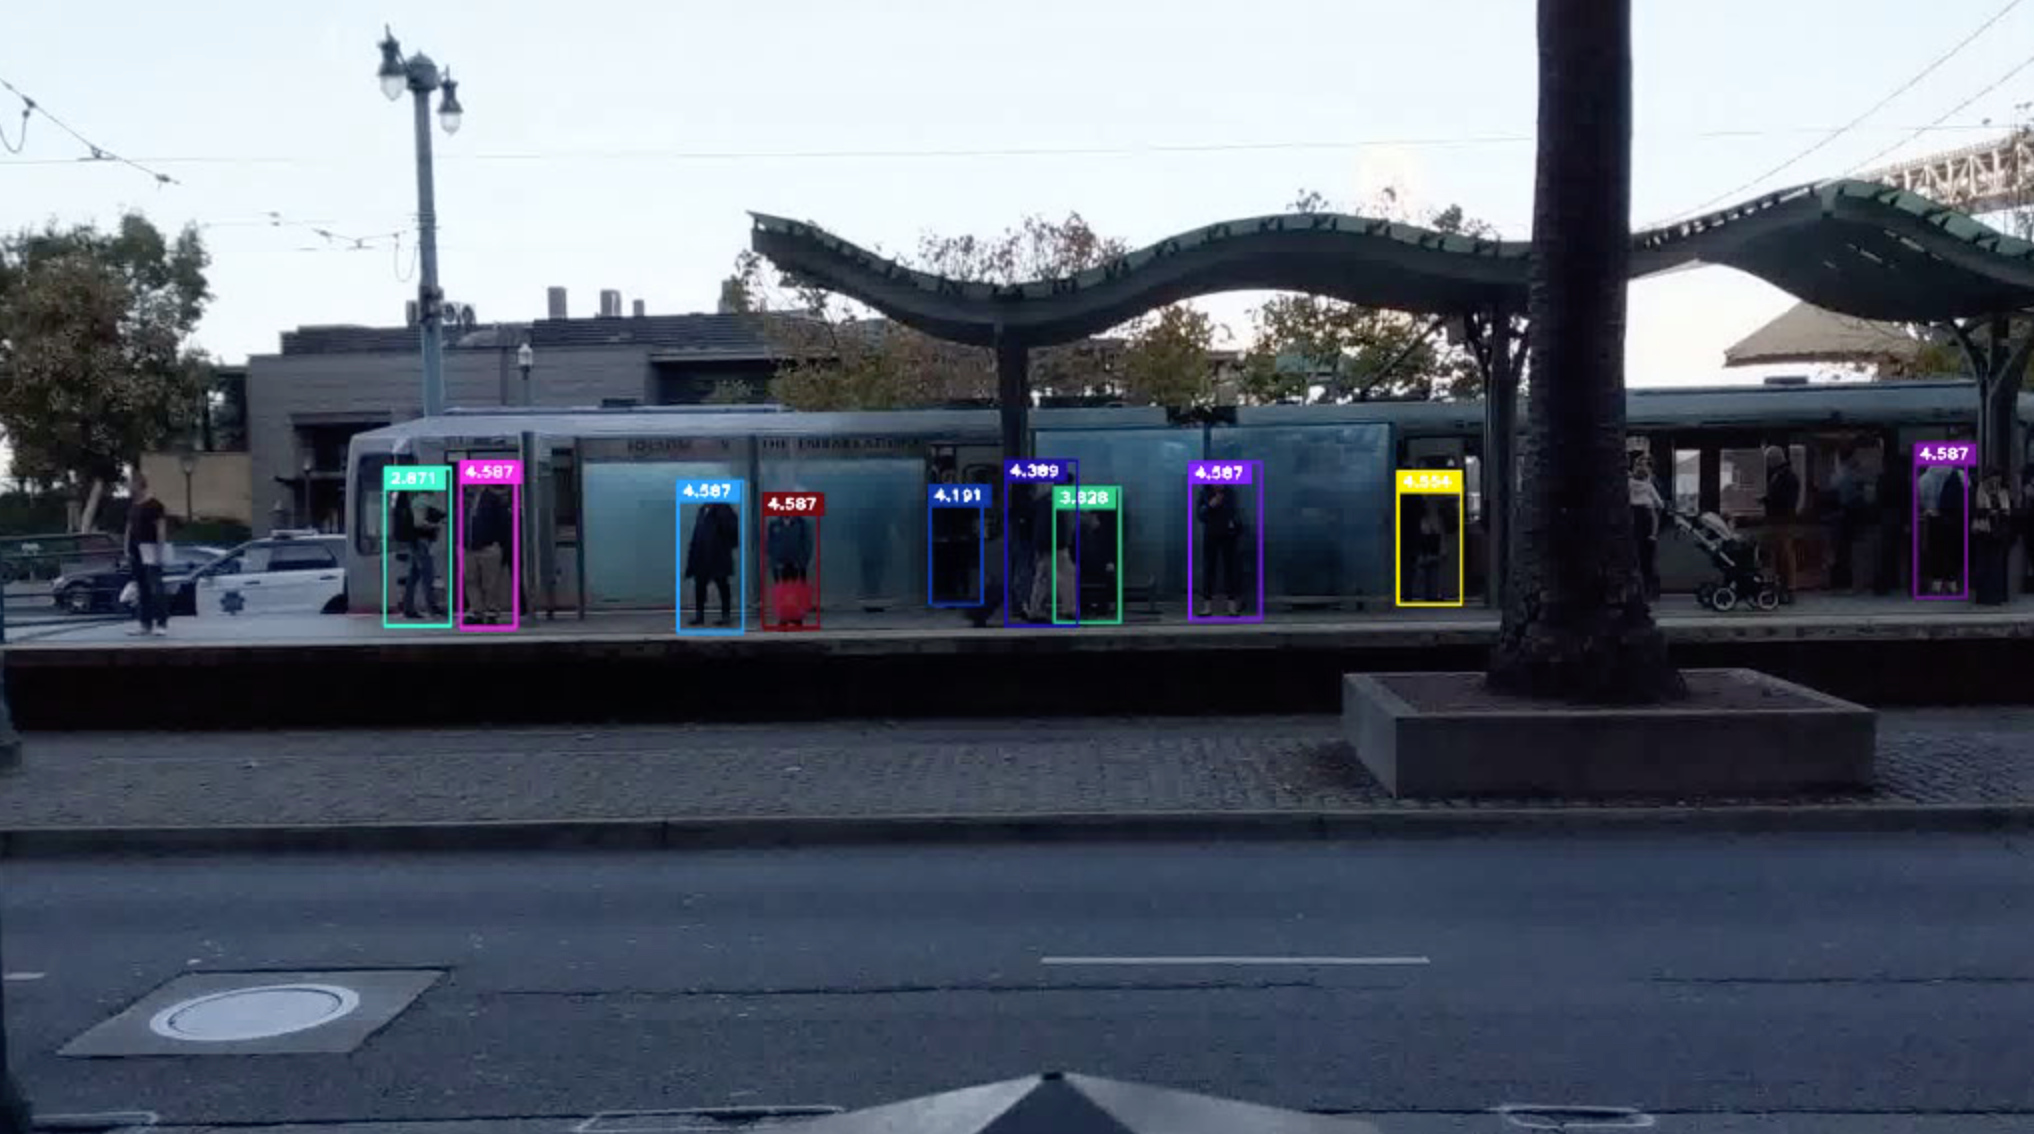
People counting
-
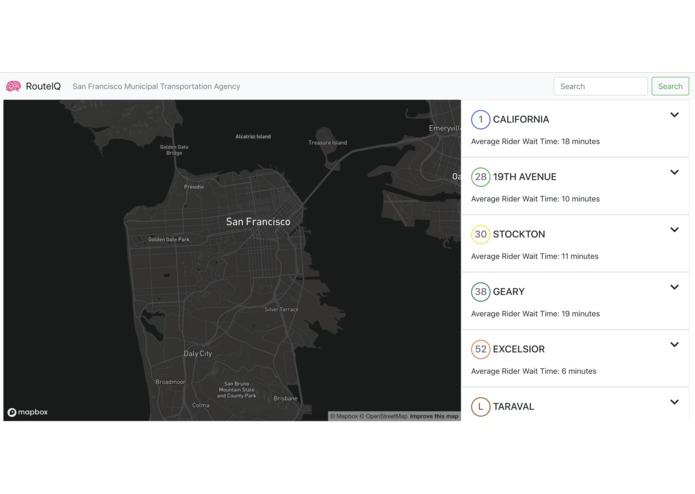
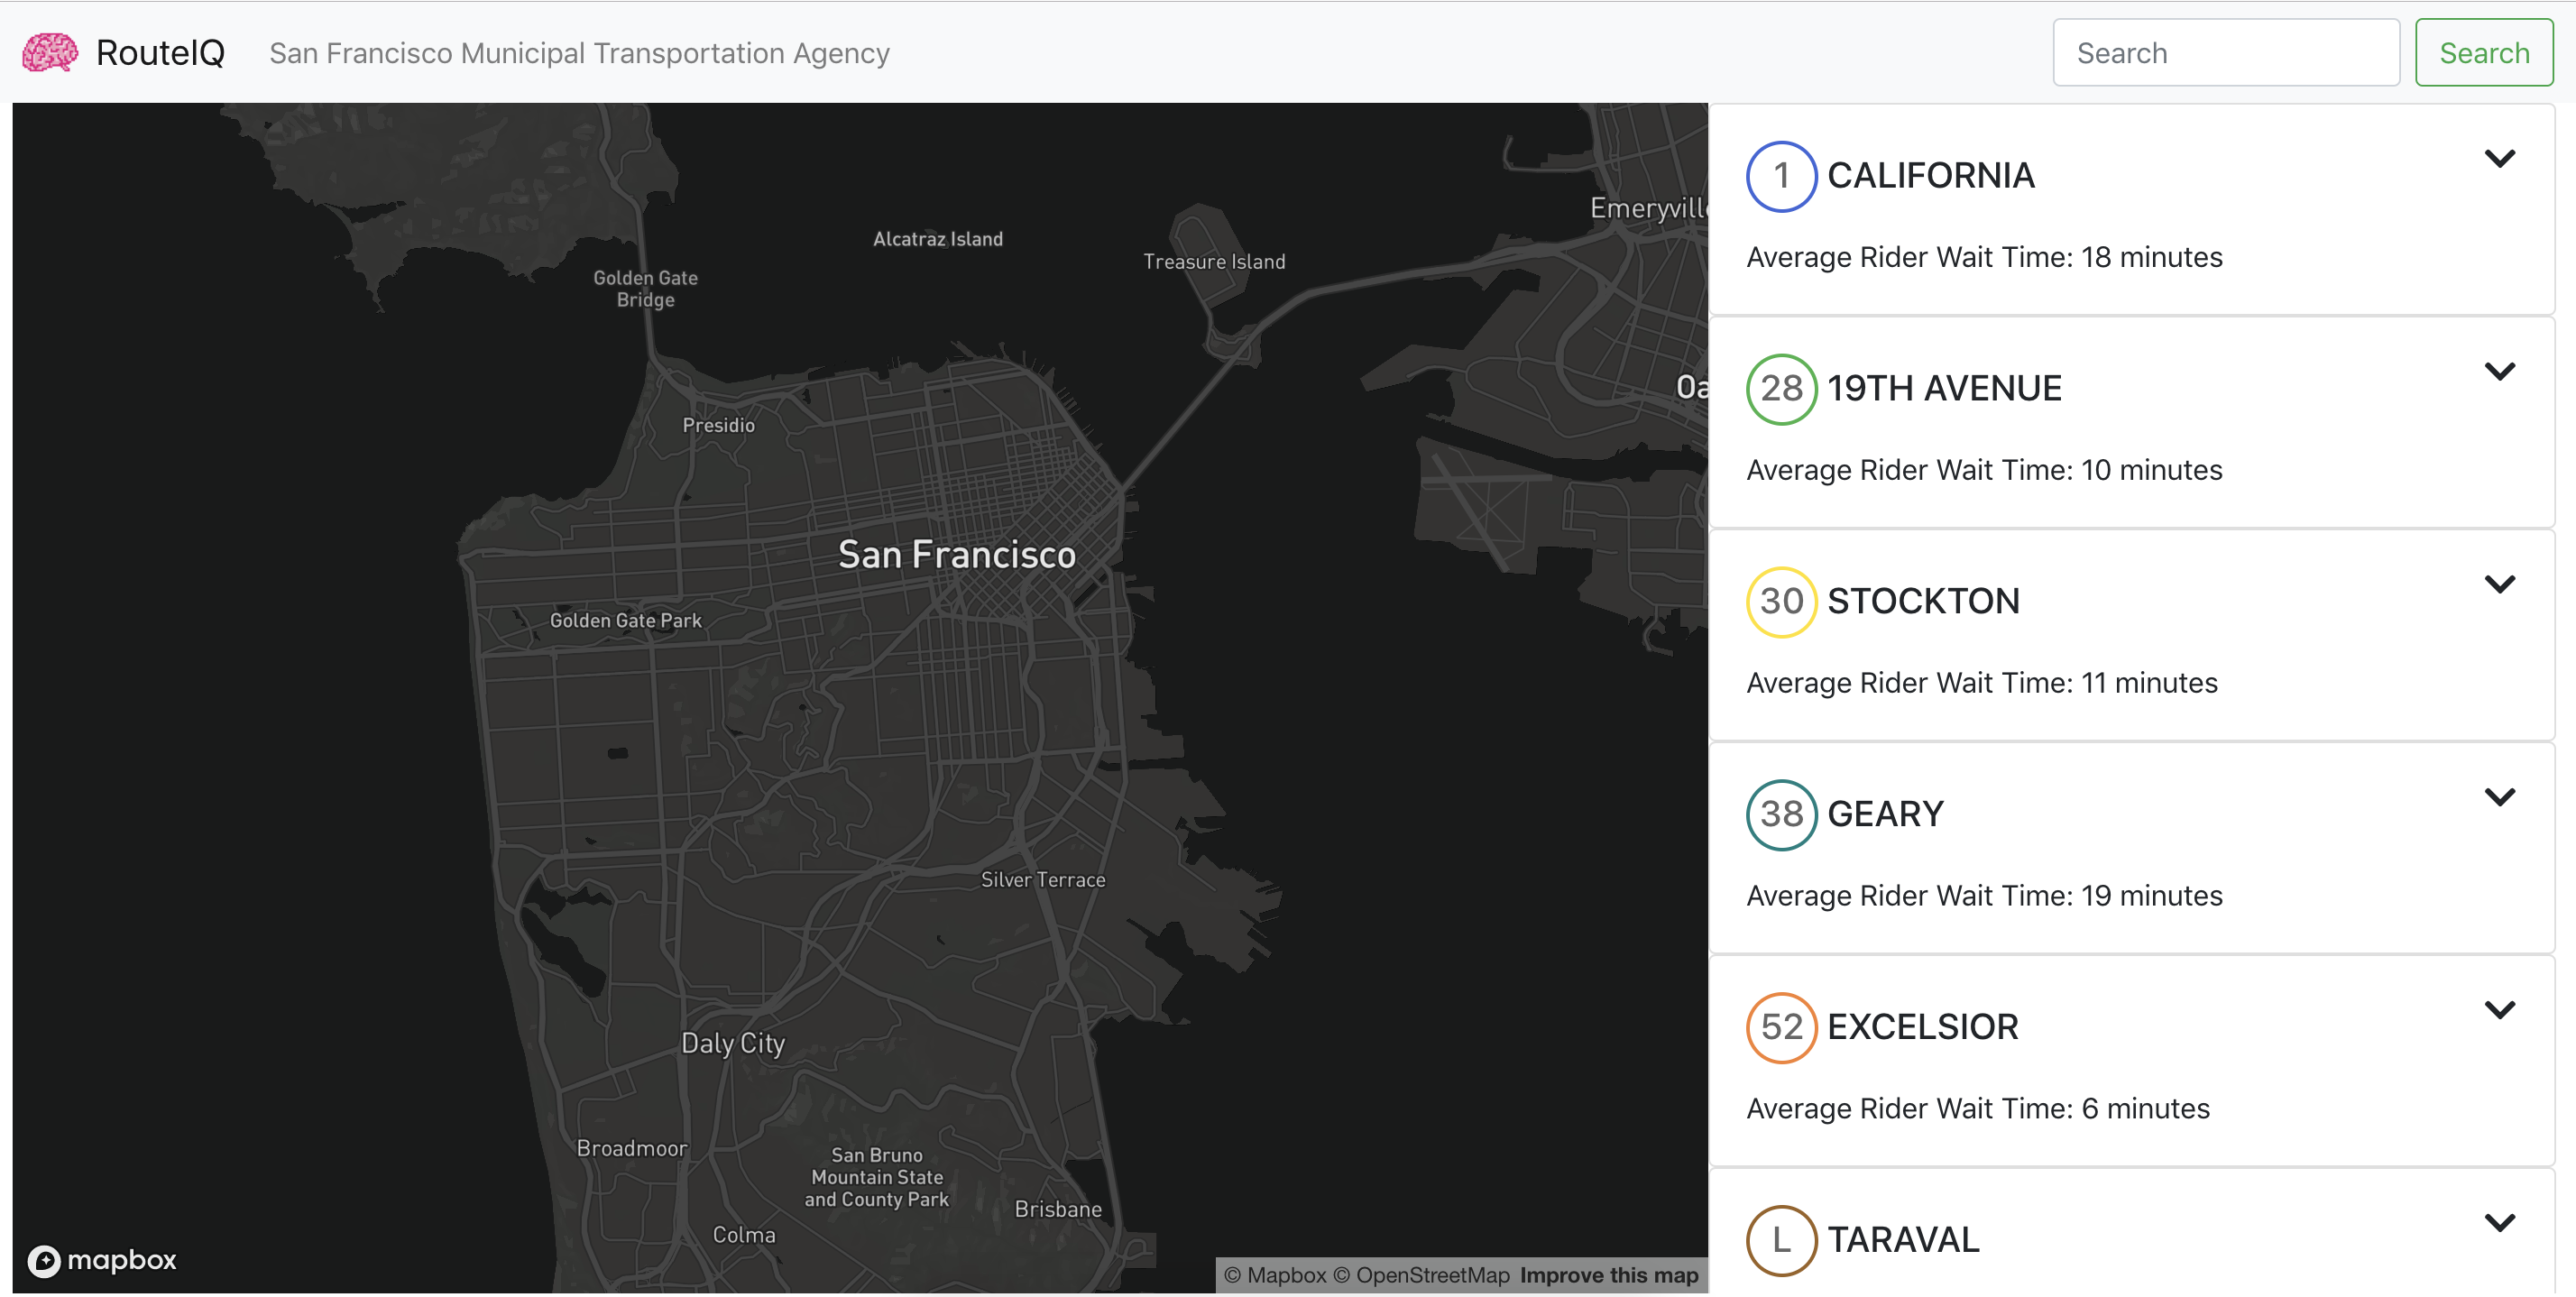
The RouteIQ dashboard at a high level.
-
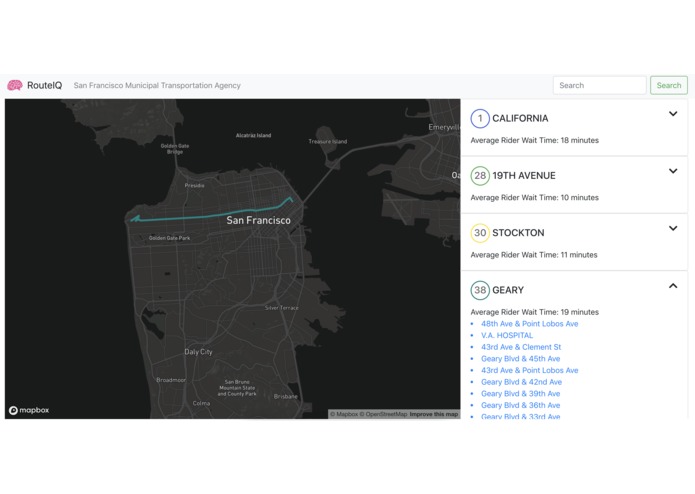
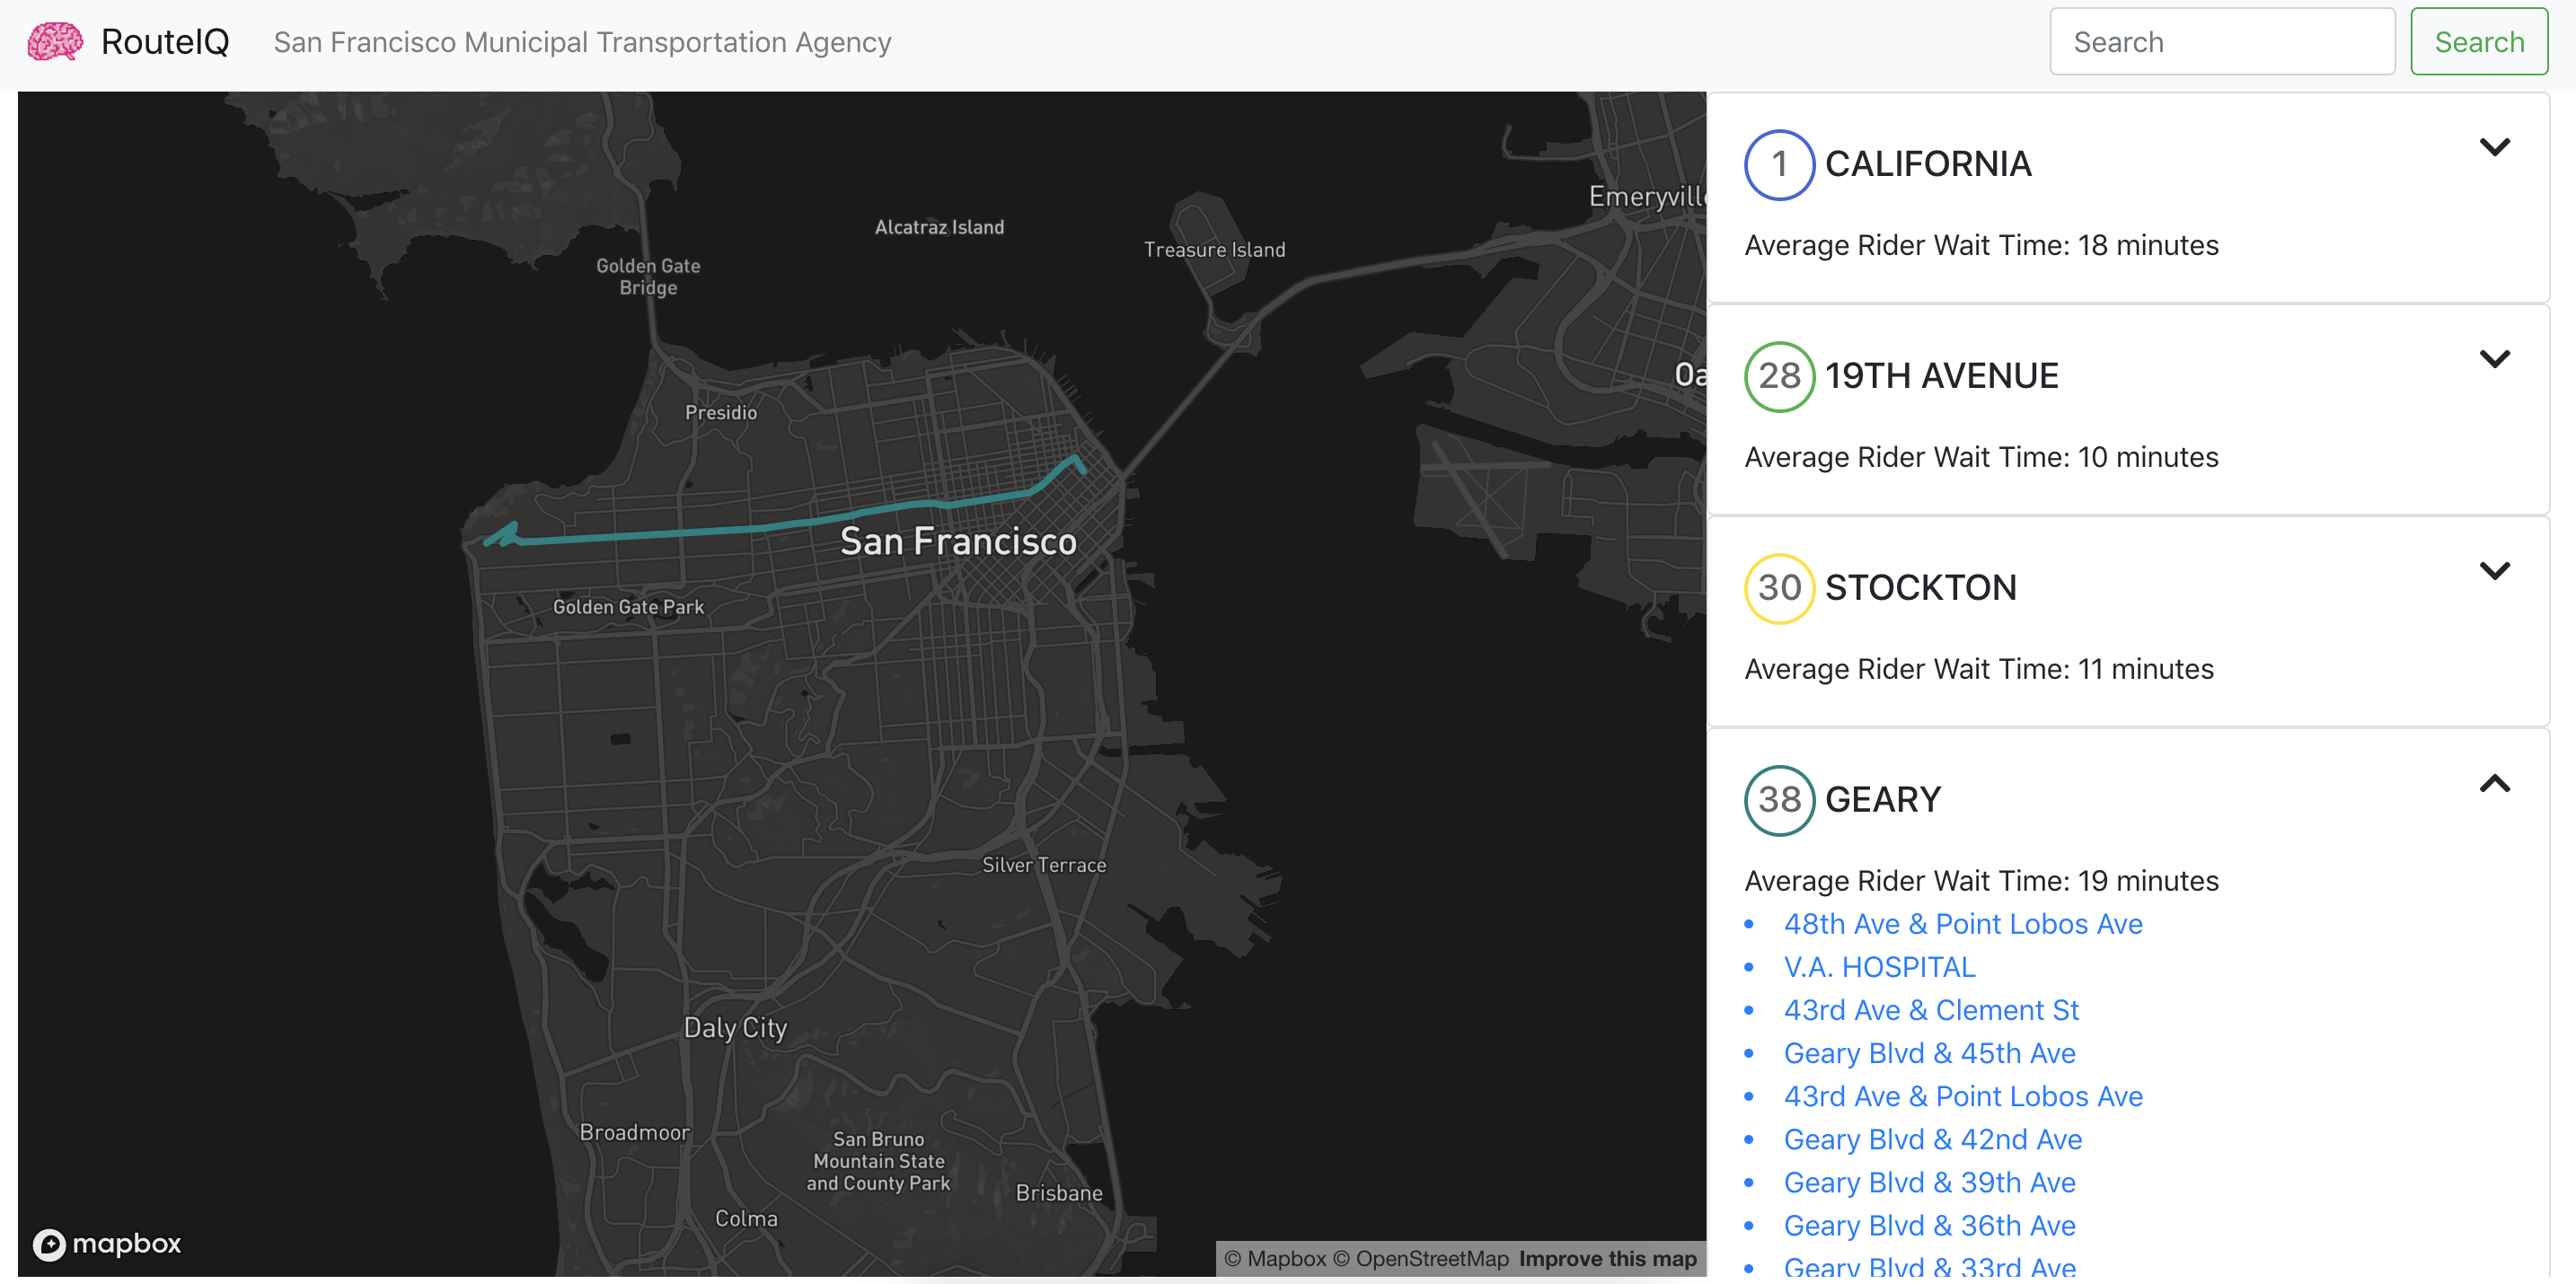
The RouteIQ dashboard, focusing on a single route.
Inspiration
Urban transit planners make decisions that impact huge populations, and the data they need to make those decisions is hard to find. Municipal transit agencies currently measure utilization by counting ridership manually, as well as surveying riders on the street.
These two traditional methods are labor-intensive and error prone. They don't accurately represent the 24/7 nature of urban transportation. They only measure when people are on the vehicle, but not the important journey they took to get there.
What it does
We built a computer vision solution that can be combined with an IoT camera to count the amount of people waiting at a bus stop, and how long each of them have been waiting. This data will be published to a dashboard that we created for consumption by transit planners.
How we built it
We used a MERN stack (Mongo, Express, React, Node) to build the dashboard.
For the computer vision tracking of riders we initially used YOLOv3 but this doesn't have the capability to ID and track a particular user which is necessary for computing overall wait times. To solve this we used a Multiple Object Tracking repository which generated features for person reidentification using the cosine similarity of CNN features. To generate these features we needed to provide proposal regions for humans - which we generated and converted to be compatible with the other repository. The full solution allows us to ID a person and track them even in the event of prolonged occlusion.
Accomplishments that I'm proud of
We're proud of how much we finished! This was our first hackathon together.
What I learned
We both learned a lot about CNNs and computer vision.
What's next for RouteIQ
We didn't get to start hardware component of this, but we're looking forward to it! That will tie together our dashboard and our data.

Log in or sign up for Devpost to join the conversation.