-
-
-
-
Web Interface
Inspiration
Food-access organizations often have to make difficult weekly decisions with incomplete, fragmented, and sometimes outdated information: Where will demand increase? Which communities are already being served by another program? How much food should each location receive? What is the most practical route for limited vehicles?
Route Desk was inspired by the idea that AI should not simply produce another prediction or dashboard. It should help coordinators turn messy public information and organizational delivery history into an actionable weekly plan, while keeping people in control of consequential decisions.
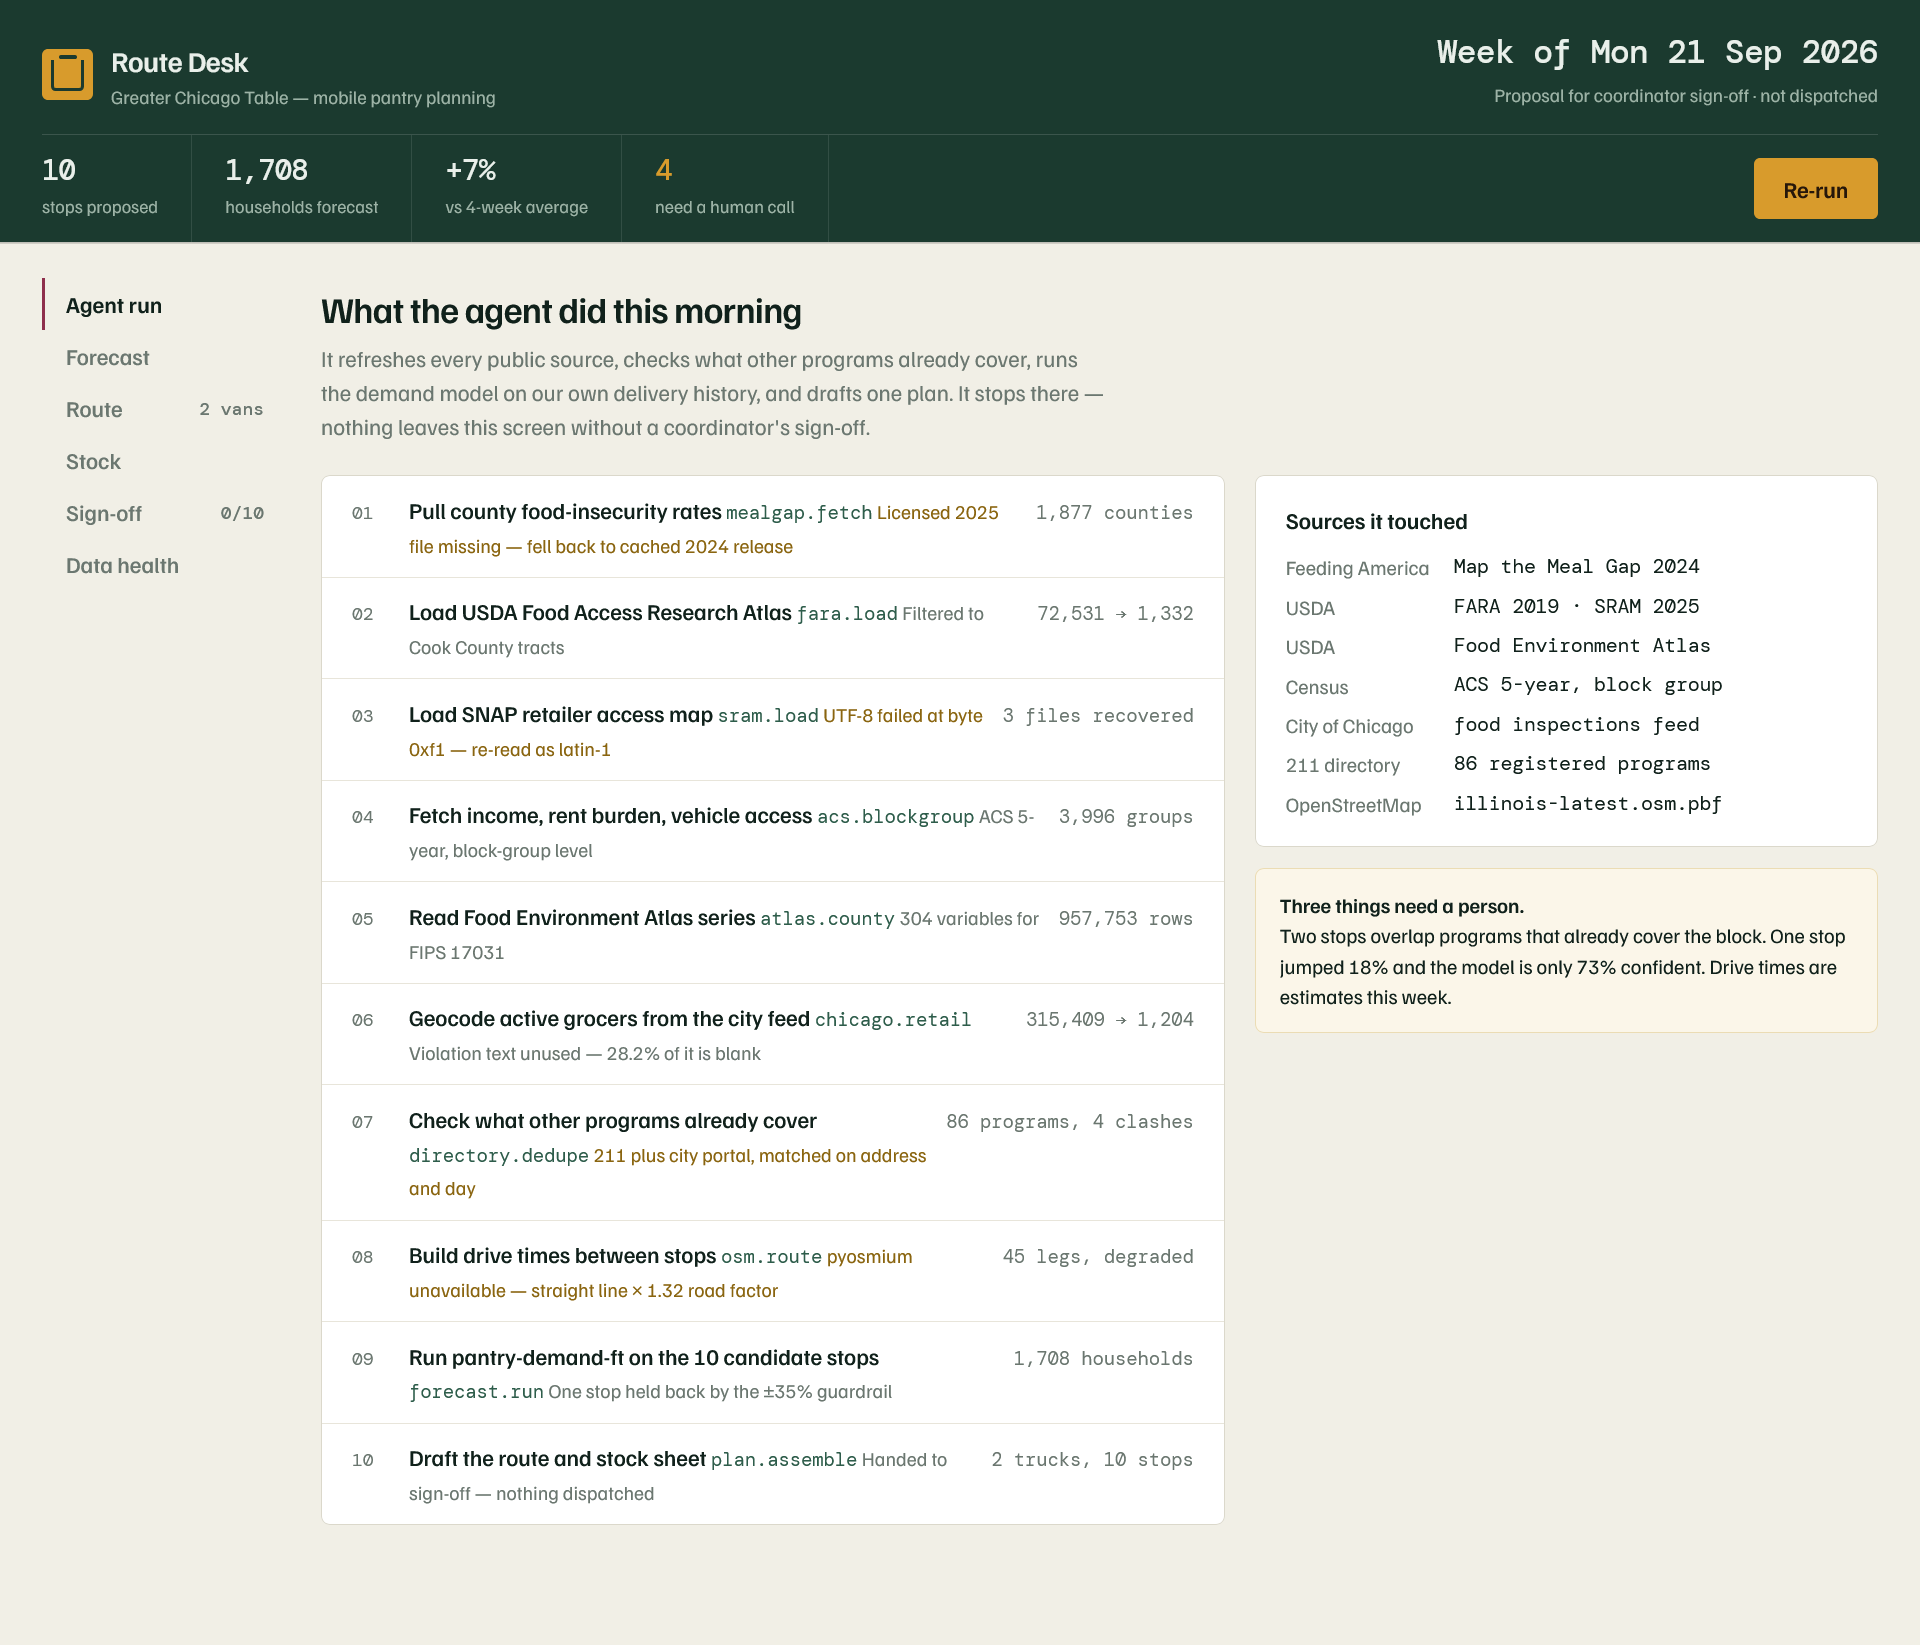
The system brings together indicators such as USDA food-access data, Census demographics, Food Environment Atlas data, Chicago food-inspection information, the 211 program directory, and OpenStreetMap alongside the organization's own delivery history.
The central design principle is simple: the AI can prepare the plan, but a human decides whether it should happen.
What it does
Route Desk is an AI-assisted weekly planning desk for a Greater Chicago mobile pantry operation.
Each week, the system:
Refreshes public data sources covering food insecurity, food access, income, rent burden, vehicle access, retailers, and existing community programs. Checks for service duplication, identifying situations where another pantry or food program may already be serving the same community. Forecasts household demand at candidate pantry stops using the organization's historical delivery data and public indicators. Identifies unusual changes and sends uncertain or high-impact decisions to a human rather than automatically accepting them. Builds a two-van route plan covering ten proposed stops. Calculates stock requirements, including produce, protein, shelf-stable food, dairy, and diapers. Checks truck payload capacity before the plan is finalized. Presents every stop for coordinator sign-off before anything is dispatched.
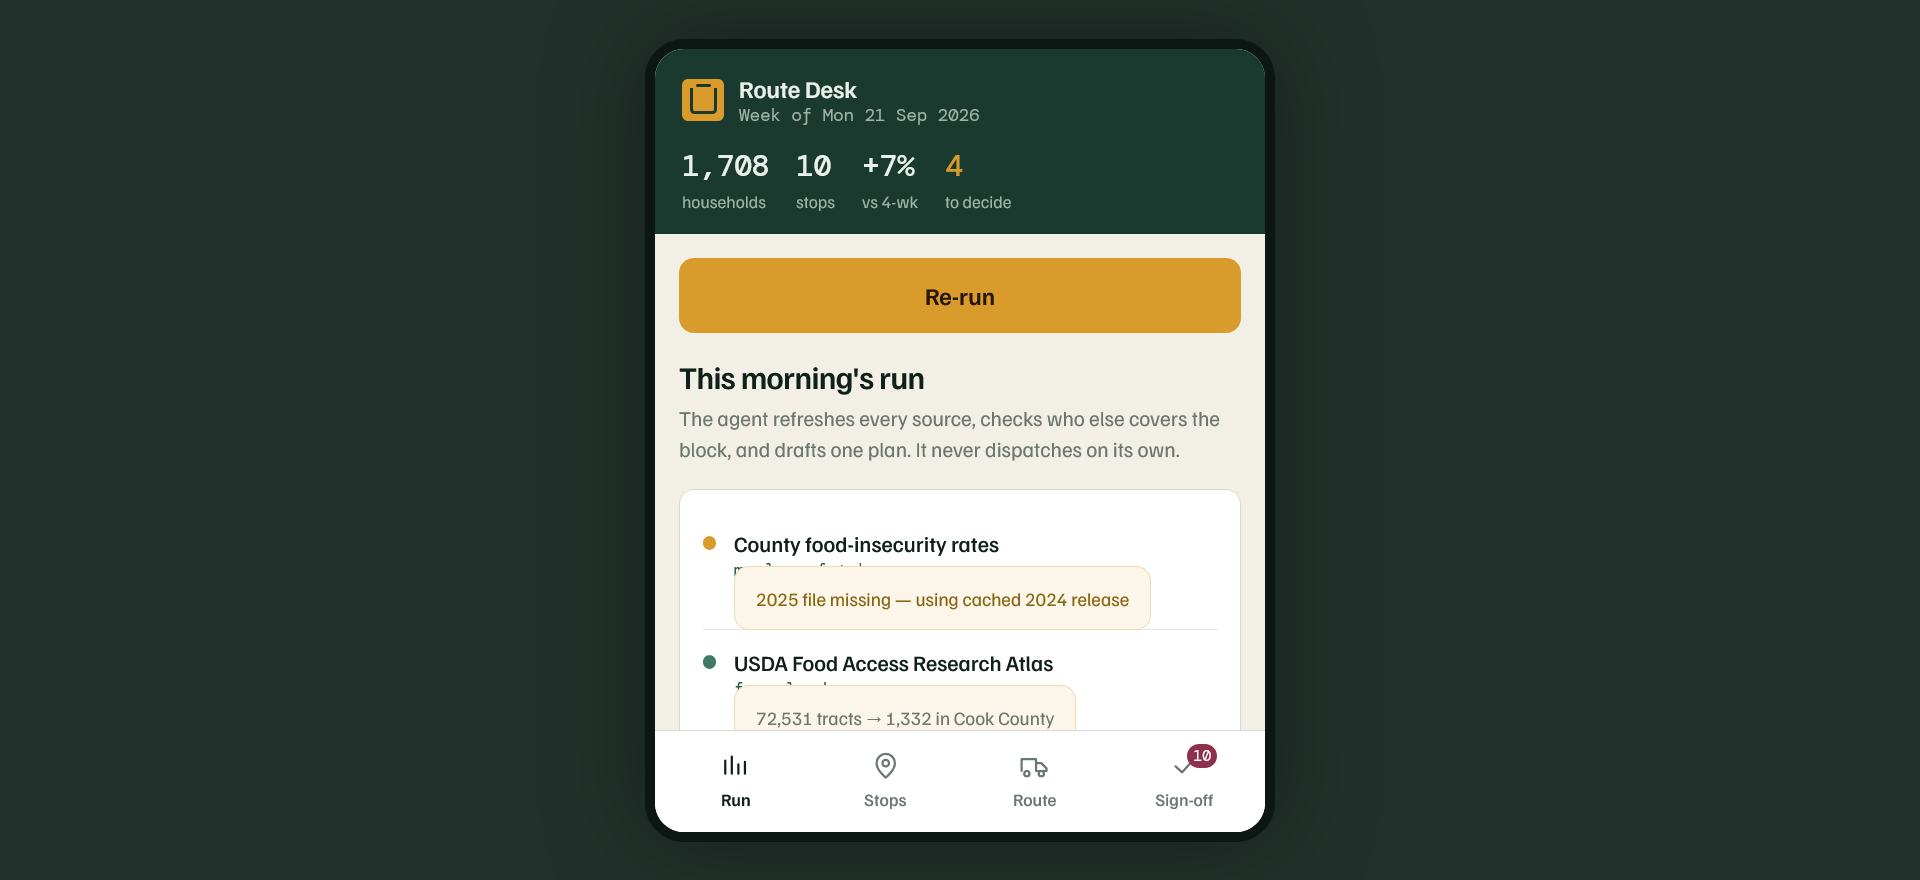
The prototype forecasts 1,708 households across 10 proposed stops and organizes the work across two trucks.
Importantly, Route Desk is designed around a human-in-the-loop safety mechanism. For example, forecasts that move more than 35% week-over-week are held for review rather than automatically becoming operational decisions.
How we built it
We built Route Desk as a focused operational interface rather than a generic chatbot.
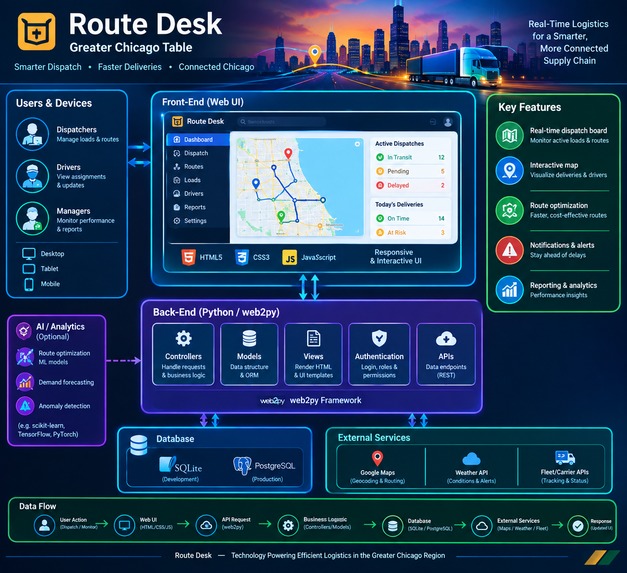
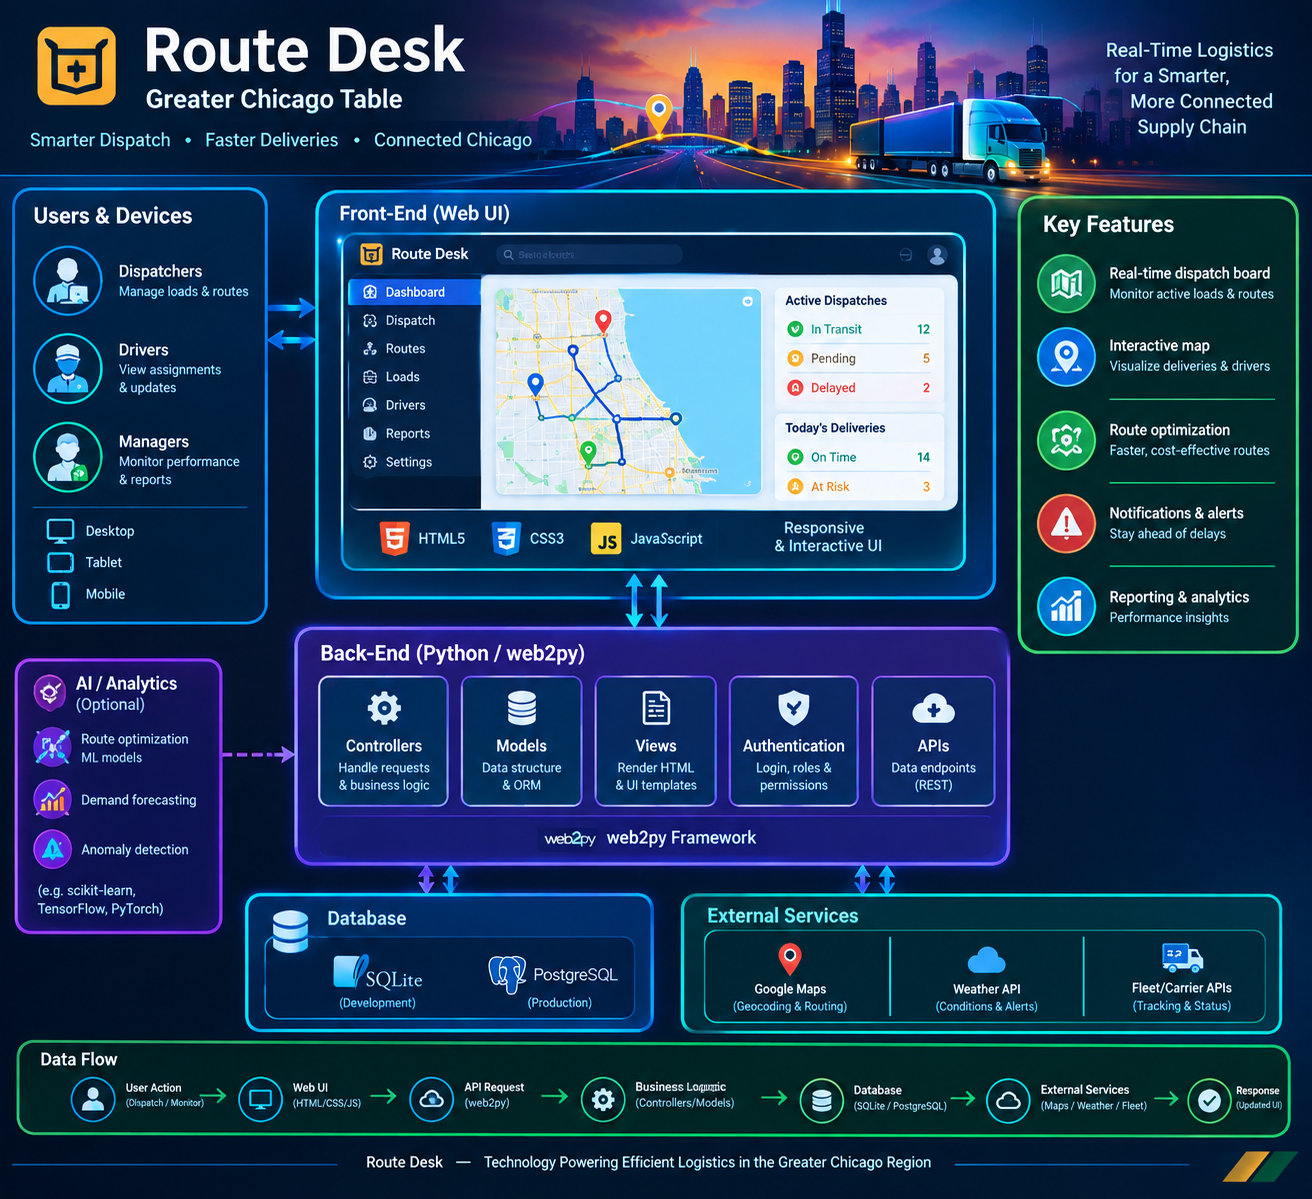
The application is organized into six connected work areas:
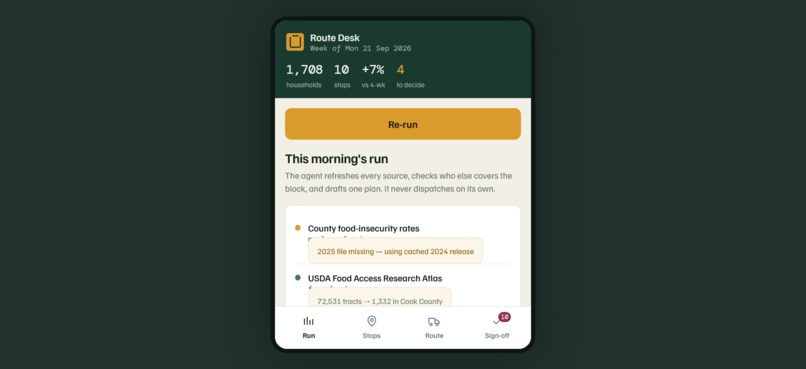
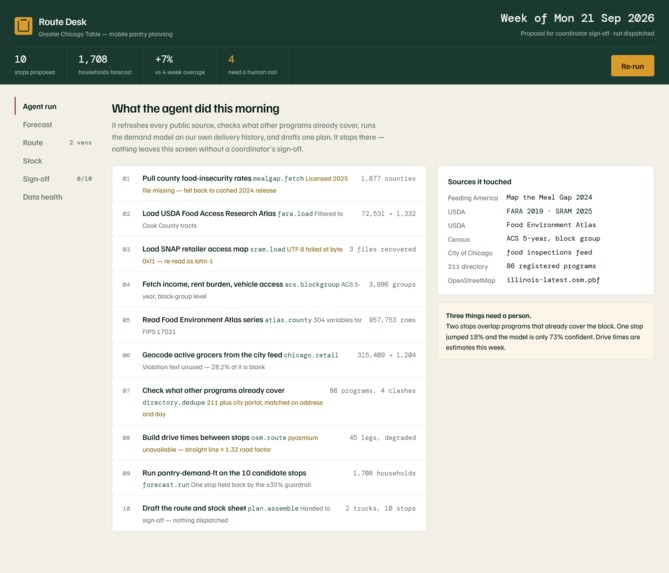
Agent Run — shows what the system did and which sources it used. Forecast — displays predicted household demand and the reasoning behind changes. Route — visualizes the proposed two-van route. Stock — translates demand forecasts into food and supply requirements. Sign-off — gives coordinators explicit Approve, Adjust, or Drop controls. Data Health — makes data-quality problems visible instead of hiding them.
The forecasting component is represented as pantry-demand-ft · v3, using a fine-tuned Chronos-Bolt small model with 48M parameters. It is described as being fine-tuned on 18,412 stop-weeks across 34 sites, with history from June 2023 through August 2026.
The prototype also incorporates multiple public data sources, including Feeding America, USDA FARA, USDA Food Environment Atlas, Census ACS, Chicago's food-inspection feed, the 211 directory, and OpenStreetMap.
For operational planning, predicted households are converted into stock requirements using a standard 15.4 lb per household assumption and checked against a 14,000 lb truck payload.
Most importantly, we made the system transparent. Every major processing step is exposed in the interface, from loading FARA and ACS data through deduplication, routing, forecasting, and final plan assembly.
Challenges we ran into
One of the biggest challenges was real-world data quality.
The prototype encountered several problems rather than assuming every data source would be clean:
The licensed 2025 Map the Meal Gap file was unavailable, requiring a fallback to the cached 2024 release. Several USDA SRAM files produced UTF-8 decoding errors and required a Latin-1 fallback. The Illinois OpenStreetMap extract could not be opened because pyosmium was unavailable. Some source fields contained substantial missing data. The Chicago food-inspection feed contained a significant amount of blank violation text. Existing food programs had to be matched by address and day to identify potential service overlap.
Routing presented another challenge. Instead of pretending that precise road-network routing was available, Route Desk explicitly degraded to straight-line distance multiplied by a 1.32 road factor, with an expected uncertainty of approximately ±8 minutes per leg.
There was also a harder product challenge: knowing when the AI should not make the decision.
For example, Columbus Park has an 18% increase with only 73% model confidence, while Farragut High School appears to overlap with another pantry. Rather than silently choosing an answer, Route Desk escalates these situations to the coordinator.
Accomplishments that we're proud of
We are proud that Route Desk goes beyond a prediction model and demonstrates an end-to-end operational workflow.
The prototype connects:
Data → Analysis → Forecast → Route → Inventory → Human Decision → Dispatch
That means the model's output is connected to an actual operational consequence.
We are particularly proud of the forecasting improvement. On the last 12 weeks, the fine-tuned model is represented as averaging 9.4 households of error, with a 7.8% mean error and 91% of weeks inside the predicted range, compared with 21.6 households of error from the previous same-week-last-year approach.
We are also proud of the transparency of the system. Data problems are surfaced directly through the Data Health interface instead of being hidden behind an apparently confident AI output.
Finally, we built explicit human controls into the workflow. Every proposed stop receives an Approve, Adjust, or Drop decision, and the plan cannot be sent until all ten stops have been reviewed.
What we learned
We learned that the most useful AI systems for community operations are not necessarily the ones that automate the most.
Trust comes from showing the work.
A coordinator needs to know:
where a prediction came from, what changed, how confident the model is, what other programs are doing, whether the underlying data is healthy, what assumptions were made, and when the system is uncertain.
We also learned that data quality is part of the product, not merely an engineering problem. Route Desk deliberately reports degraded sources, fallbacks, missing data, and routing limitations so that users can understand the reliability of the resulting plan.
Another important lesson was that forecasting accuracy alone is insufficient. A model can make a statistically good prediction while still producing a bad operational decision. That is why Route Desk combines forecasting with contextual signals, duplication detection, vehicle capacity, route constraints, and human review.
Most importantly, we learned that AI works best here as a decision-support teammate rather than an autonomous decision-maker.
What's next for Route Desk — Greater Chicago Table
The next phase is to move Route Desk from a strong operational prototype toward a more complete production planning system.
- Improve routing
The current prototype uses degraded routing because the Illinois OSM extract could not be processed. The next version should restore full road-network routing, incorporate real drive times, traffic-aware estimates, vehicle constraints, and site operating hours.
- Improve data freshness
We would replace cached or degraded datasets with current releases wherever licensing and availability permit, while maintaining clear provenance and timestamps for every data source.
- Strengthen the forecasting system
The next iteration could incorporate additional temporal and operational signals such as weather, holidays, school calendars, historical turnout, inventory shortages, special events, and actual route completion data.
- Close the feedback loop
Coordinator decisions should become training and evaluation signals. If a coordinator repeatedly adjusts a model recommendation, the system should learn from those corrections rather than simply recording them.
- Add real operational integrations
The prototype currently stops at coordinator approval. The next version could connect approved plans directly to:
warehouse picking sheets, inventory systems, driver manifests, volunteer schedules, SMS/email notifications, and route-navigation systems.
- Expand beyond Greater Chicago
Once validated in Chicago, the architecture could support other cities and food-access organizations while adapting to each organization's local delivery history, public datasets, vehicle fleet, service area, and operating rules.
The long-term vision for Route Desk — Greater Chicago Table is not to replace the people who understand their communities. It is to give them a system that does the tedious analytical work, makes uncertainty visible, identifies important decisions, and leaves the final call with the people responsible for the community.

Log in or sign up for Devpost to join the conversation.