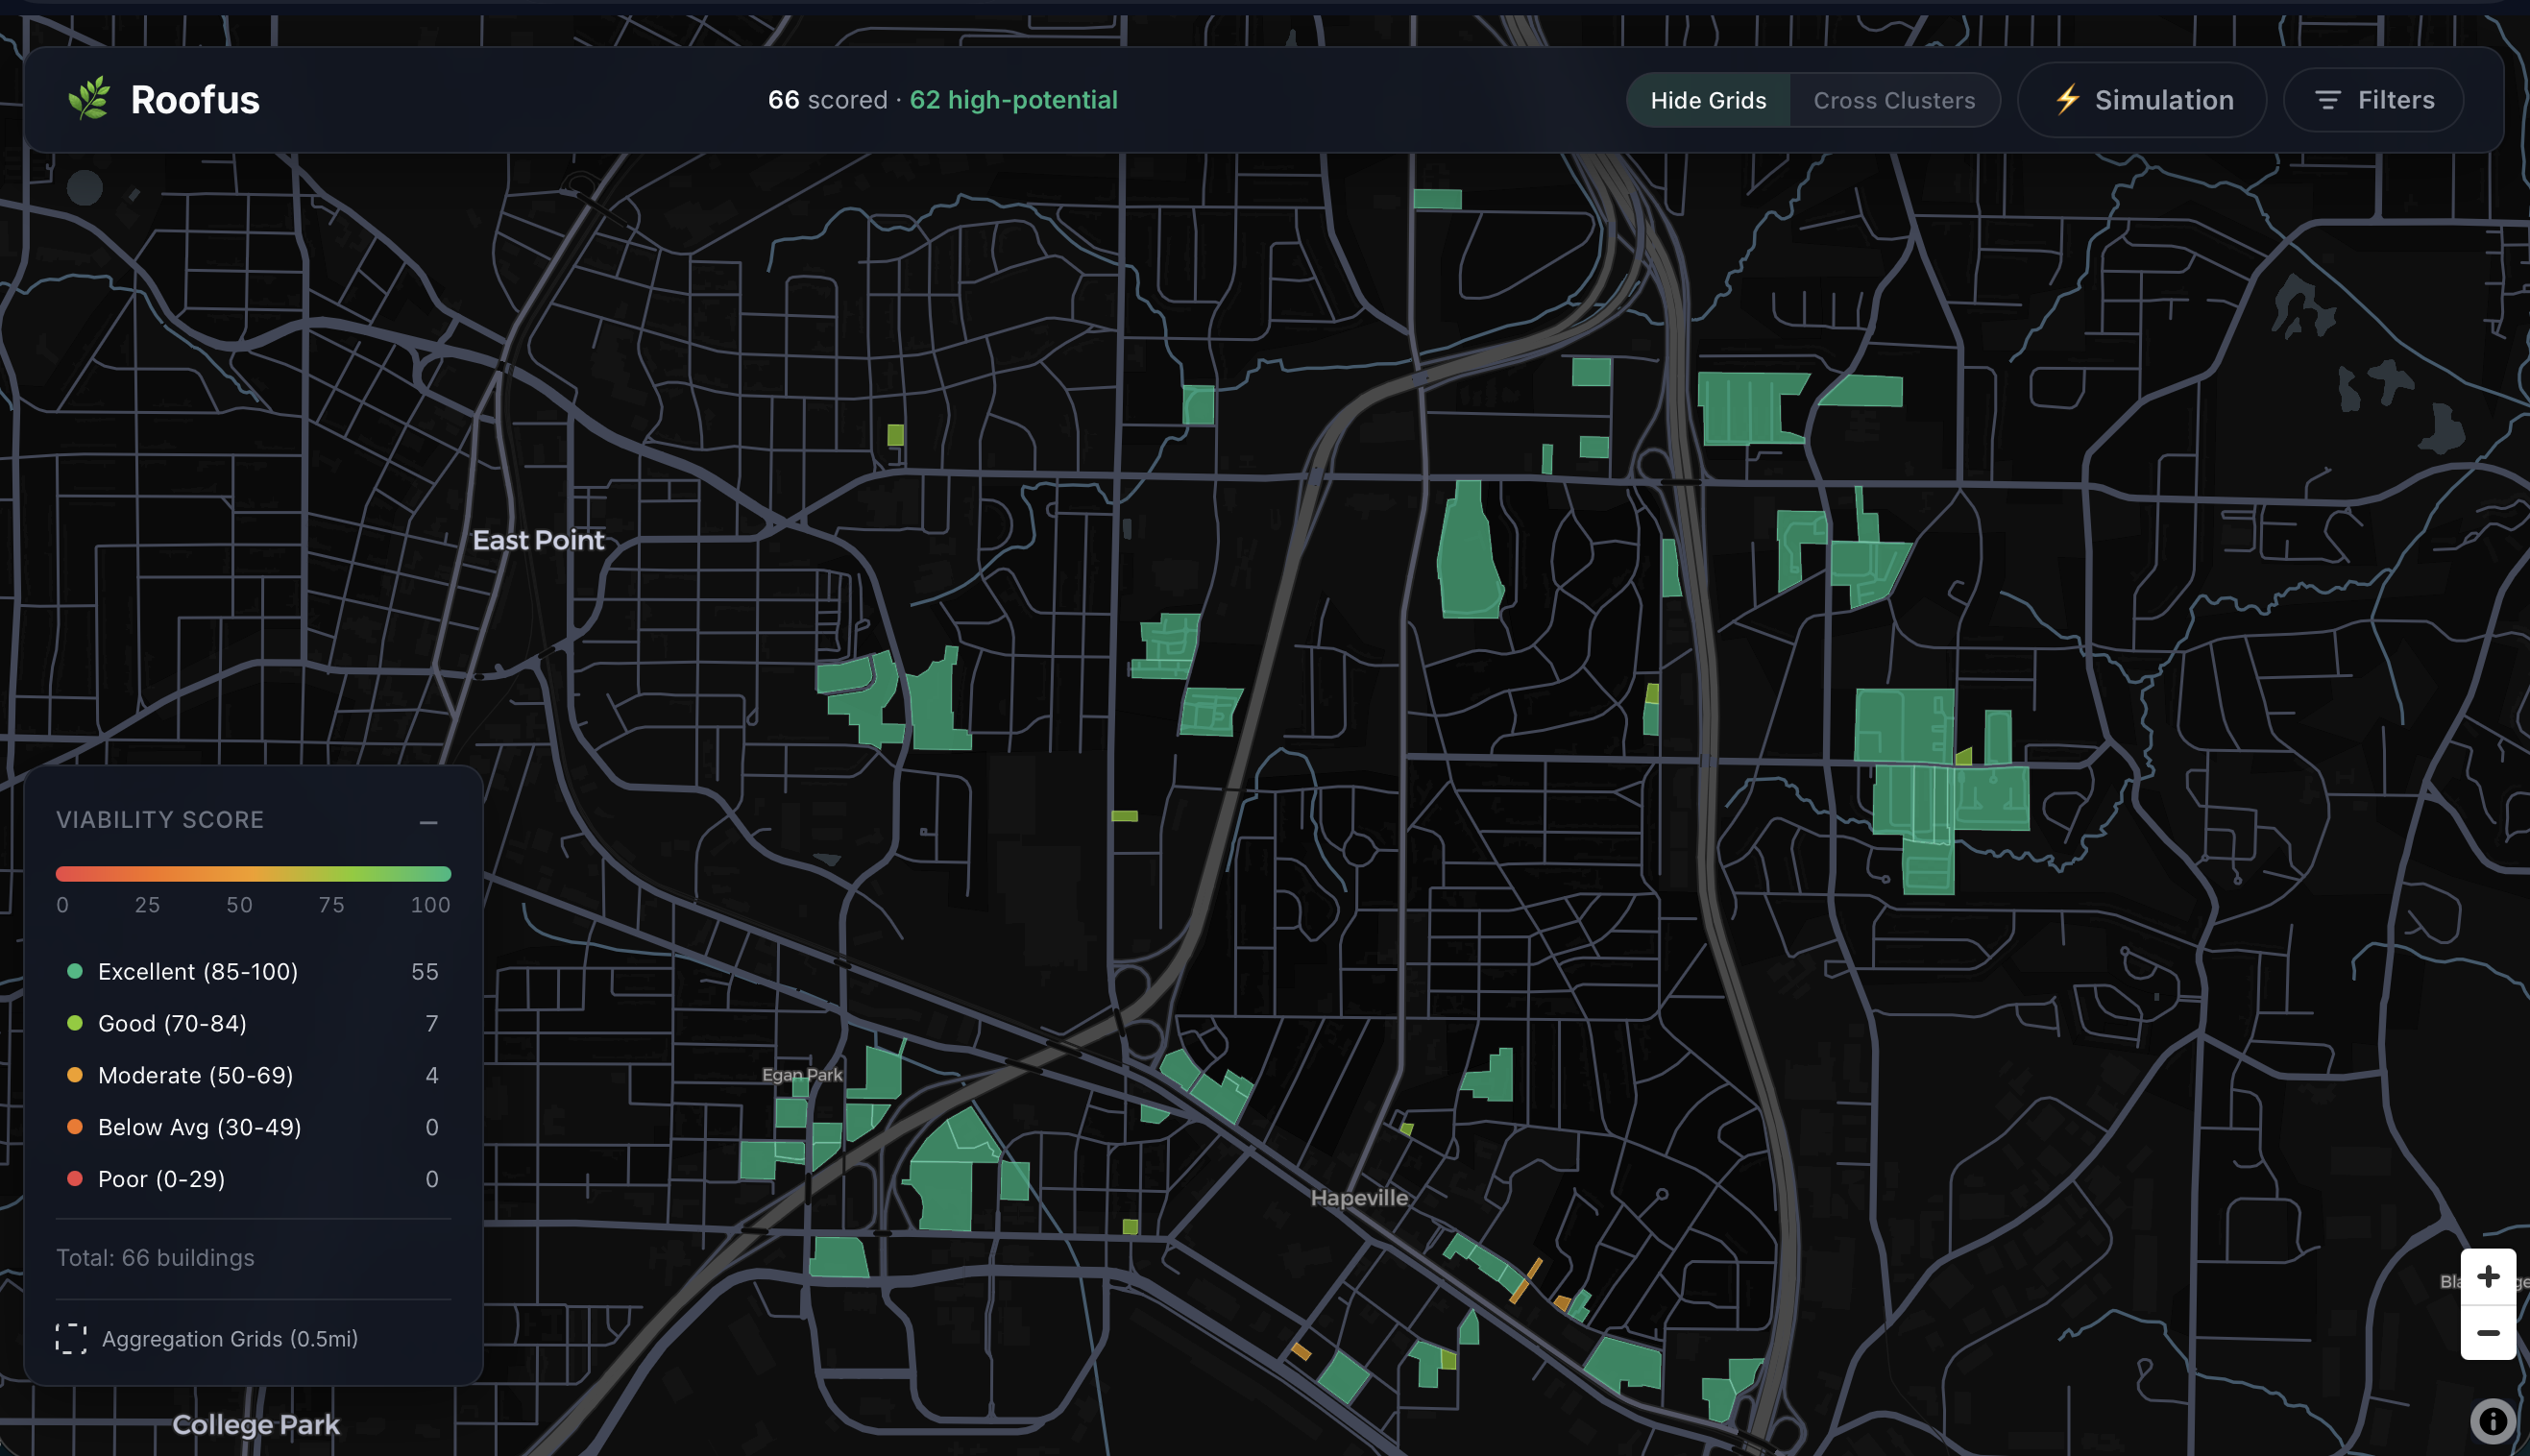
Roofus scores every commercial/multifamily rooftop in Hapeville for its potential as a rooftop greenhouse + grid-services asset, and shows the financial case to building owners.
- Maps 66 real Hapeville buildings with a composite suitability score (structural readiness, roof area, solar, land use, food-desert need, and aggregation potential).
- Models three honest, clearly-separated revenue streams for an owner: Georgia Power CL-1 (Curtailable Load — get paid to use less on peak), DCO-1 (Distributed Capacity — solar + battery to supply more), and passive green-roof energy savings.
- Aggregates buildings into 0.5-mile clusters and shows, live, how much curtailable load a neighborhood pools toward Georgia Power's real 200 kW CL-1 threshold — turning scattered small buildings into one grid-relevant resource.
- Simulates a coordinated greenhouse-energy network on a real hot summer day, showing how battery dispatch + greenhouse demand response can cut the evening grid peak by ~12% (~200 kW) for our biggest cluster.
🔧 How we built it
Real data, no mock-ups. The pipeline (build_real_data.py, stdlib-only Python) pulls live public data with no API keys:
- Fulton County Tax Assessor (ArcGIS) → parcels, owners, units, land use, and lot acreage (we filter to LivUnits >= 5 multifamily land-use classes).
- Open-Meteo archive API → real annual solar irradiance (GHI) for Hapeville.
- USDA Food Access Research Atlas 2019 → ray-cast each building centroid into census tracts to flag food deserts and low-income areas.
From that we derive roof area, sheddable load (smart-thermostat AC cycling + greenhouse lighting/pumps), rooftop PV capacity, and a weighted suitability score, then run a spatial clustering pass to tile buildings into neighborhood blocks and total their curtailable load against the real CL-1/DCO-1 tariff thresholds.
The grid simulation (simulate_network.py + a GES physics run for greenhouse cooling) compares an uncoordinated day against a coordinated one — battery storing midday solar, greenhouse deferring flexible load into the evening peak — with every assumption labeled "Real," "Real-derived," or "Assumption" so we never overstate it.
The app: a FastAPI backend (routers for buildings, grids, revenue, subsidies, and the simulation; service layer for aggregation and revenue math) serving GeoJSON to a Next.js + TypeScript frontend with an interactive map, score gauges, cluster aggregation meters, and per-building revenue tabs.
🧗 Challenges we ran into
The biggest one was intellectual honesty under deadline pressure. We dug into the actual CL-1 tariff PDF and found it's written per customer — there's no language about aggregating multiple owners to clear 200 kW, and Georgia isn't in an organized wholesale market where FERC Order 2222 would force it. So we split our pitch into two honest paths: anchor sites that clear the threshold alone (solid under the tariff today) vs. an aggregated fleet (the growth vision that depends on a program GA Power would have to allow).
We also caught and killed a bad number: an early energy-savings default implied owners saved ~25% of their whole electric bill from a green roof. We ran Georgia Power's own commercial bill calculator on a real 192-unit complex ($7,025/month) and grounded the passive savings at a defensible ~3%.
📚 What we learned
- Demand is the product, not energy. The grid's problem is the peak, not total kWh. A greenhouse that adds load can still help the grid if it runs off-peak and sheds on 30 minutes' notice.
- Apartment owners are already on commercial demand rates (PLM/PLS) — which is a strength, because demand charges make peak reduction genuinely valuable to them.
- Sourcing everything changes the project. Labeling each input "verified" vs. "our analysis" forced a sharper, more defensible pitch than hand-waving ever would have.
- A surprising amount of high-quality civic data (parcels, food access, solar) is public and free if you're willing to wrangle ArcGIS query endpoints.
🚀 What's next
- Confirm with Georgia Power whether small-site aggregation is possible under an existing program.
- Replace the literature-based greenhouse load with a real building-energy model (EnergyPlus / Modelica Greenhouses Library).
- Extend from one representative summer day to a full annual simulation, and from Hapeville to a replicable template for any food-desert neighborhood near a strained grid.
Want me to tailor this for a specific platform (Devpost has those exact headers), cut it down to a 60-second elevator pitch, or punch up the inspiration story with more of the personal angle? I kept it faithful to the repo, but I can adjust tone or length however you need.

Log in or sign up for Devpost to join the conversation.