-
-
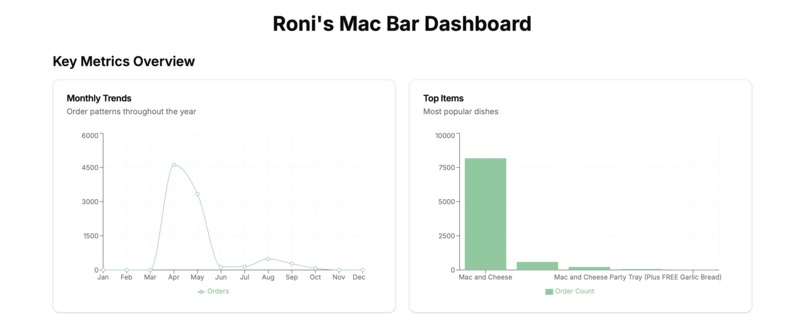
Screenshot of home page
-
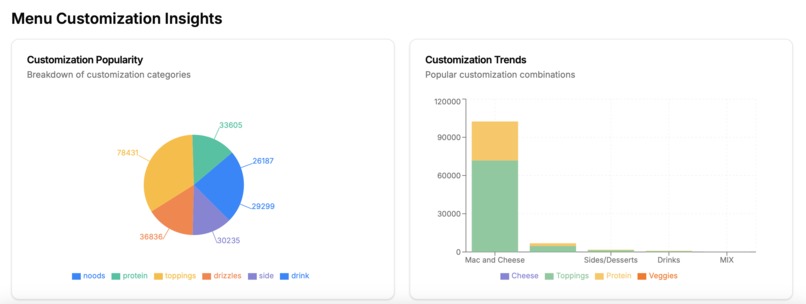
Charts
-
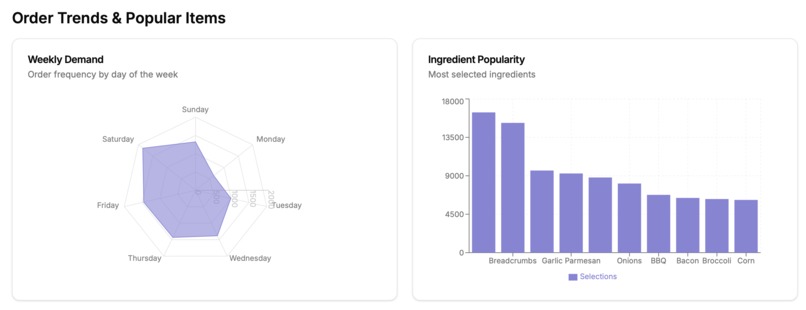
More Charts
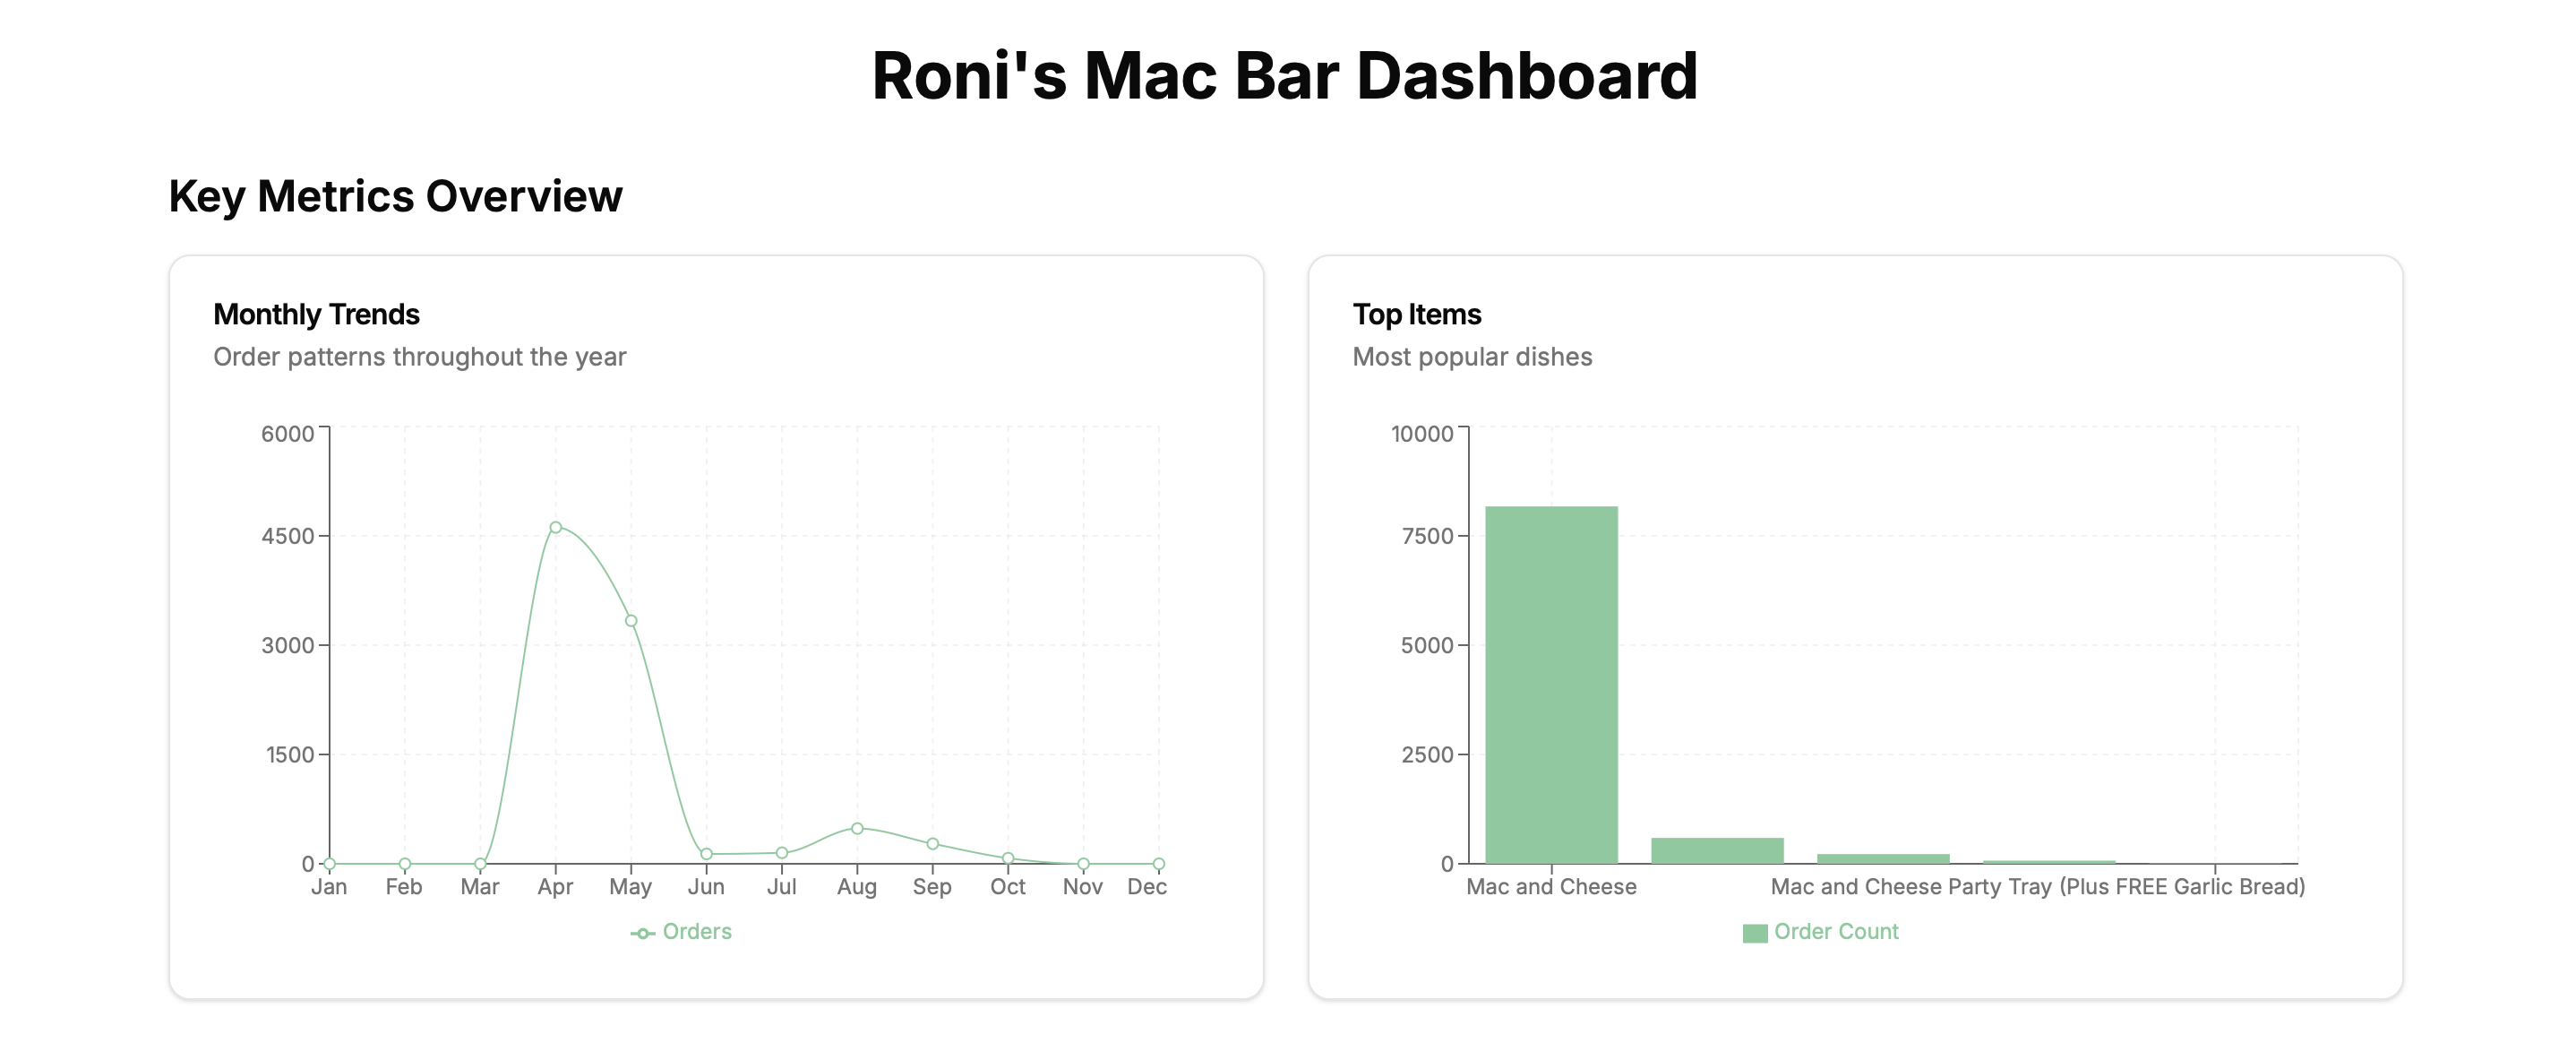
Roni's Mac Bar Dashboard
Overview
This dashboard is designed to provide valuable insights into customer ordering patterns, popular items, ingredient preferences, and customization trends. It's a powerful tool to help you make data-driven decisions to enhance your menu offerings, optimize inventory management, and tailor marketing strategies.
Key Features
Monthly Trends Line Chart Depicts order patterns across different months.
Top Items Bar Chart Shows the most frequently ordered dishes.
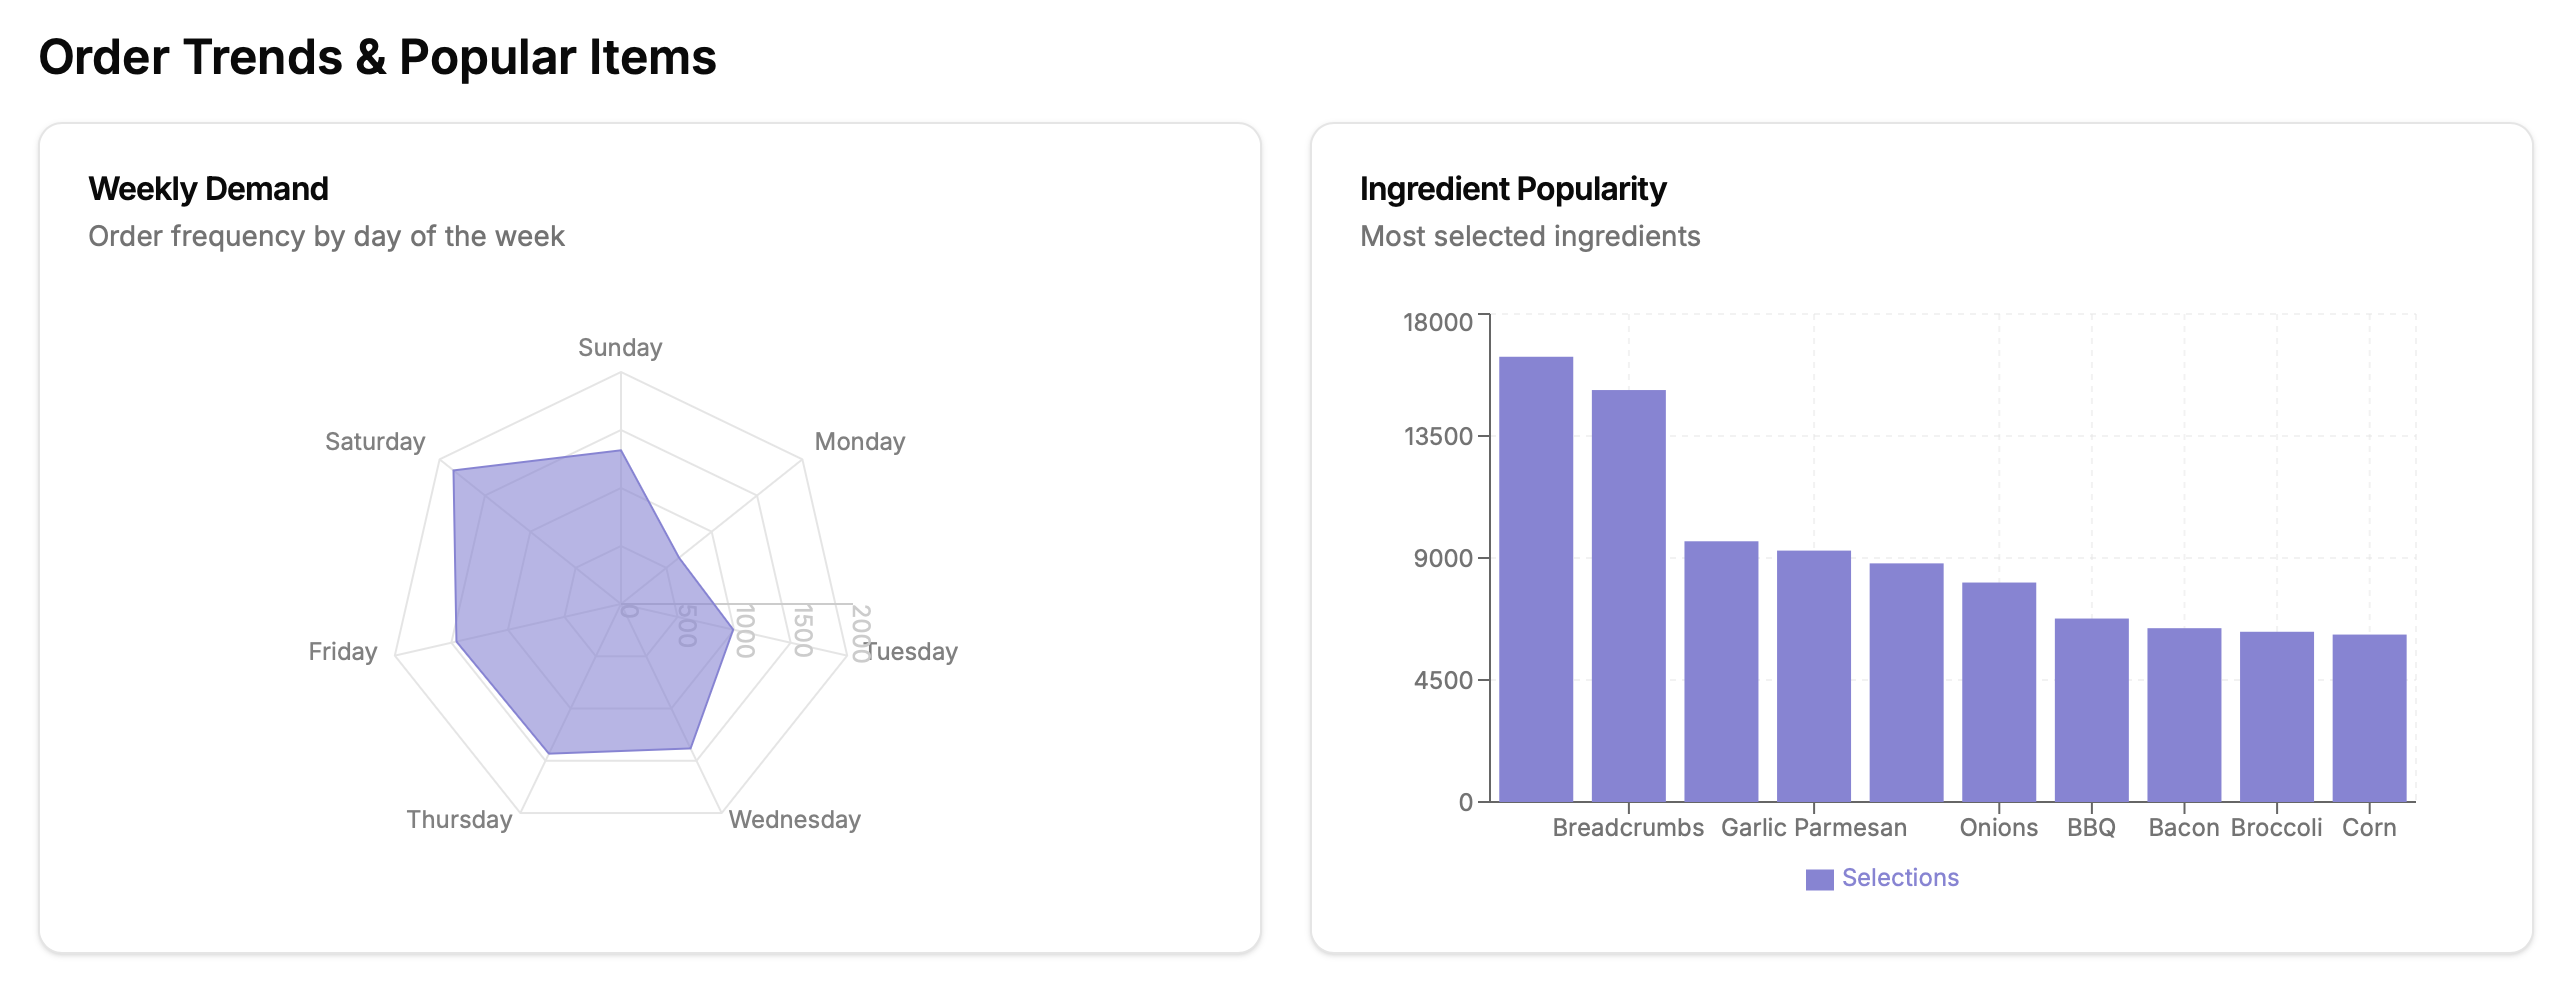
Weekly Demand Radar Chart Illustrates order distribution throughout the week.
Ingredient Popularity Bar Chart Displays the top 10 most selected ingredients across all orders.
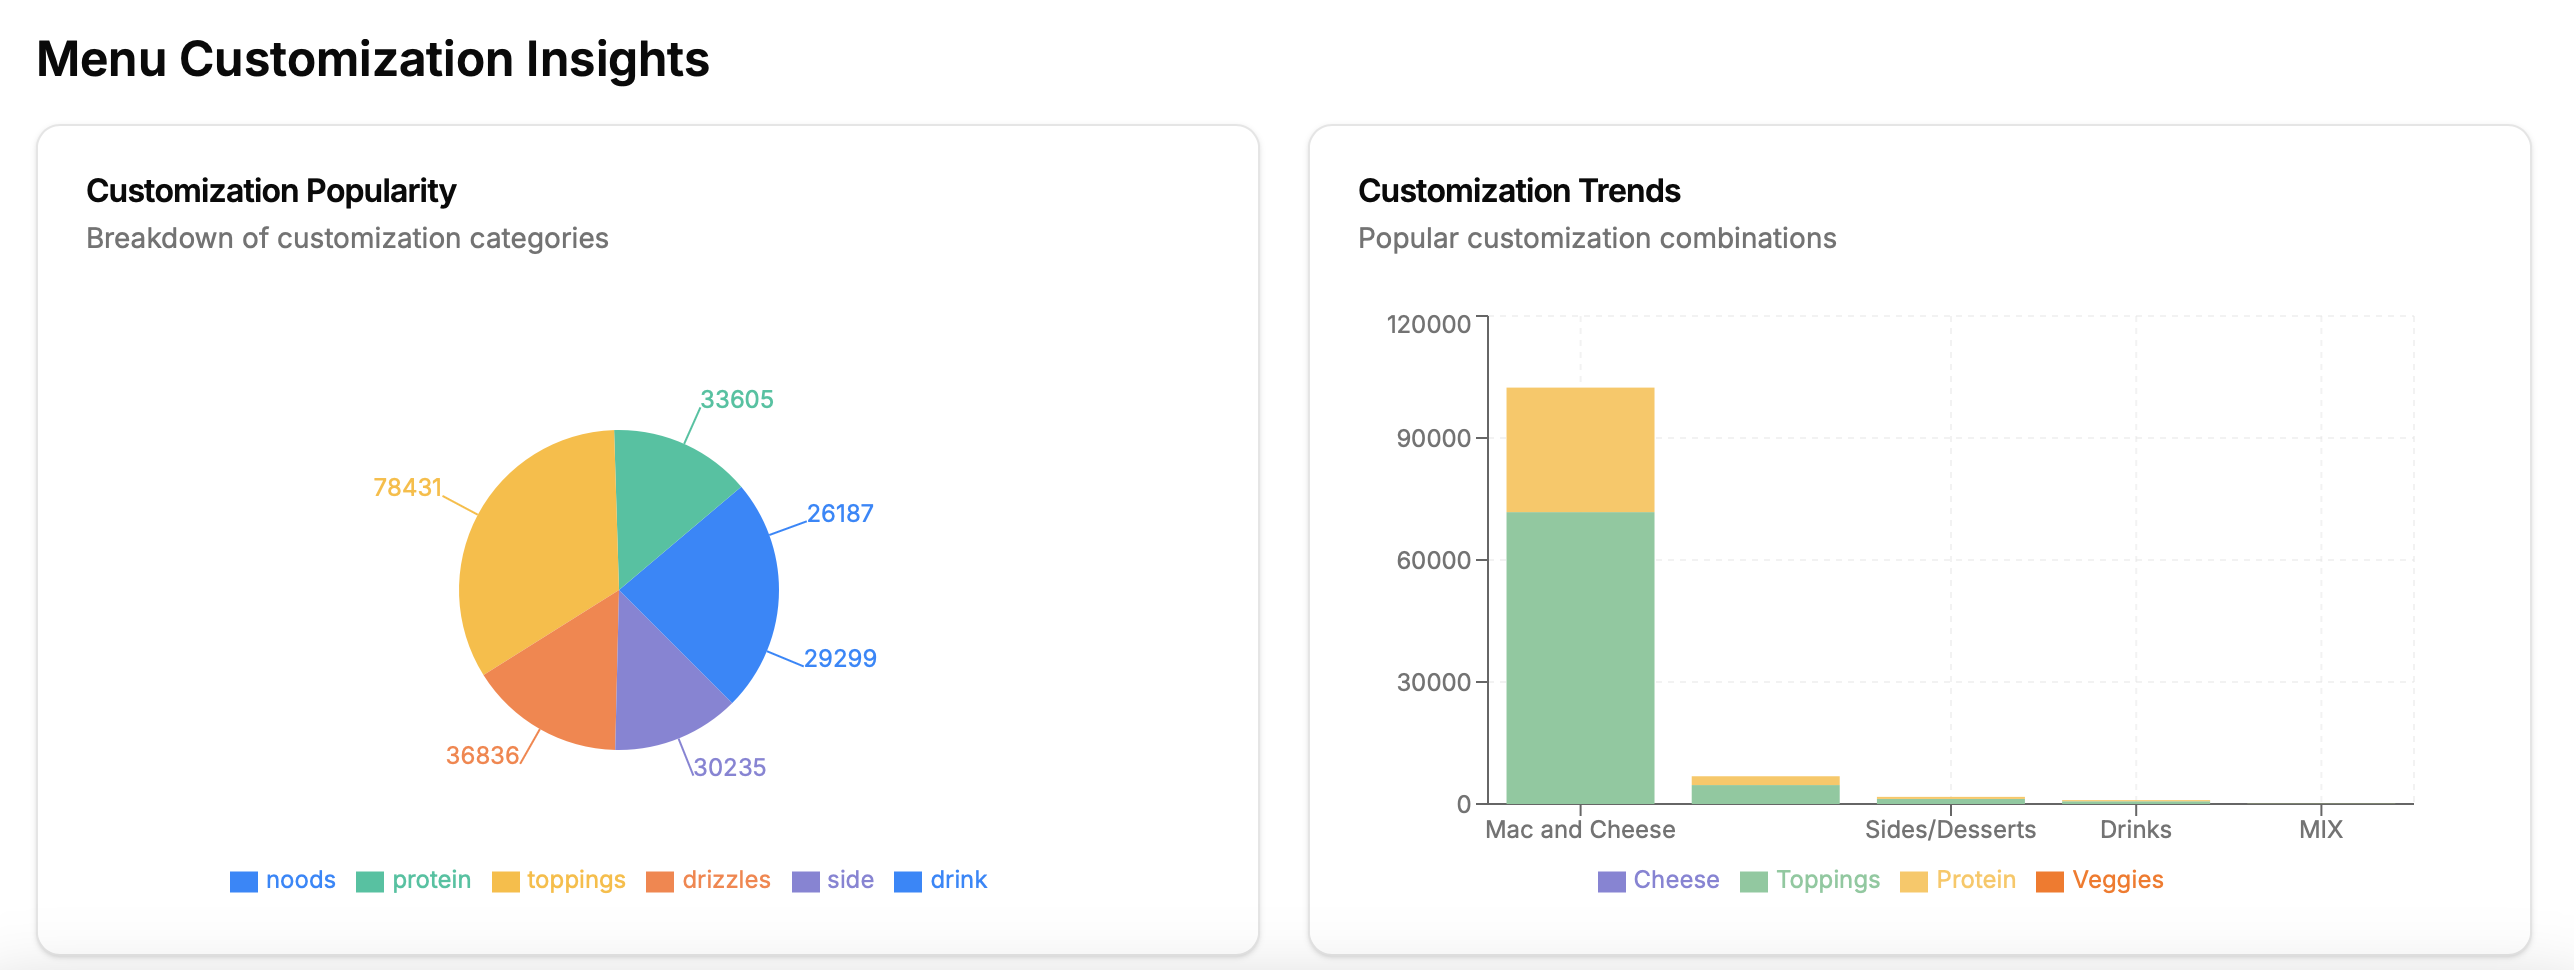
Customization Popularity Pie Chart Breaks down the popularity of different customization categories (e.g., drizzles, toppings).
Customization Trends Stacked Bar Chart Shows the distribution of customization options for the top items.
Technologies Used
- Full-Stack Framework: Next.js
Setup Instructions
Prerequisites
- Node.js: Version 14.x or higher
- npm or yarn: For package management
Installation Steps
Clone the Repository
git clone https://github.com/AidenStickney/Datathon-24-Ronis-Dashboard.git
Install Dependencies
Using npm:
npm install
Or using yarn:
yarn install
- Environment Variables
- Create a
.env.localfile in the root directory. Add the following environment variable:
NEXT_PUBLIC_BASE_URL=http://localhost:3000Adjust the URL if your CSV files are hosted elsewhere or if you're deploying to a different environment.
- Place CSV Data Files
- Ensure your CSV data files are placed in the
publicdirectory. Required CSV files:
 april_2024.csv
 may_2024.csv
 june_2024.csv
 july_2024.csv
 august_2024.csv
 september_2024.csv
 october_2024.csv
If you have data for additional months, you can add more CSV files following the same naming convention. You must also update the
csvFileUrlsarray inapp/api/orders/route.tsto include the new file paths.The CSV files should have the following headers:
Order #, Sent Date, Modifier, Option Group Name, Parent Menu Selection, Order ID
- Run the Development Server
Using npm:
npm run dev
Or using yarn:
yarn dev
- The application will start on
http://localhost:3000.
- Access the Dashboard
- Open your web browser and navigate to
http://localhost:3000to view the dashboard.
Usage
- Explore Charts: Interact with various charts to gain insights into customer behavior.
- Hover for Details: Hover over chart elements to see detailed information in tooltips.
- Responsive Design: The dashboard is designed to be responsive and accessible on different devices.
Built With
- next.js

Log in or sign up for Devpost to join the conversation.