Inspiration
The goal was to create a visual that might give insight into how Roni's should make some business choices. We chose to use temperature as a factor to see how certain toppings ordered might be affected by it.
What it does
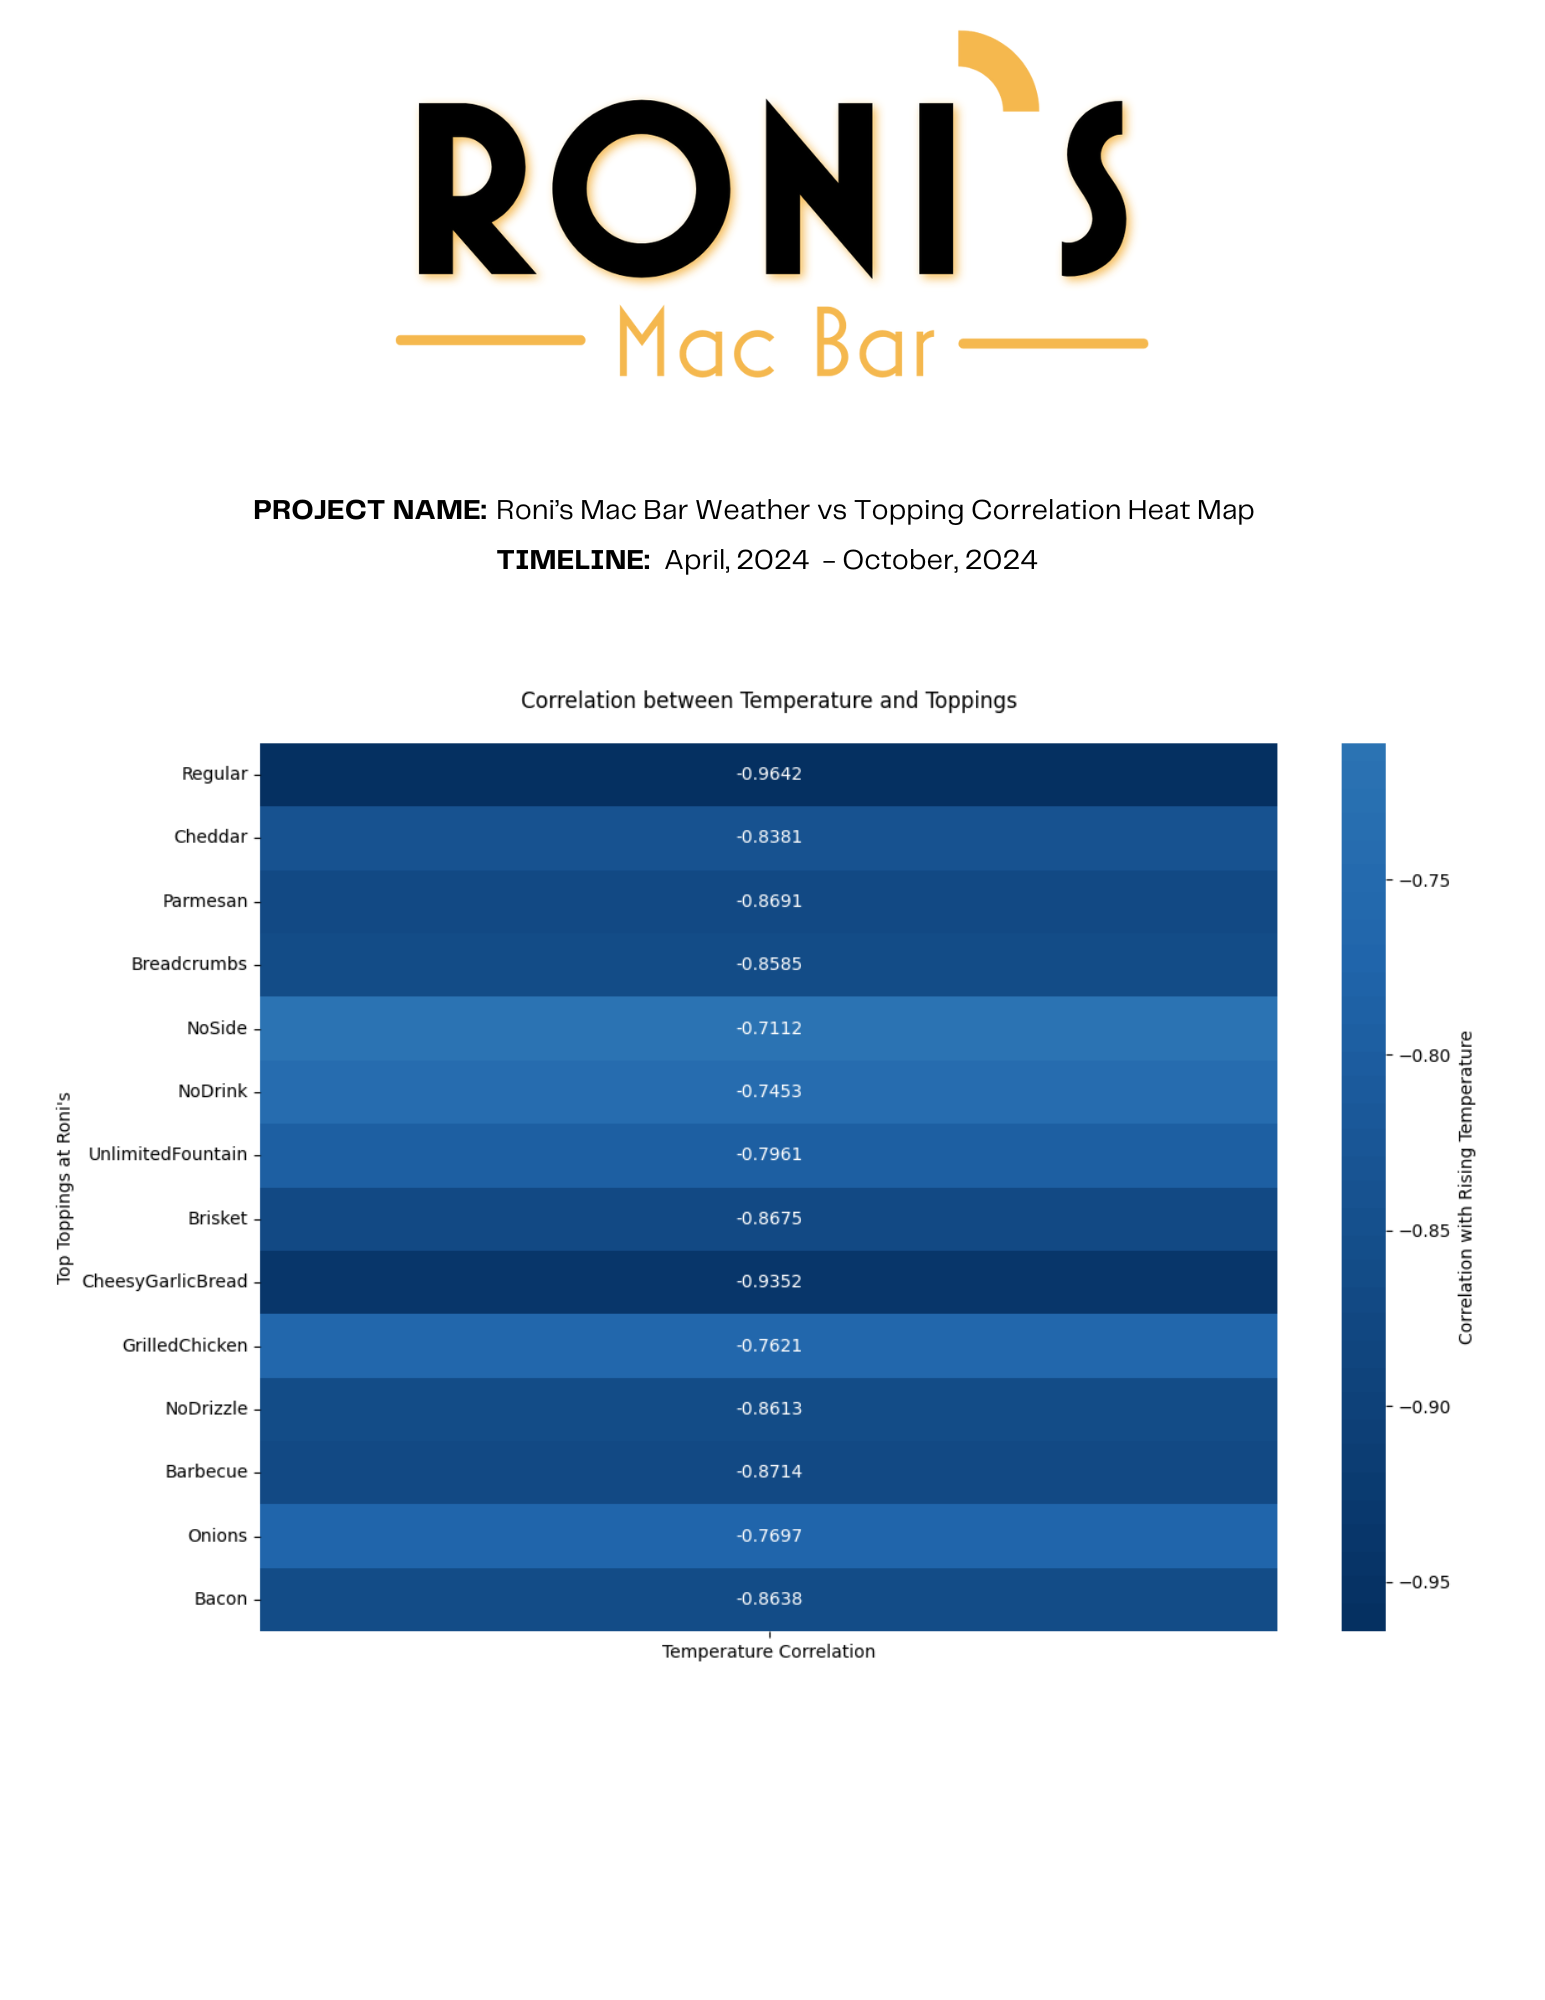
The heatmap displays the correlations of certain toppings ordered against rising temperature. A positive correlation indicates that when the temperature increases, the toppings ordered increases, and vice versa. This can be useful insight for Roni's by displaying what ingredients the business should order more or less depending on the forecast.
How we built it
We found data on average temperatures in College Station from April through October and matched each temperature with the orders made that day. The toppings were then counted by occurrence with each range of average temperatures. Using Seaborn, we formatted a heatmap that displays the correlations of the fields through color.
Challenges we ran into
Just trying to start the project was the most difficult part. We faced lots of difficulties by not knowing how to go about the project and just having to parse the information we were trying to process. Since we both had very little overall experience in this field, the entire project was a challenge. However, we managed to create something that we believe might give the business some valuable insight.
Accomplishments that we're proud of
The idea in itself feels valuable and insightful since we believe it can actually benefit the business. We were also proud of the method we used to collect each occurrence of topping. While relatively simple, this was a hurdle we were trying to overcome for most of the time and caused many of the difficulties we had to face. Once that was over, it was much simpler for the rest of the project.
What we learned
We learned how to process large amounts of information into something concise and visually appealing. We also gained experience in just data science in general. Almost every step of the way was something new, from the planning portion to seaborn.
What's next for Roni's Mac Bar Challenge
For the business, they should take our visual and see it as something that represents customer behavior. When it's colder out, more orders are made in general compared to when it's hot. It also displays which popular ingredients are affected by the temperature, which can be useful when it comes to ordering them according to the forecast.

Log in or sign up for Devpost to join the conversation.