-
-
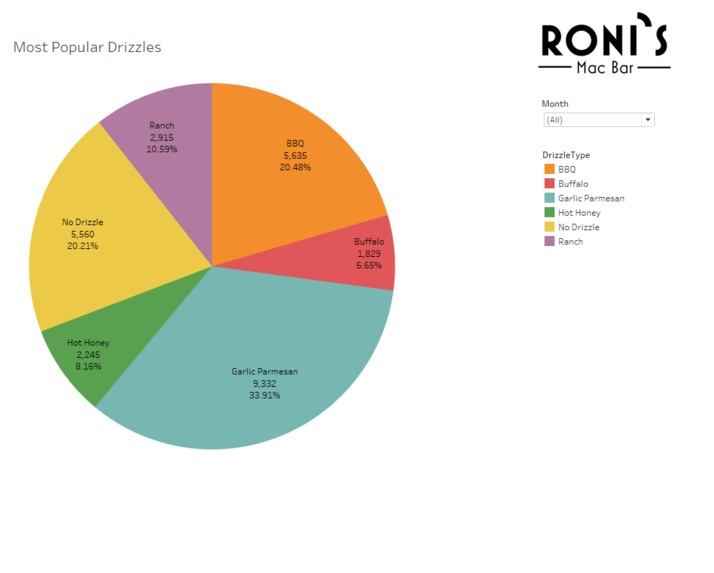
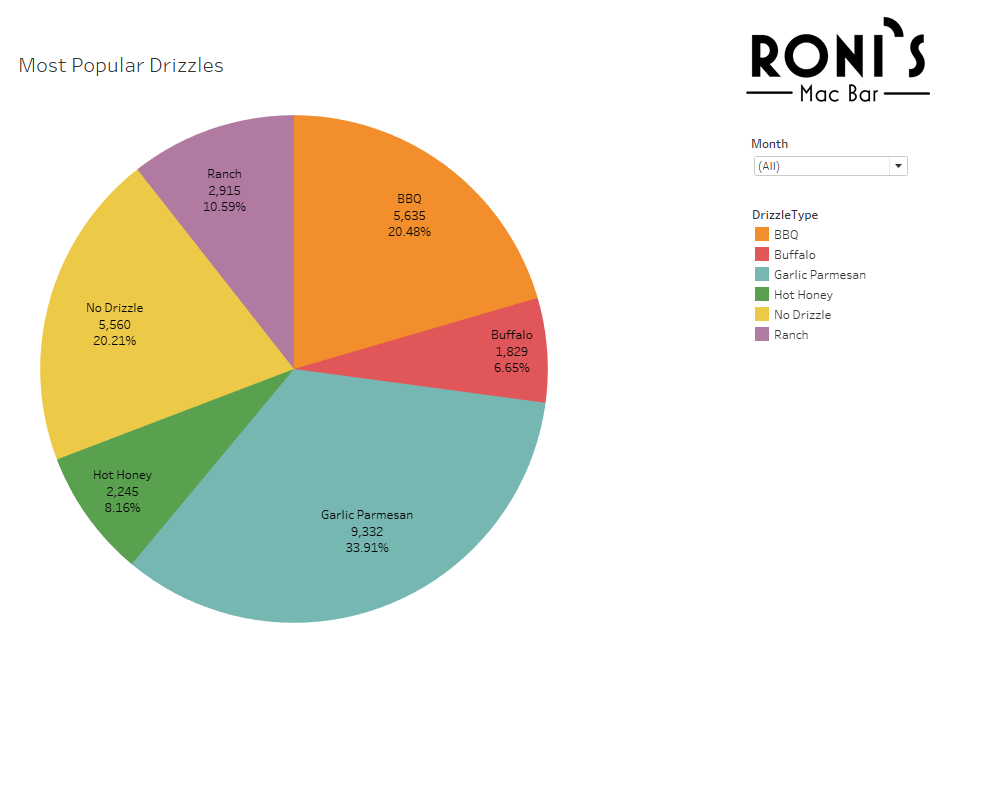
Pie chart of most popular drizzles
-
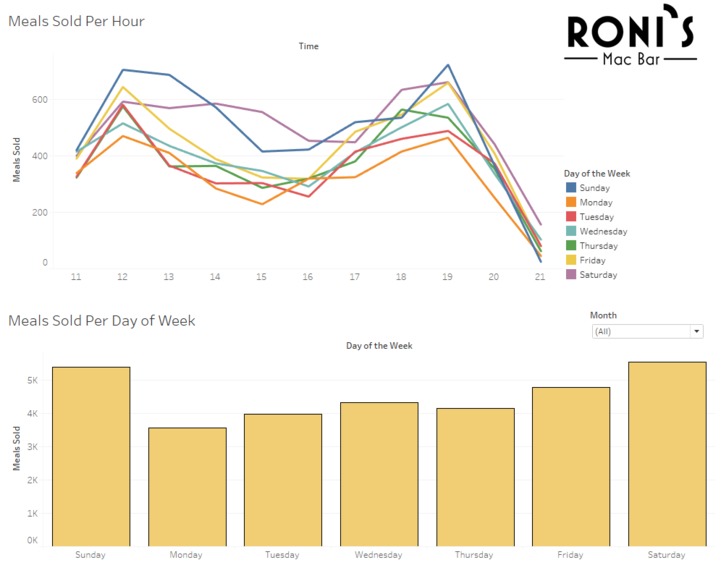
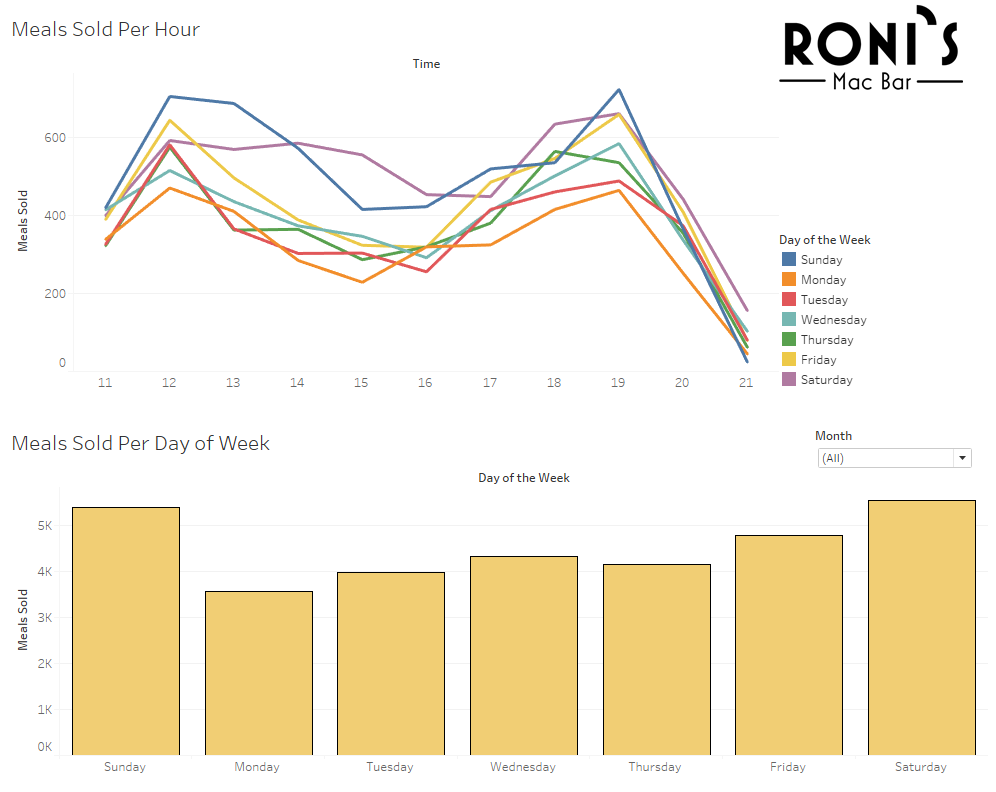
Data on meals sold
Inspiration
To help Roni's Mac Bar optimize sales and menu choices.
What it does
Visualizes sales patterns by day, time, and drizzle preference.
How we built it
Developed with Tableau, based on Roni’s historical sales data.
Challenges we ran into
Cleaning Data set, balancing data clarity with visual appeal.
Accomplishments that we're proud of
Created insights on peak hours and popular drizzles.
What we learned
How to clean data in an effective manner using pandas and visualize it in an insightful manner.
What's next for Roni's Dashboard
Add seasonal filters and customer feedback integration.

Log in or sign up for Devpost to join the conversation.