Inspiration
The inspiration for this project came from the desire to help a local business, Roni’s Mac Bar, gain deeper insights into its operations. By analyzing their sales data, we aimed to provide actionable insights that could help them optimize their menu offerings, streamline operations, and ultimately increase customer satisfaction. The challenge of transforming raw data into meaningful visualizations was an exciting opportunity to showcase how data can drive real-world business decisions.
What it does
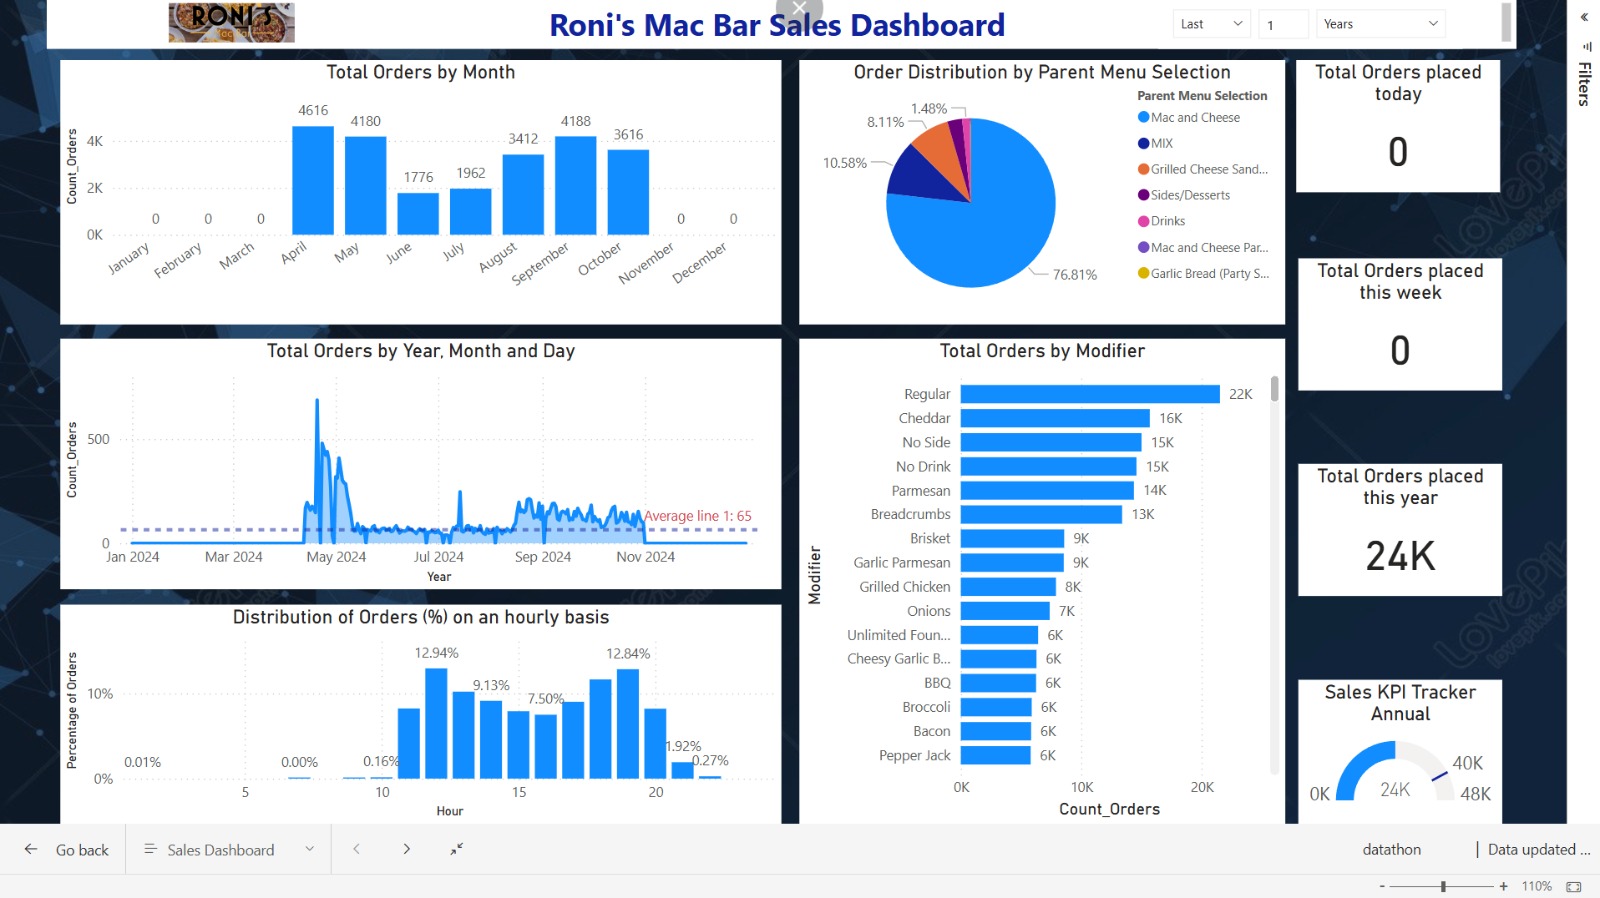
The dashboard provides a comprehensive overview of Roni's Mac Bar's sales performance. It tracks key metrics such as:
- Total orders by month and year
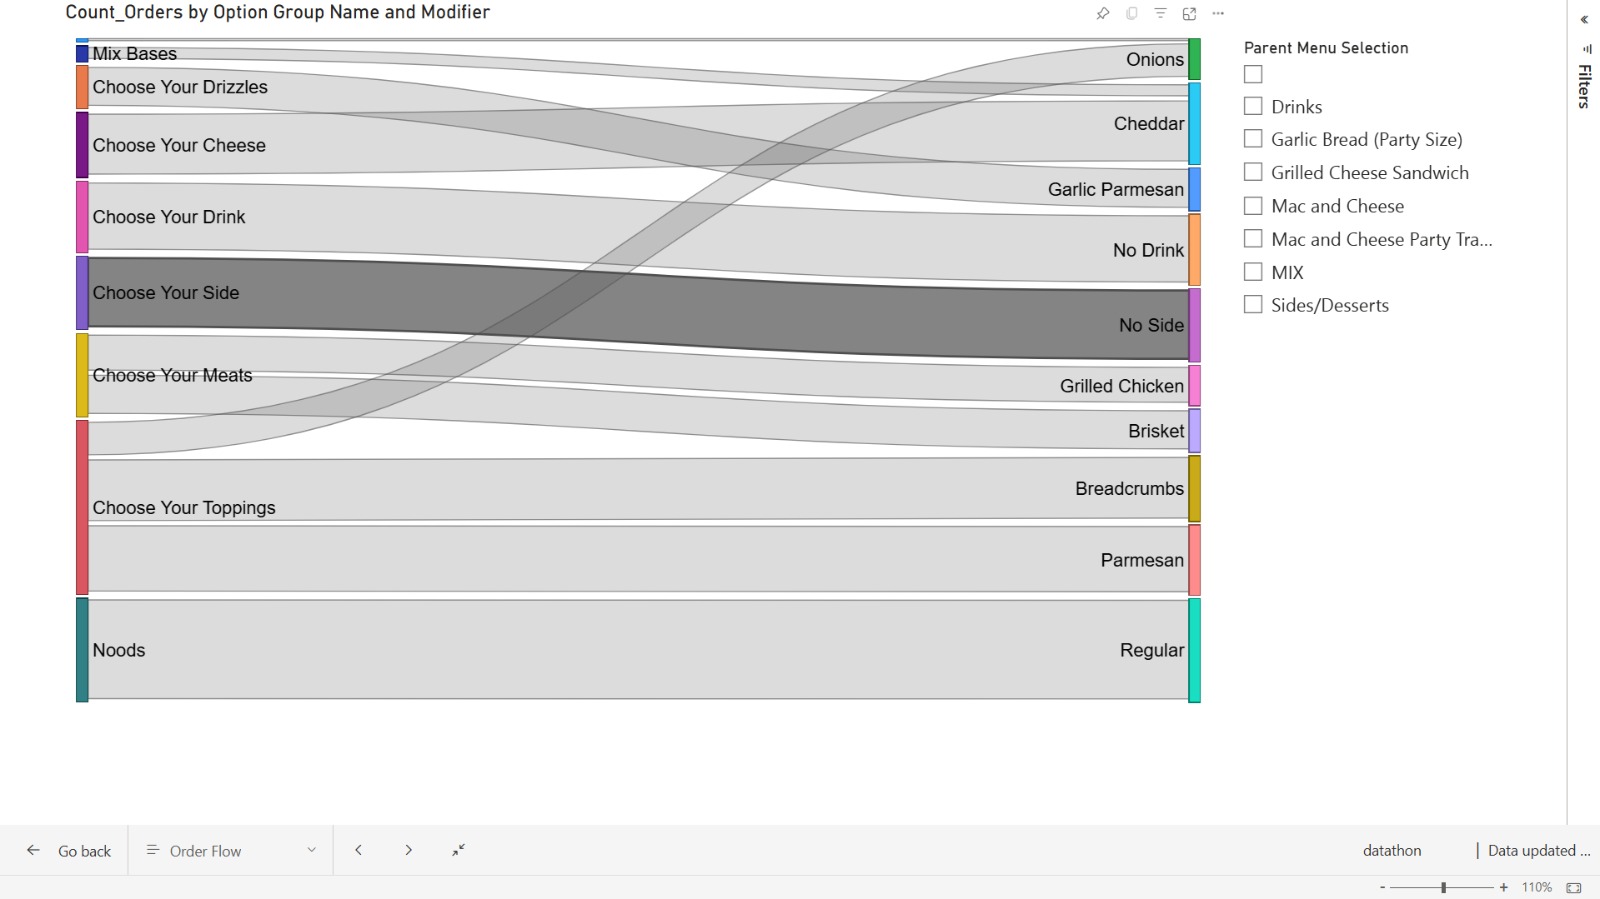
- Distribution of orders by menu items and modifiers (e.g., cheddar, brisket)
- Hourly distribution of orders to identify peak times
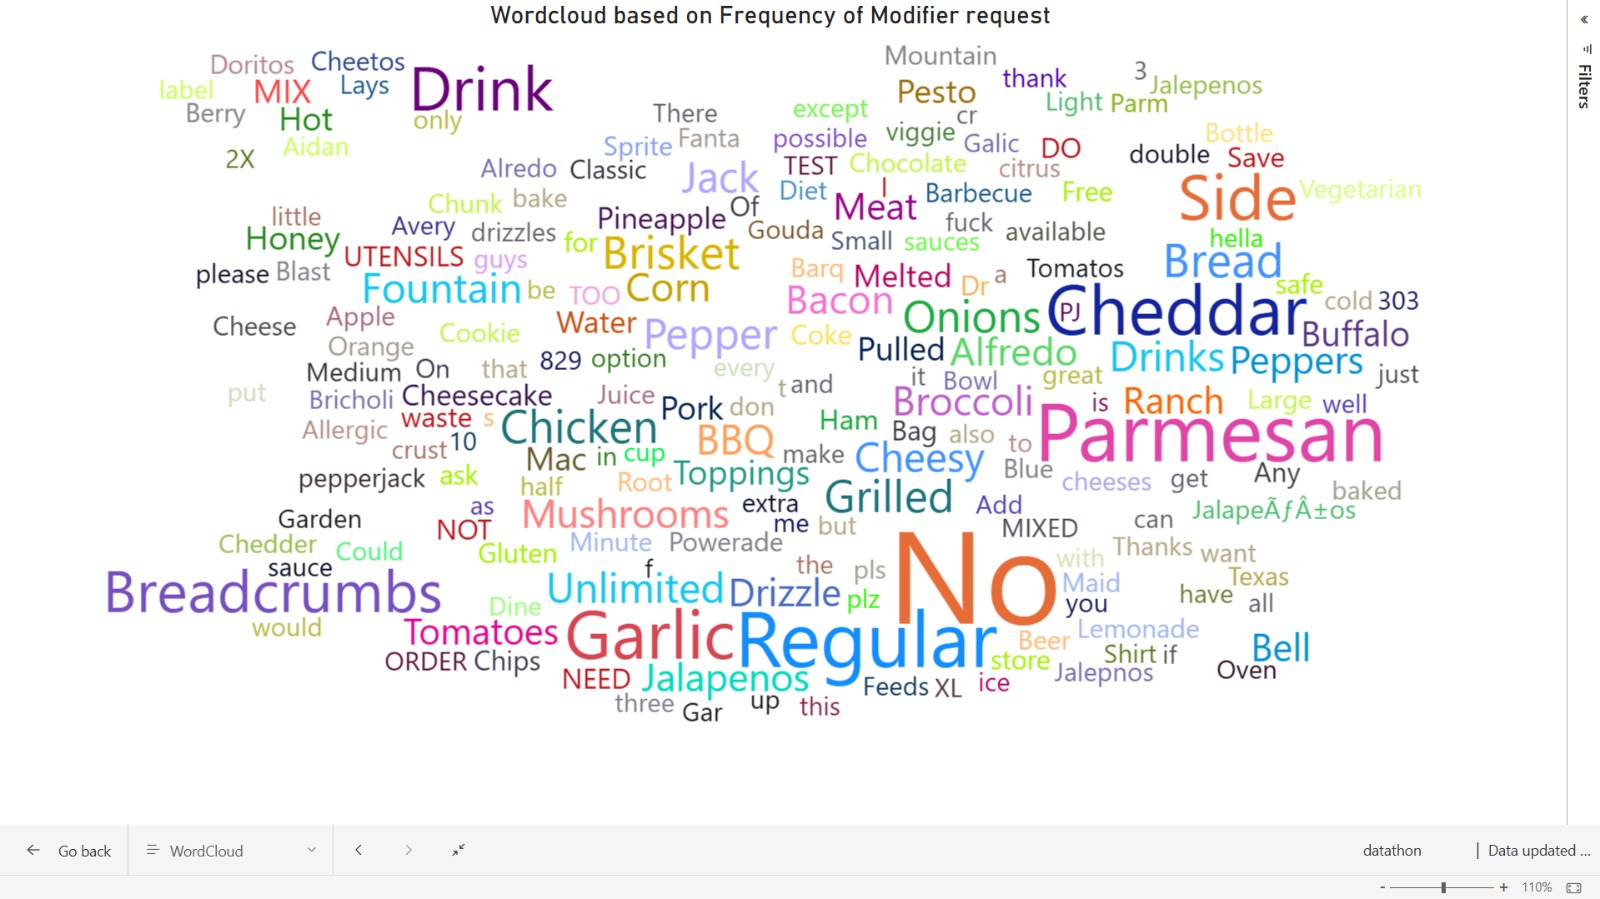
- A word cloud showing the frequency of modifier requests
This dashboard enables Roni's team to quickly assess sales trends, popular menu items, and customer preferences, helping them make data-driven decisions.
How we built it
We built the dashboard using Power BI, which allowed us to seamlessly integrate multiple datasets and create interactive visualizations. The process involved:
- Data Cleaning: We first cleaned the sales data to ensure consistency and accuracy using python, jupyter notebook and pandas.
- Data Analysis: We explored the data to uncover trends and patterns, focusing on key metrics like order volume by month, popular modifiers, and time-based trends.
- Dashboard Design: Using Power BI's visualization tools, we created various charts (bar charts, pie charts, line graphs) and a word cloud to represent the insights in an intuitive manner.
- Interactivity: Filters were added to allow users to drill down into specific time periods or menu categories.
Challenges we ran into
One of the main challenges was dealing with incomplete or inconsistent data. Some months had missing entries or irregularities in how modifiers were recorded. We had to carefully clean and normalize the data before it could be visualized effectively. Additionally, balancing the amount of information on the dashboard without overwhelming the user was a challenge.
Accomplishments that we're proud of
We are proud of creating a user-friendly dashboard that provides clear insights into customer preferences and operational efficiency. The integration of various visual elements like the word cloud and modifier breakdown allows Roni’s team to quickly understand what drives their sales. Another accomplishment is ensuring that our dashboard is scalable—new data can be added easily without needing significant rework.
What we learned
Throughout this project, we learned the importance of data cleaning and preparation in building effective dashboards. We also gained experience in designing visualizations that are both informative and easy to interpret for non-technical users. Additionally, working with Power BI taught us how powerful interactive dashboards can be in presenting complex datasets in a digestible format.
What's next for Roni's Challenge
Moving forward, we plan to incorporate predictive analytics into the dashboard to forecast future sales trends based on historical data. This could help Roni’s Mac Bar better prepare for peak seasons or slow periods. We also aim to enhance the dashboard with customer segmentation insights—identifying different types of customers based on their order patterns—to further optimize menu offerings and marketing strategies. We also want to include real-time count of total orders in a day/week (have included the prototype section in our dashboard as well).


Log in or sign up for Devpost to join the conversation.