-
-
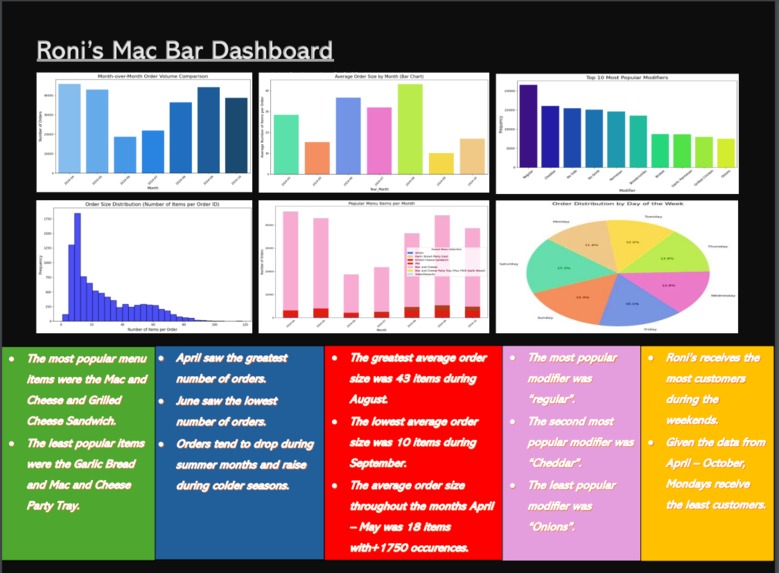
Dashboard

Inspiration
Working with a several large datasets and finding a way to make business decision based on the result of the data.
What it does
A dashboard that shows the statistics of Roni's mac bar.
How we built it
We built it through google Colab
Challenges we ran into
Downloading the data and mounting in into google colab as well as the coding process
Accomplishments that we're proud of
Effective teamwork
What we learned
We learned a lot about data cleaning, working with matplotlib and seaborn as well as the different types of ways to build graphs
What's next for Roni's Challenge
Make great business decisions based on the data we provided.

Log in or sign up for Devpost to join the conversation.