Inspiration
Several of our group members have experience with food service adjacent jobs, and as a result we have all witnessed the inefficiency both in terms of time and in food waste which can occur due to under or over preparation for customer demands While cooks can intuitively assess and prepare for meal order goals utilizing a data driven approach is a more complete and correct solution to this issue. Through supplying accurate predictions regarding meal orders Roni's can optimize its carbon footprint, minimize operational cost due to food waste, increase customer satisfaction through decreasing wait times and still serve fresh high quality food.
What it does
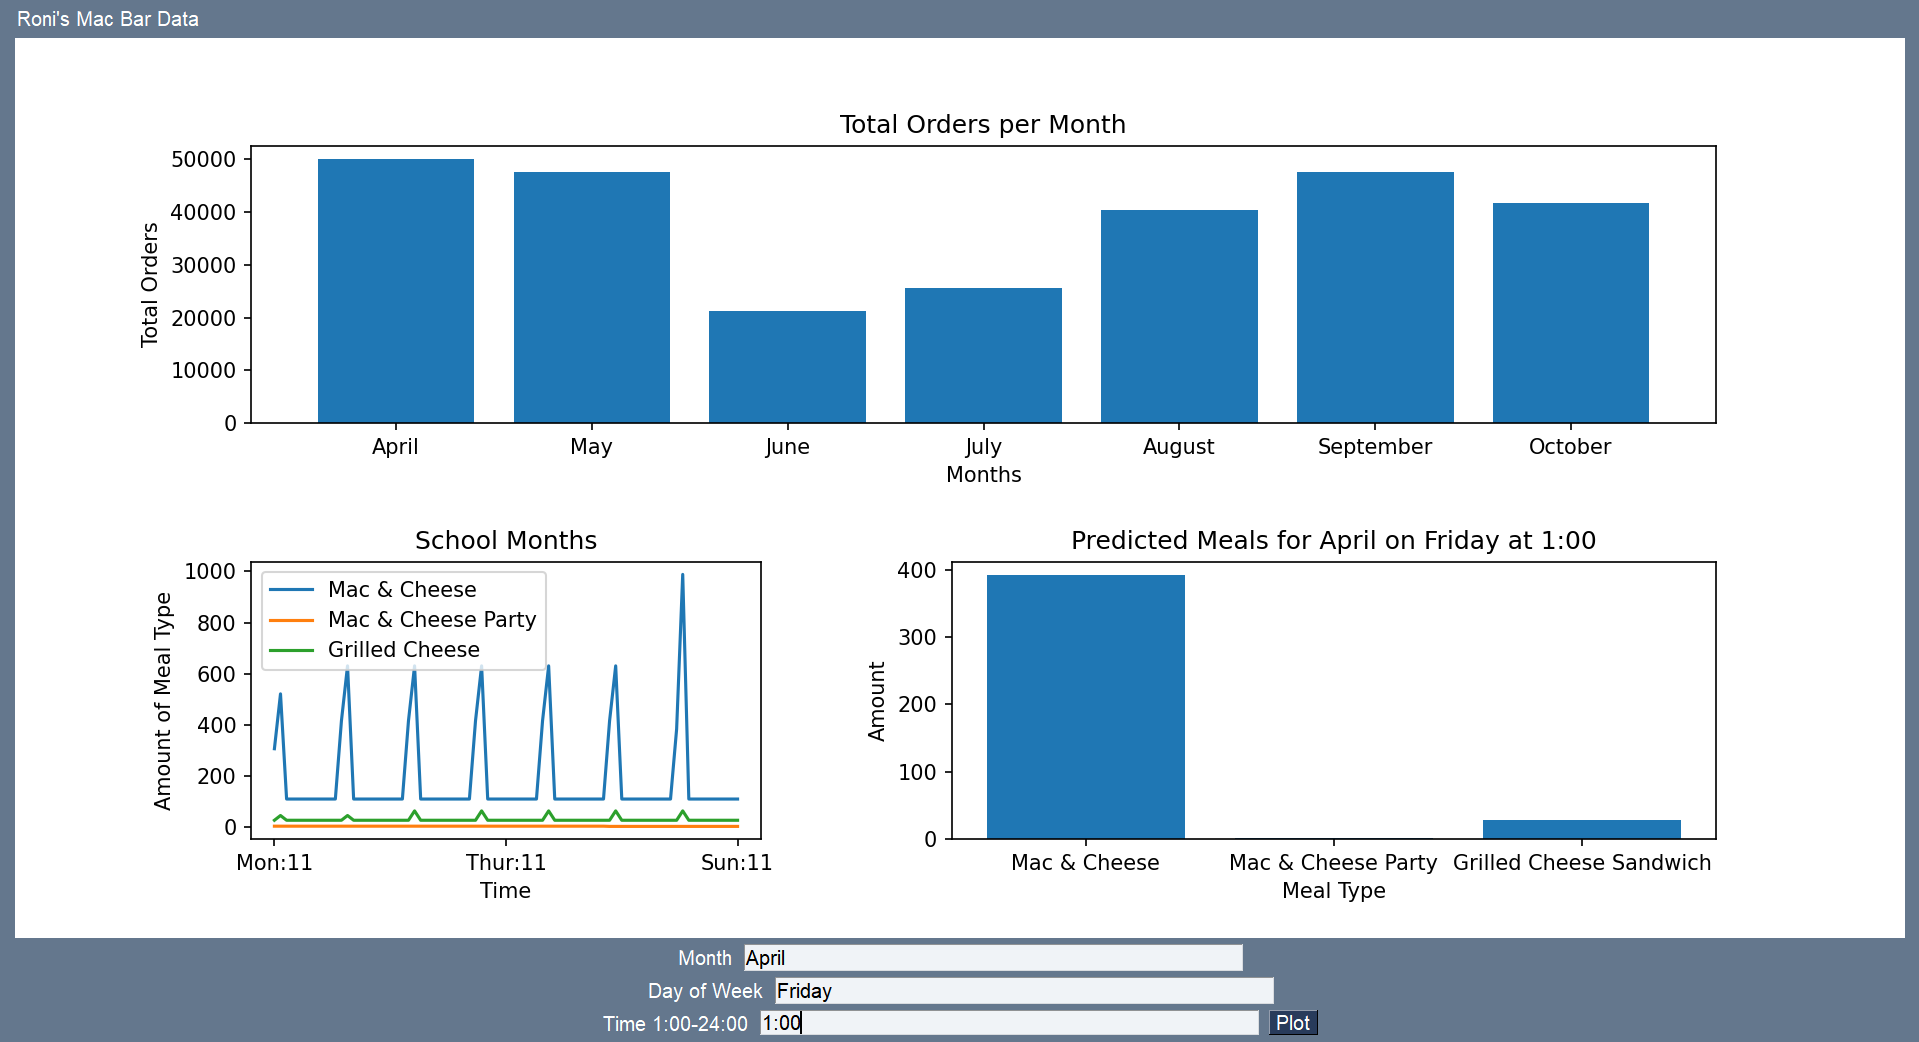
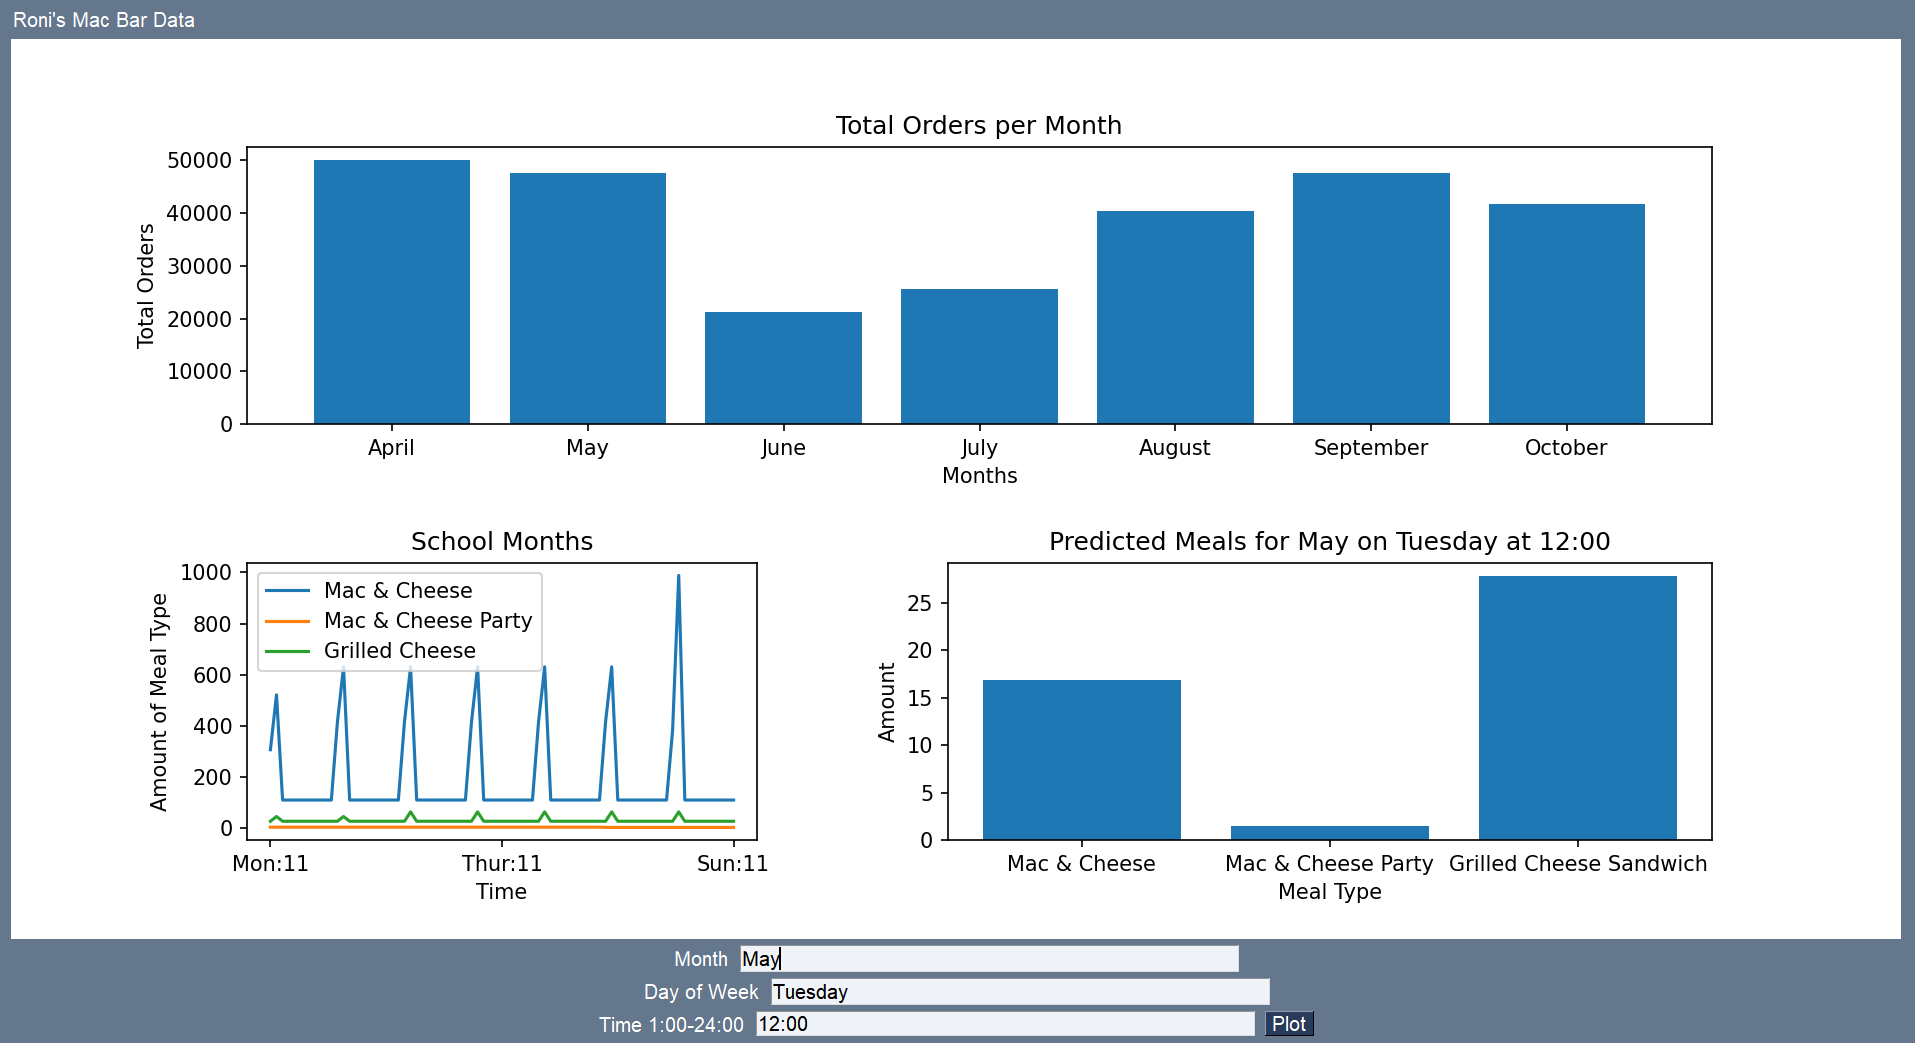
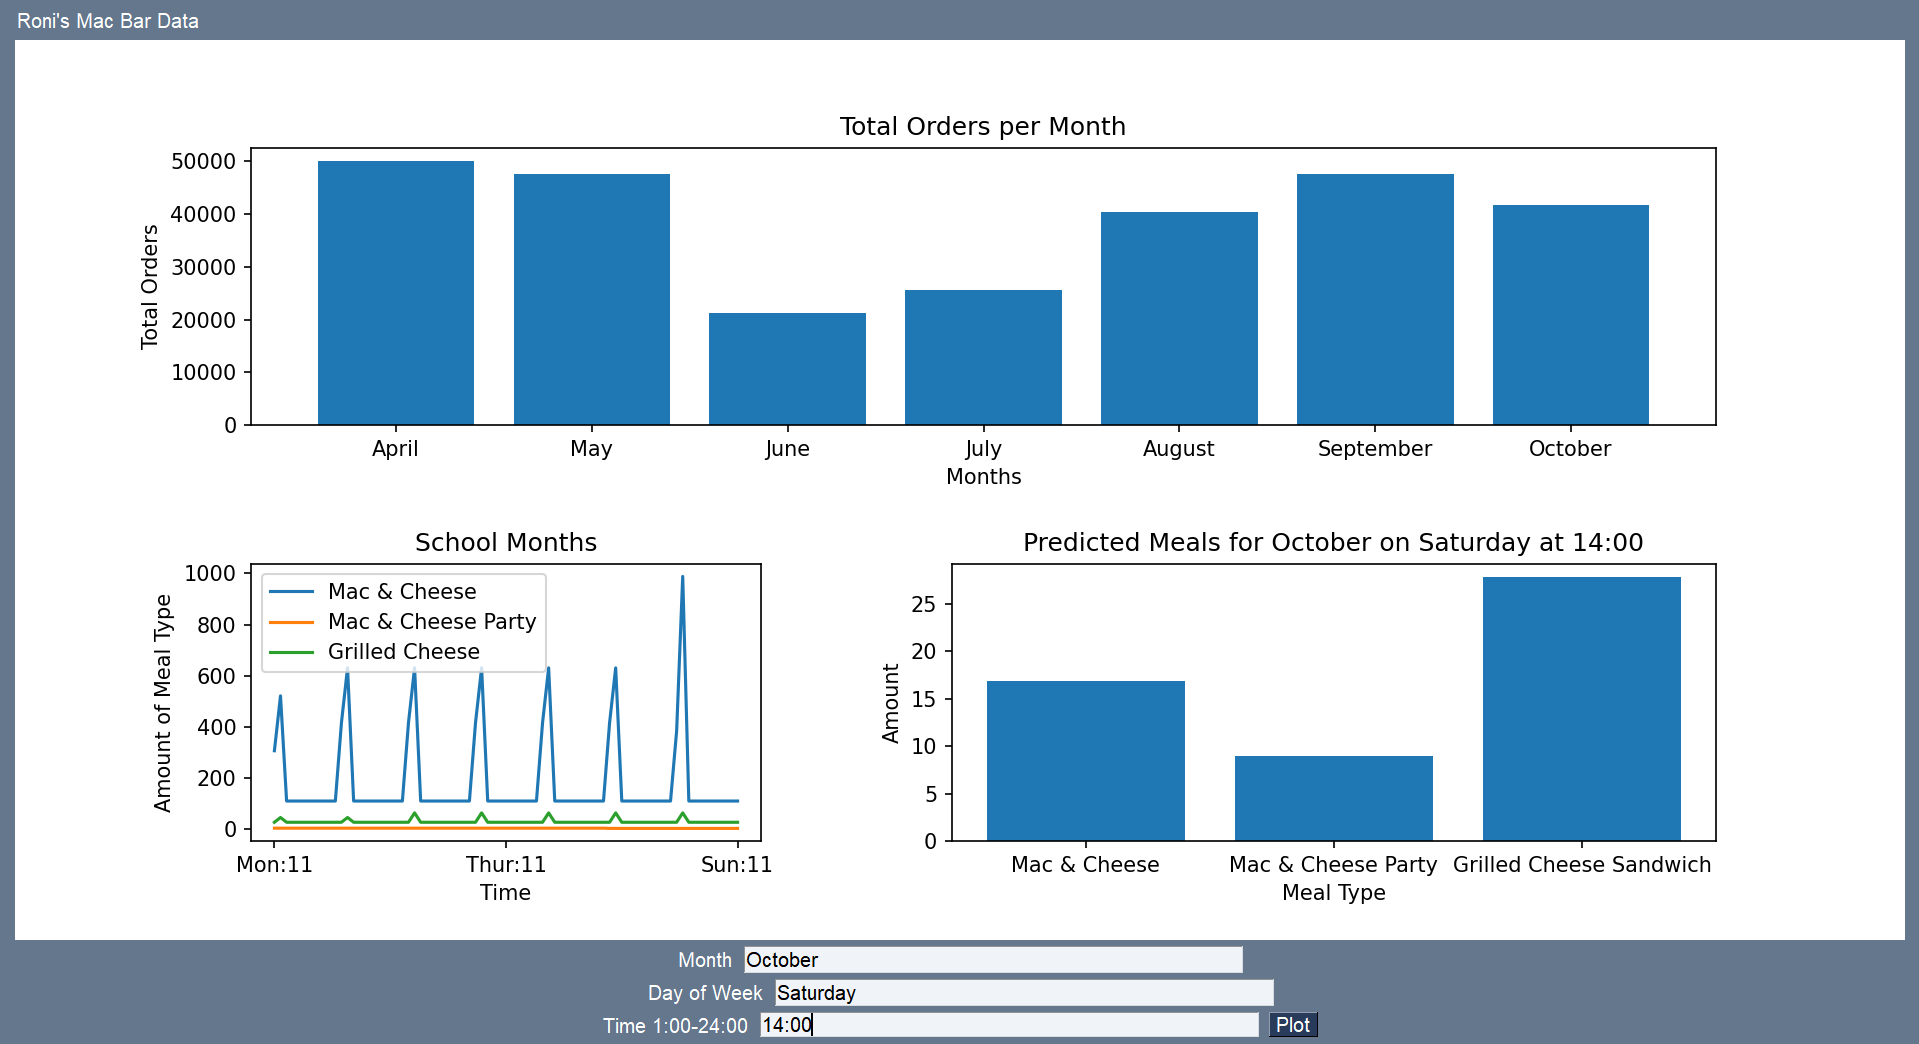
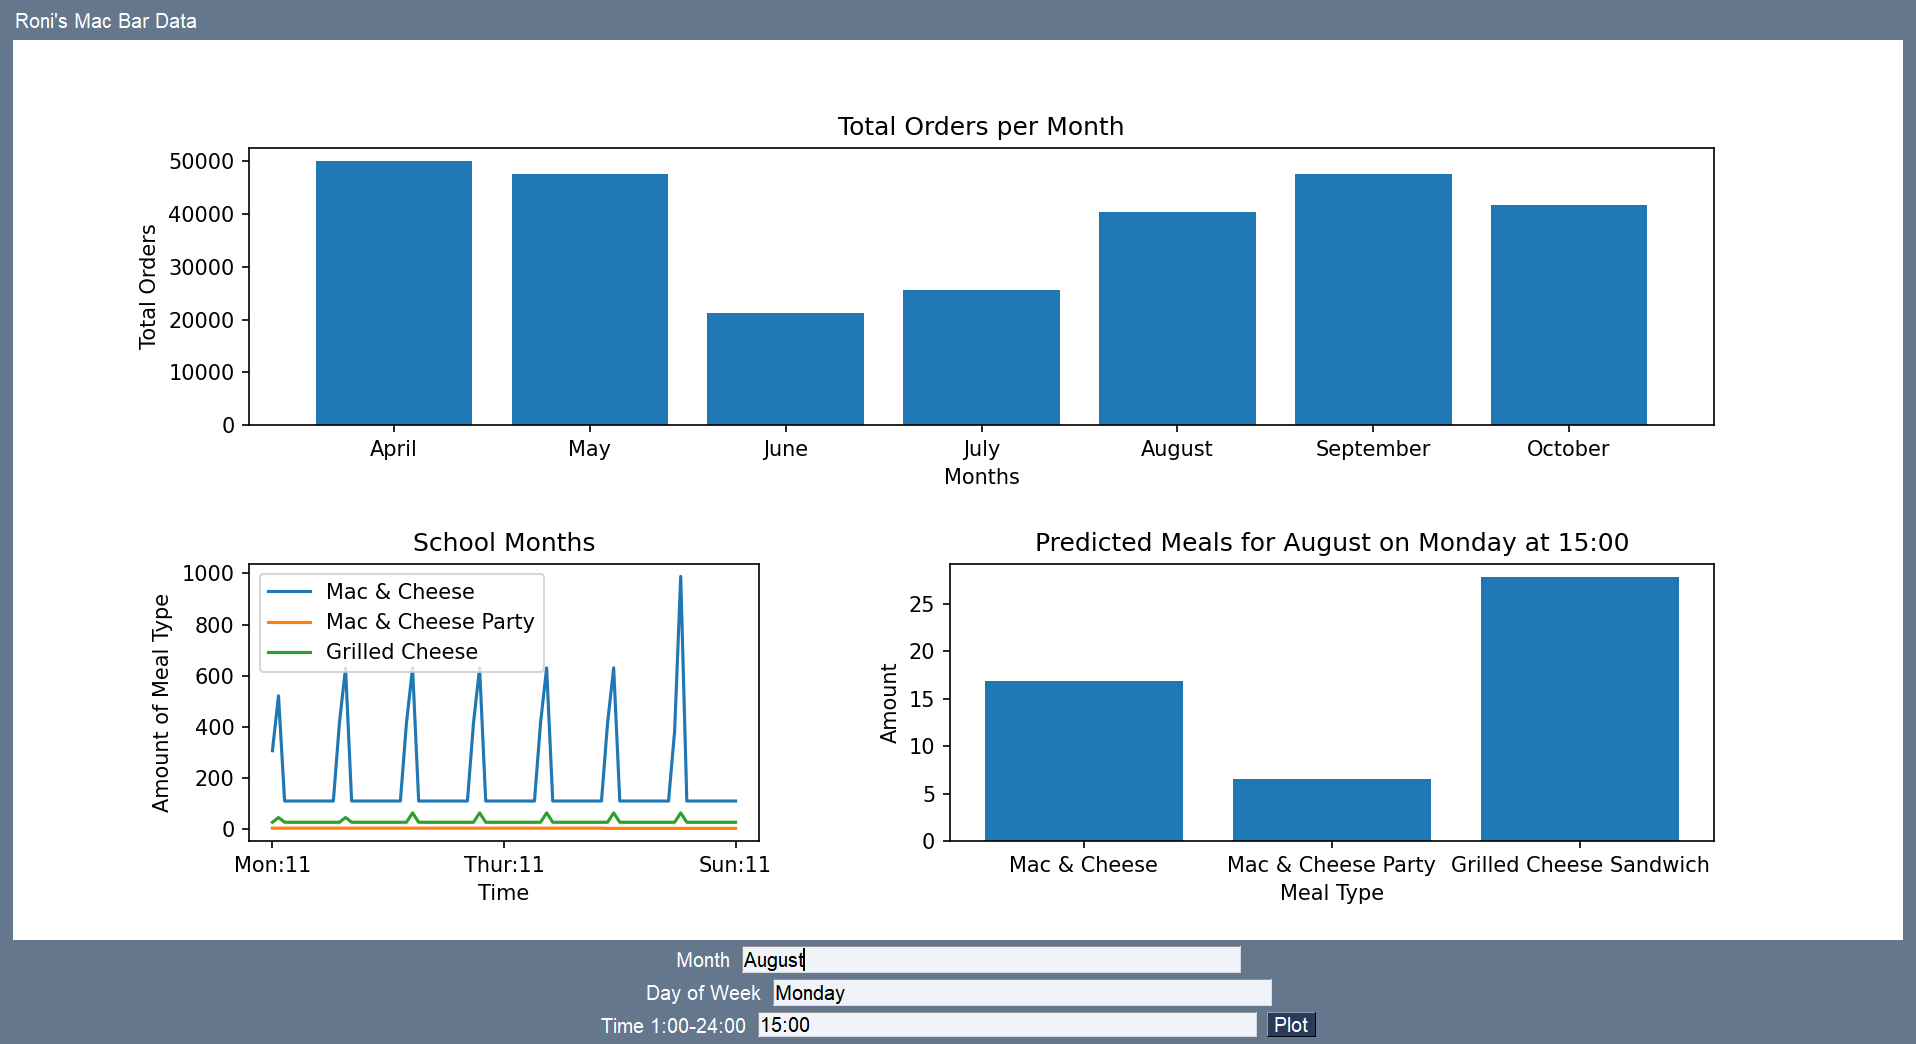
The roni.py script utilizes panda data frames to collect and sanitize the data in the csv order logs from the restaurant. We collect and display information regarding how many total orders are placed per month as well as feed the information collected into our machine learning model. This model has the ability to predict order amounts for the top 3 items ordered when given a day of the week, a month and a time of day. Using this we predict and display the order amounts for each of the three most popular meals at every time interval from opening on Monday to closing on Sunday. We also give the user the option in the dashboard to input a month, day and time in order to calculate estimates of orders needed at that time.
How we built it
We used the Pandas Library to place sanitized data into data frames which could then be used to train and validate our AI model. Following this for each meal type we separated the training data into a section 9/10 long for training data and the other 1/10 for data validation. ''' for name in dataInFile: for i in range(len(dataInFile[name]["time"])): #Data has a 1 in 8 chance of being used for validation chance=random.randint(1,10) if chance==9: validationData[name]["Month"].append(dataInFile[name]["month"][i]) validationData[name]["Time"].append(dataInFile[name]["time"][i]) validationData[name]["Day"].append(dataInFile[name]["day"][i]) validationData[name]["OrderNumbers"].append(dataInFile[name]["order"][i]) else: modelDataFrames[name]["Month"].append(dataInFile[name]["month"][i]) modelDataFrames[name]["Time"].append(dataInFile[name]["time"][i]) modelDataFrames[name]["Day"].append(dataInFile[name]["day"][i]) modelDataFrames[name]["OrderNumbers"].append(dataInFile[name]["order"][i]) ''' Following this we used the Model Data and Validation Data to find best maximum node height for the linear regression tree model we made to avoid over or under fitting the model. ''' from sklearn.metrics import mean_absolute_error from sklearn.tree import DecisionTreeRegressor def getError(max_leaf_nodes, train_X, val_X, train_y, val_y): model = DecisionTreeRegressor(max_leaf_nodes=max_leaf_nodes, random_state=2) model.fit(train_X, train_y) preds_val = model.predict(val_X) error = mean_ab ''' Following this we used those models to predict the values for the graphs and user inputs. To output the values we used a GUI which utilized both Matplotlib and SimpleGUI
Challenges we ran into
With the construction of the GUI one issue which we ran into was the integration of matplotlib and SimpleGUI functions in order to create a seamless user experience while preserving correctness of the data. Another issue we faced was also sanitizing data and loading it into panda frames in such a way as to make it trainable data.
Accomplishments that we're proud of
The user GUI is both user friendly and adequately displays data. Additionally we were able to create a program which could quickly train the models at run time while still optimizing them.
What we learned
We learned about how sometimes data presented to the user needs to limited for the sake of increasing readability as unreadable data is worse than less data in a more readable format.
What's next for Roni's Challenge Data Analysis and Visualization
Improvements to be done on the project would include allowing the user to toggle what meal calculations are displayed in the plot as all of meal predictions can be made from the data and the model, but not all are shown. Additionally another improvement would be to account for data about the date which are not immediately apparent to the linear regression model. Through noting weather a day is special like a holiday or notable game day more accurate information can be predicted on the outliers. This could be accomplished using more data.
Built With
- pandas
- pysimple
- simplegui
- sklearn

Log in or sign up for Devpost to join the conversation.