-
visualizations and dashboard

Inspiration
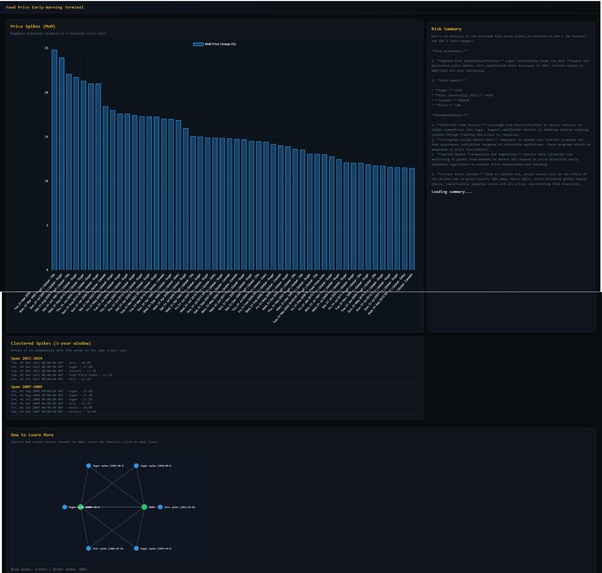
We wanted to use data for a social good but first we need to identify problem areas to begin defining the problem. Technology is one avenue we can take. A price-index chart identifies top MoM price changes, which we have grouped into times of severity. Context about these events are generated by Gemini API, connections are visualized in a knowledge web/mathematical graph, where each node includes a live link to relevant sources for additional news and information via Custom Search API.
This project fulfills UN SGD goals by providing a convenient news terminal that aggregates information, provides context, as well as connections to other events. This provides a complete picture of the pressures on UN's social development goals.
What it does
Traces abrupt global commodity price changes. Based on dataset hosted on BigQuery, can be adapted to live API feed.
How we built it
Lots of internet help.
Challenges we ran into
Learning.
Accomplishments that we're proud of
Lots of exposure to new tech.
What we learned
How to manage sleep.
What's next for Ronberg Terminal: International Food Price Index and News
Win big prizes.
Built With
- chart.js
- flask
- gemini
- google-bigquery
- google-custom-search-api
- js/html/css
- python
- vertexai

Log in or sign up for Devpost to join the conversation.