Every map app answers how far. For someone in a wheelchair, that's the wrong question. A 600 m route over broken slabs, cobbles and a curb with no ramp is worse than a 1 km route on smooth pavement, and a single flight of steps makes a route useless. Map data almost never records any of this. Sidewalk surface and condition are missing or out of date in most cities, and the projects that do map them (Project Sidewalk, AccessMap) rely on volunteers labelling street photos by hand.
Then we noticed something. Wheelchair users already carry the perfect sensor: a phone in the bag on the chair, which feels every crack. Research prototypes such as MyPath (UMBC) have shown that wheelchair vibration can identify surfaces, but nothing turned that into a tool anyone can open and use. So we asked: what if every ride quietly mapped the street for the next person?
What it does
RollMap turns a phone into a sidewalk-quality sensor, and turns what it measures into decisions:
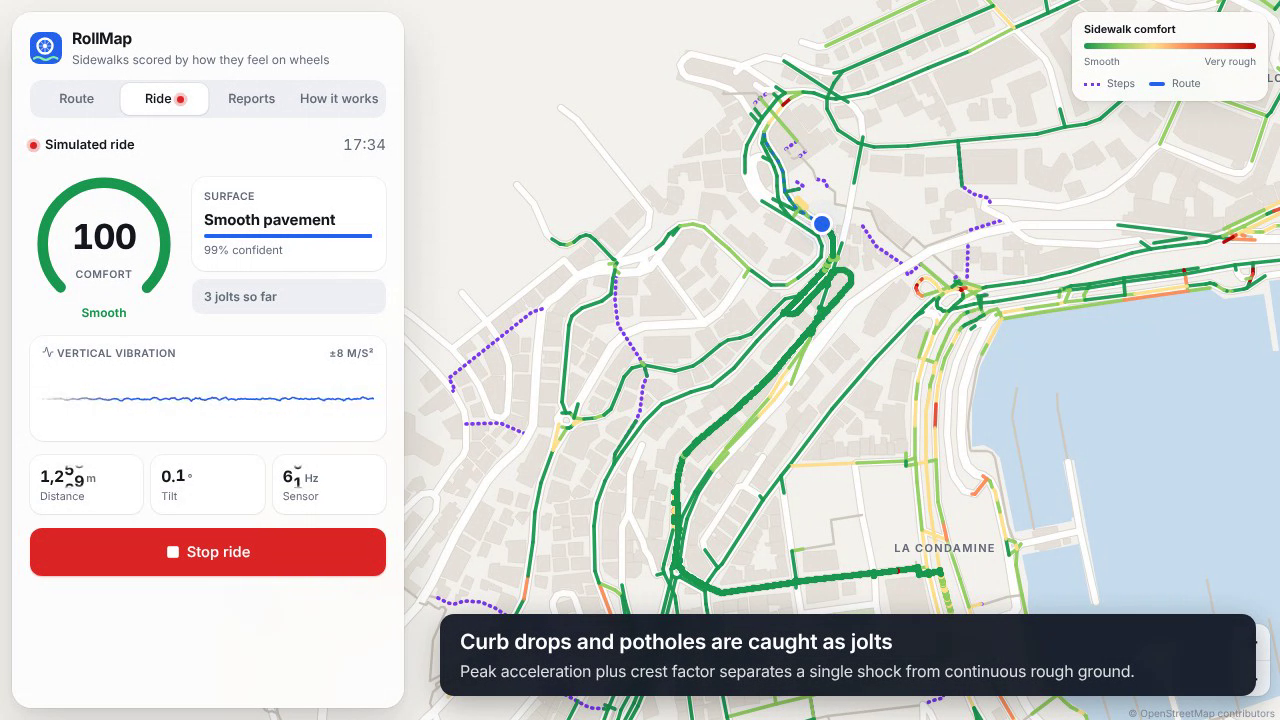
- Ride: put the phone in the bag, any way up, and roll. A live gauge shows comfort, surface type and jolts.
- Score: vibration is scored with ISO 2631-1, the international standard for how a seated body experiences shaking, so every street gets a 0–100 comfort score and every ride gets a health-exposure zone.
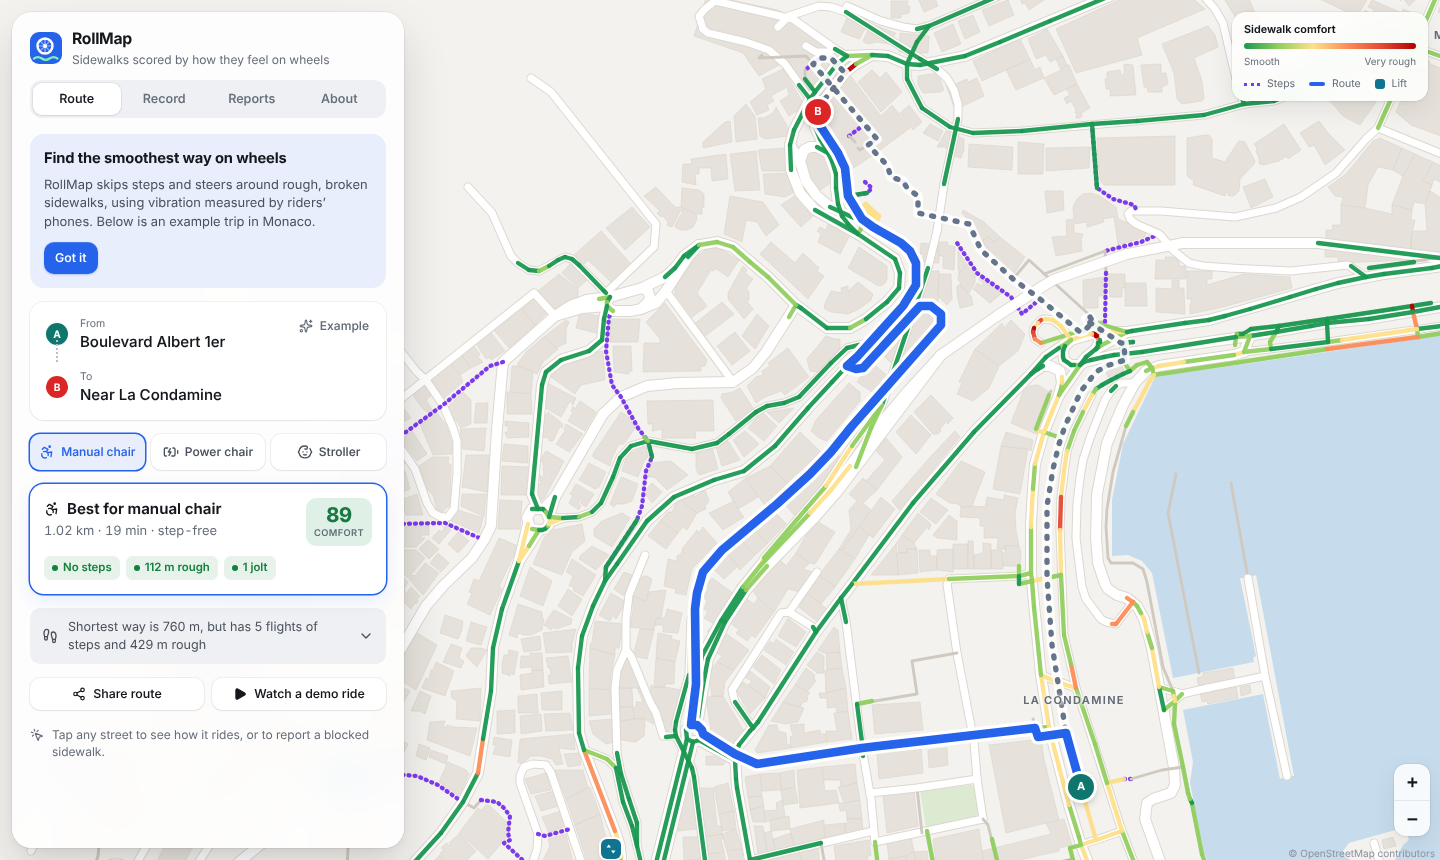
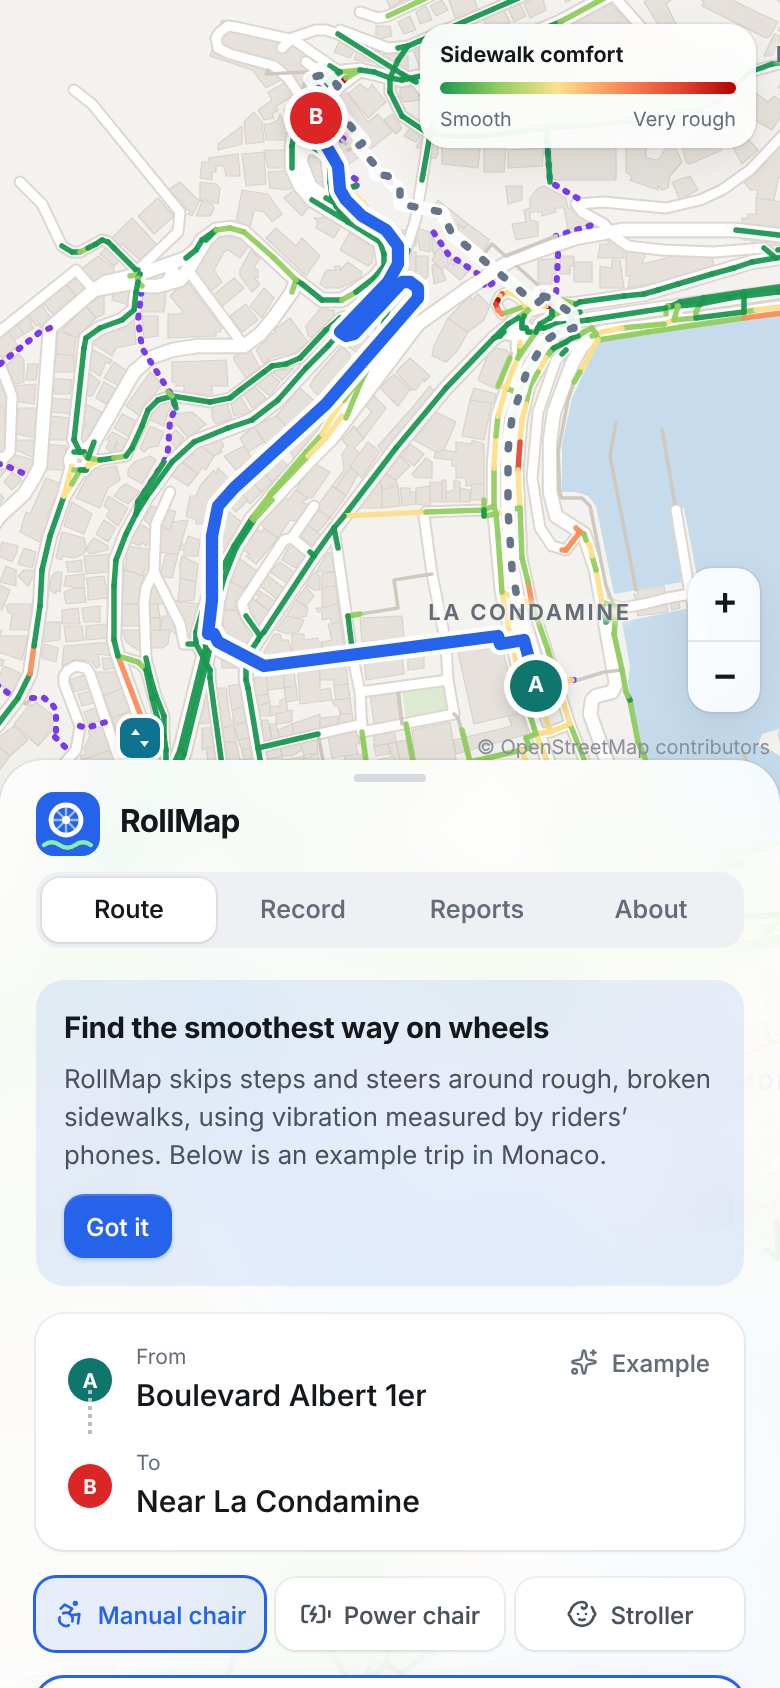
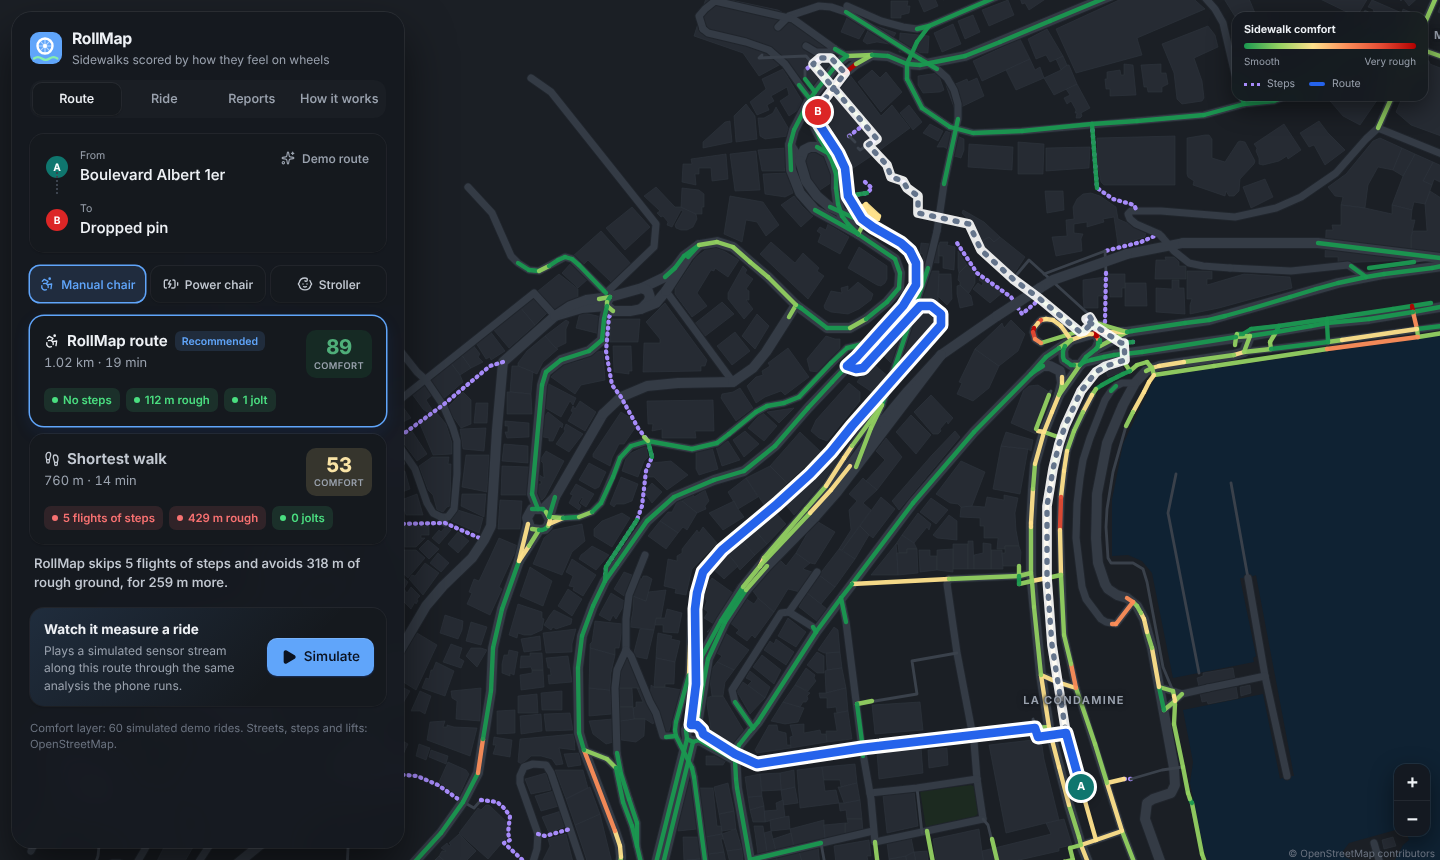
- Route: find the smoothest step-free route for a manual chair, power chair or stroller, and compare it against the shortest walk. In our Monaco demo the shortest walk has 5 flights of steps and comfort 53/100. RollMap's route is 260 m longer, step-free, and scores 89/100.
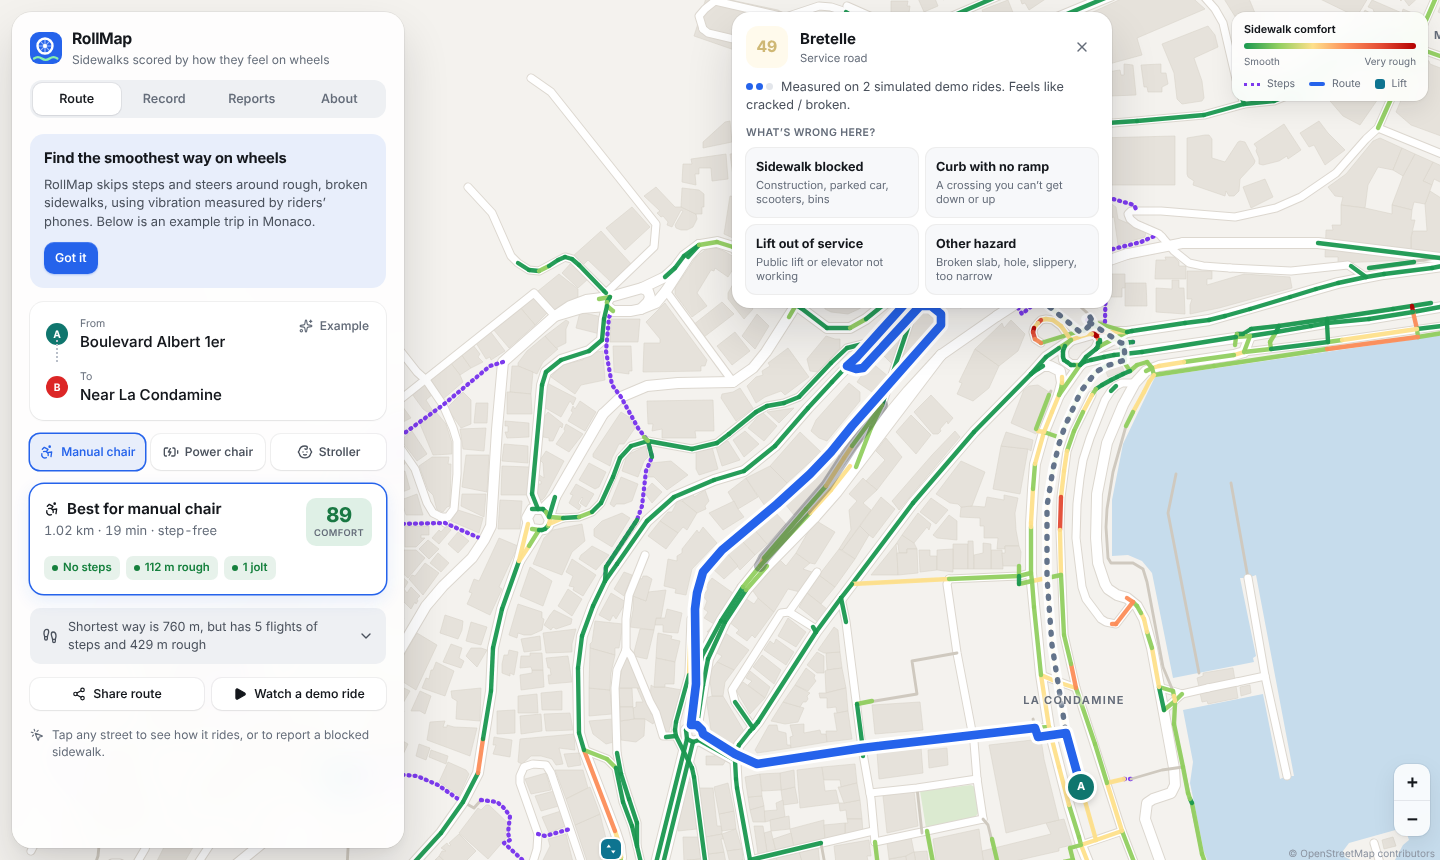
- Explain: tap any street to see its score, how many rides measured it, how recently, and how confident the app is.
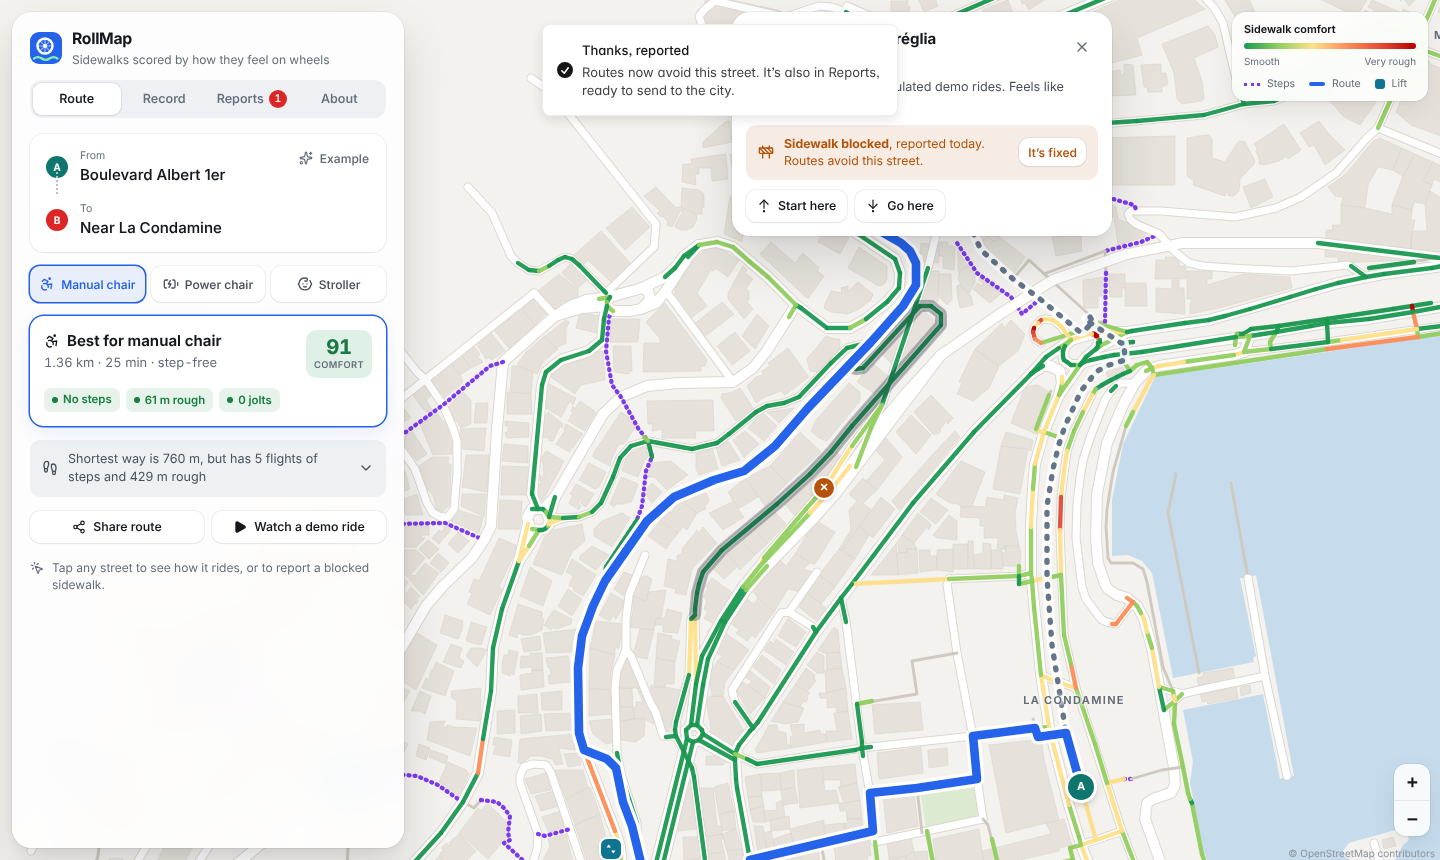
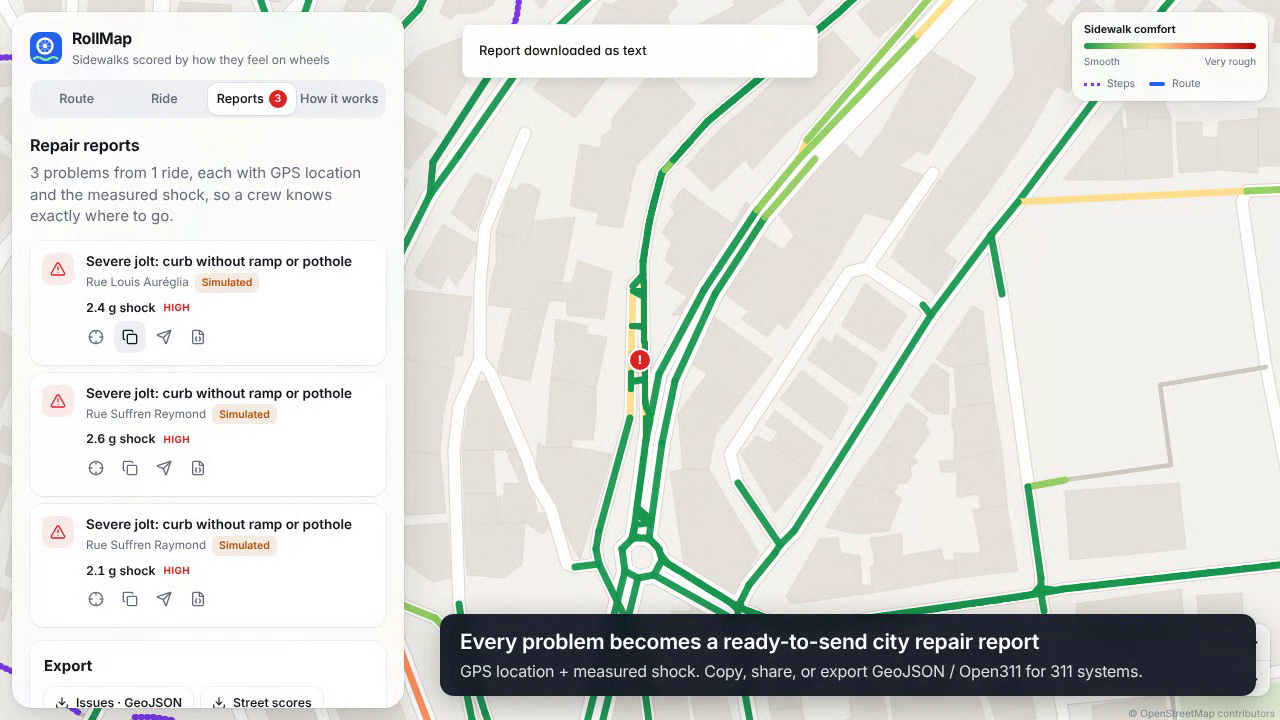
- Report: every curb drop, pothole, rough stretch or steep slope becomes a ready-to-send city repair report (text, GeoJSON, or an Open311 request). Barriers a phone can't feel, such as construction, a missing curb ramp or a broken lift, can be reported in two taps, and routes avoid them right away.
It runs in any phone browser. There's nothing to install, and your data stays on your phone.
How we built it
Signal pipeline (TypeScript, runs on the phone). Accelerometer samples are resampled to $f_s = 50$ Hz and cut into $N = 64$-sample windows (1.28 s) with 50% overlap.
Orientation independence. The phone can sit at any angle, so we estimate gravity as the window mean $\bar{\mathbf a}$ and project onto it to get the vertical vibration:
$$v(t) = \mathbf a(t)\cdot\frac{\bar{\mathbf a}}{\lVert\bar{\mathbf a}\rVert} - \lVert\bar{\mathbf a}\rVert$$
Human-weighted vibration. We apply the ISO 2631-1 $W_k$ frequency weighting in the frequency domain (our own radix-2 FFT). This weighting emphasises the 4–8 Hz band that the seated body is most sensitive to. From it we compute the weighted RMS acceleration and the vibration dose value:
$$a_w = \sqrt{\sum_f \big|W_k(f)\,V(f)\big|^2}, \qquad \mathrm{VDV} = \left(\int a_w(t)^4\,dt\right)^{1/4}$$
Comfort score. We map $a_w$ onto a 0–100 scale, logarithmic because perception is roughly logarithmic, anchored at ISO's "not uncomfortable" (0.2 m/s²) and "extremely uncomfortable" (2.5 m/s²) levels:
$$\text{score} = 100\left(1 - \frac{\ln(a_w/0.2)}{\ln(2.5/0.2)}\right), \text{ clamped to } [0, 100]$$
Jolts. A curb drop is a single shock, while rough ground is continuous shaking. We separate them with the peak and the crest factor $C = a_{\text{peak}}/a_{\text{rms}}$. A window counts as a jolt when $a_{\text{peak}} \ge 8$ m/s² and either $C \ge 3.8$ or $a_{\text{peak}} \ge 16$ m/s².
Surface classifier. From each window we extract 15 features (RMS, crest factor, kurtosis, zero crossings, energy in five frequency bands, spectral peakiness, the rhythm of paver joints from autocorrelation, and speed). These feed a small neural network (15 → 32 → 4) that we trained ourselves in TypeScript with Adam, so it runs on the phone with no server. It distinguishes smooth pavement, cracked/broken, pavers and gravel.
Routing. We turned OpenStreetMap footpaths and streets into a routable graph and run Dijkstra with a cost per segment $e$ of length $L_e$:
$$c(e) = L_e\Big(1 + s_p\,(d_e + \tau_e) + \tfrac{i_e}{10}\Big) + J_p\,j_e$$
Here $d_e$ is measured discomfort, falling back to an OSM surface prior when no one has measured the segment yet. $\tau_e$ is a penalty for busy roads, $i_e$ is the incline, and $j_e$ is jolts per pass. $s_p$ and $J_p$ depend on the mobility profile. Steps, segments steeper than the profile allows, and reported barriers cost $\infty$.
Map. Raster tile servers were unreachable from our build environment, which would have meant a blank map in the demo. So we built our own vector basemap: we chained the OSM coastline into a sea polygon, then drew buildings, parks, streets, steps, public lifts and toilets on canvas. It works offline and looks the same everywhere.
Stack: React 19, TypeScript, Vite, Leaflet (canvas renderer), Vitest, Playwright, GitHub Pages.
Validation on real data
We wanted more than simulated results, so we ran two small public datasets through the exact app pipeline (scripts/validate-real.ts):
- 4 real bicycle rides, IIT Guwahati (100 Hz phone + GPS). Our comfort score ranked the road that photos show is structurally failing as the worst of 6 roads in every single ride. Rank agreement with the dataset's own roughness ranking is $\rho \approx 0.89$. All 15 photographed defects had a jolt flagged within 25 m, and 12 of 15 were flagged on 3 or more separate rides, against 46% of random points on the route.
- 6 real car drives, Austin, with 153 events labelled from dashcam video. Our vibration peak separates real potholes from other bumps with AUC = 0.87.
Challenges we ran into
- No wheelchair data we could use. The public wheelchair and road-vibration datasets are 7–44 GB and were blocked from our build environment. We trained the classifier on a physics-based simulator of wheel-on-surface vibration (81.7% accuracy per window, 89.5% per street segment, on held-out simulated rides), then searched GitHub for small real datasets to validate against.
- A factor-of-2 bug in the standard. Our first $W_k$ filter came out about twice too strong. We tracked it to an extra normalisation term and fixed it until the filter matched ISO's table (e.g. $|W_k(16\text{ Hz})| = 0.769$).
- Too many jolts. The first version flagged 42 jolts on one route. The causes were a simulated pothole being counted along a whole street and a threshold that caught ordinary roughness. Fixing the simulator, adding the crest-factor rule and counting jolts per pass brought it down to 1.
- GPS jitter inflating distance. A phone standing still "moved" a few metres every second. We now count a step only when it is larger than $\max(5\text{ m}, \text{GPS accuracy})$.
- Information overload. The first UI showed everything at once. We redesigned around one question, "what's the best way for my chair?": one recommended route first, with details one tap away.
What we learned
- Standards like ISO 2631 are a gift. They turn "this feels bumpy" into a number that a doctor, an engineer and a city council all accept.
- A crest factor tells a curb apart from cobbles better than any threshold on raw acceleration.
- Many real barriers (construction, parked cars, broken lifts) aren't bumps at all. Sensing alone isn't enough, so the human report flow matters as much as the sensor.
- Being honest about what's simulated makes a project stronger, not weaker.
What's next
- Partner with a wheelchair user group to collect labelled real wheelchair rides with the built-in "Teach RollMap" mode, and retrain on them.
- Add a shared backend so one rider's measurements help everyone, with privacy zones around home.
- Pilot with a city's 311 system using the Open311 export.
Honest status
The Monaco comfort layer and the demo ride are simulated and labelled as such in the app. Streets, steps, lifts and buildings are real OpenStreetMap data. Live sensing, scoring, routing and reports work on real phones today. The real-data checks above used public bicycle and car recordings, because no reachable wheelchair dataset existed.
AI use: research, code, tests, the write-up and the demo voiceover (Piper text-to-speech) were produced with Claude (Anthropic) under our direction. We chose the problem, reviewed the approach and own the submission.

Log in or sign up for Devpost to join the conversation.