-
-
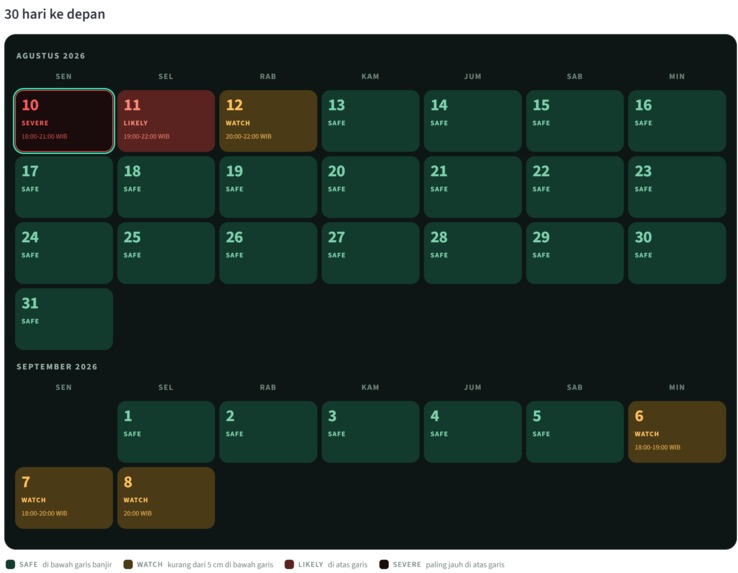
RobCast's 30-day calendar. Aug 9 to 11 flagged one to three days ahead
Inspiration
An official tidal flood warning for North Jakarta's coast was active while we were building this. Banjir rob affects places like Muara Angke, Pluit, Kamal Muara and Marunda, and the people who get affected the most are usually people who have things close to the ground, like warungs, fish drying racks, small workshops, storage and parked motorbikes.
What we found interesting was that a lot of this flooding is actually predictable. Tides are mainly caused by the moon and the sun, and since Jakarta is also sinking, these tidal changes can become enough to cause flooding. Because tides follow patterns, we can calculate them weeks in advance. The problem is that most people only receive a general warning for a whole district, usually around a week before. Telling someone to "be alert" is not really enough if they own a warung and need to know exactly which evening they should move their stock. So we realised the problem was not really that we could not predict the flood. The problem was turning the prediction into something people could actually use.
What it does
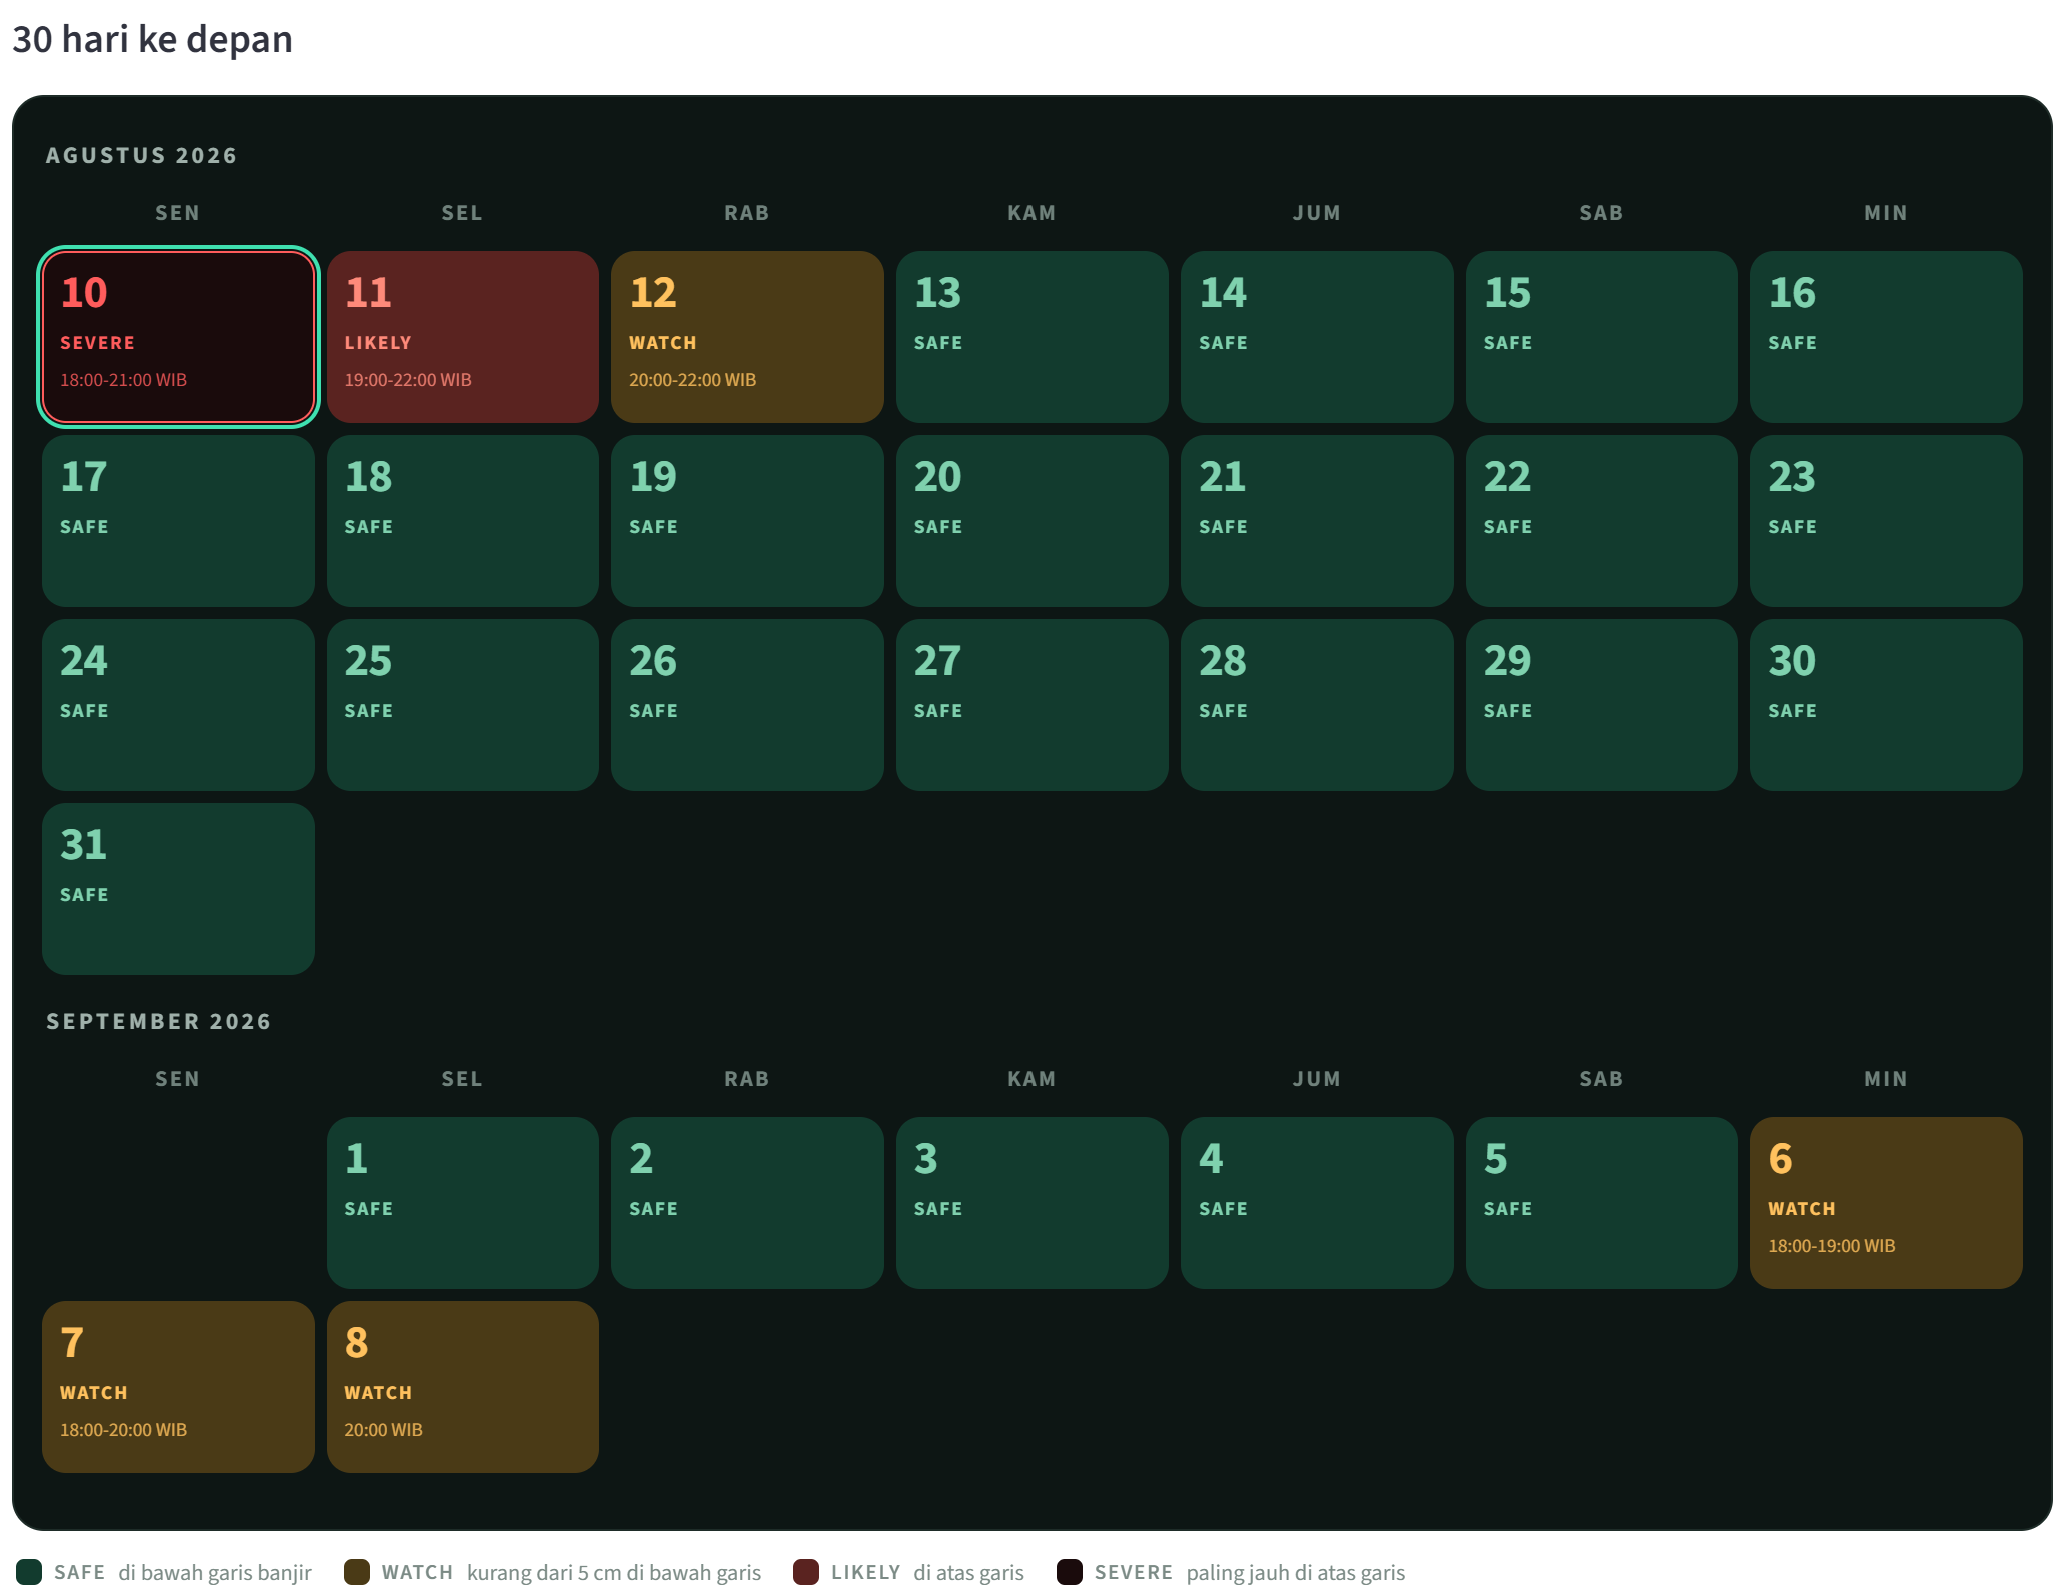
RobCast turns tide predictions into a simple 30-day flood calendar for North Jakarta's coast.
Calendar: every day for the next 30 days is marked as likely, watch or safe, together with the predicted peak flood hours in WIB Proof: we show the model's accuracy inside the app instead of just saying that it is accurate Areas: shows which coastal kampungs are expected to be affected first on a certain day
Right now, the model flags the evenings of 9, 10 and 11 August, mainly from 18:00 to 22:00.
How we built it
We use 14 months of water level data from the Kolinamil tide gauge at Jakarta Port, which is available through the IOC Sea Level Monitoring Facility. Before doing anything with the model, we clean the data. We only keep the radar sensor readings, remove unusual spikes using a rolling median filter and then convert the readings into hourly values.
After that, we fit 26 tidal constituents using least-squares regression. The frequencies of these tidal waves are already known because they come from astronomy. What changes depending on the location is mainly the amplitude and phase. We only use constituents that can actually be separated using a 14-month dataset based on the Rayleigh criterion. We also remove constituents where the amplitude is smaller than its own standard error, because at that point we cannot really say that the signal is reliable. We then extend these tidal waves 30 days into the future and flag every hour where the water level goes above our rob threshold. Finally, we use the previous 14 days of residuals to slightly adjust the forecast based on the current sea level.
We chose regression instead of machine learning on purpose. Tides already follow known physical cycles, so we did not think using a complicated black-box model was necessary. Least-squares regression gives us a clear answer, there is no training loop, and we can explain exactly where the prediction comes from. Since people might use this to decide whether they need to move stock or protect their property, we thought it was better to have a model that people could actually understand.
Stack: Python, pandas, NumPy, SciPy, Matplotlib, Streamlit, deployed on Streamlit Community Cloud.
Challenges we ran into
Our first idea actually failed on the first day. We originally wanted to find how much construction sites contributed to air pollution. We went through more than 10,000 hours of official station data, but then realised that most of the public data uses roughly 24-hour rolling averages. This meant short events like construction dust were basically being averaged out before we could even analyse them. So the idea was not really possible with the data we had. It was annoying to lose the first idea, but finding that out early meant we only lost one evening instead of spending the whole hackathon on something that would not work.
Switching to tide data also came with problems. The tide gauge publishes several sensor streams, and choosing the wrong one can affect the whole model without making it obvious that something is wrong. We also had an SSL certificate error which made the API look completely dead even though it was actually working. Another thing we had to be careful with was the difference between calibration and validation, because if you are not careful the results can look almost identical even though they mean different things.
The hardest problem was probably checking whether our own claims were actually fair. At first, we said the model predicted another flood cluster in early September. But when we checked it properly, those predictions were only around one or two centimetres above our threshold while the model error is around seven centimetres. So technically those predictions were inside the uncertainty of the model. We removed the claim before presenting it and kept the dates visible in the app as low-confidence predictions instead of just deleting them.
Accomplishments that we're proud of
We validated the model in four different ways, and we show all of the results inside the app:
5.6 cm error and 0.965 correlation on 144 hours of unseen gauge data 7.2 cm error, 0.967 correlation and +0.3 cm bias across the entire unseen month of June 2026 24 walk-forward tests, with 5.5 cm error one day ahead and 6.7 cm error seven days ahead an ablation test where our older version of the model gave 11.2 cm error using the exact same 14 months of data, which showed us that having more data alone does not automatically improve the result
Our data intentionally stops at noon on 8 August. This means the predictions for 9, 10 and 11 August are actual one to three day ahead forecasts and not something we calculated after already knowing what happened. These dates also fall inside the currently active official warning.
Another thing we are proud of is being clear about what the model can and cannot do. The alert threshold was calibrated using June, so the number of flood days in June should not be treated as a completely blind test. However, the error and correlation for June still come from unseen data. June 2026 was not part of the training data, while June 2025 was, which helps the model capture the yearly tidal cycle. The model also only predicts the astronomical part of the water level. Rainfall, storms and land subsidence can still make flooding worse than what we predict. There are also already systems that do parts of this problem. BMKG gives rob warnings, DSDA Jakarta has SINARJI for planning, and normal tide tables already exist. What we are trying to do differently is turn this into a simple 30-day calendar that households can understand while also showing how accurate the predictions actually are.
AI disclosure: the prediction engine itself uses least-squares harmonic regression. It does not use machine learning or an LLM. AI assistants were used for coding support and planning. The methods, data and validation were done by us and are explained in EXPLAINER.md in the repository.
What we learned
One of the biggest things we learned was to check the data before getting too attached to an idea. We learned that from our first air pollution idea, and it probably saved most of the hackathon for us.
We also learned that in tide modelling, there are some limits you cannot really solve just by trying harder. If two tidal constituents are too close together for the length of the dataset to properly separate them, the model can split their effect depending on noise. What makes this difficult is that nothing necessarily looks wrong. The model still runs, the residuals can still look normal and the values can still look believable. That is why checking the standard error became really important for us.
The other thing we learned was that it is better to find problems in your own work before someone else does. Realising that our September prediction was too uncertain and removing that claim was probably one of the most useful things we did during the project.
What's next for RobCast Automatically refit the model every day so the calendar always shows a full 30 days ahead using the newest data Add weather data such as rainfall and storm surge on top of the tide prediction, because this is probably the biggest source of error that is still missing Expand it to other tide gauges around Indonesia, since the main model does not depend on one specific station Add elevation data for each kampung so we can estimate how deep the flooding could be instead of only saying whether there is a risk Send warnings through WhatsApp and RT/RW groups, because the prediction is more useful if it actually reaches people instead of expecting them to keep checking a separate website


Log in or sign up for Devpost to join the conversation.