-
-
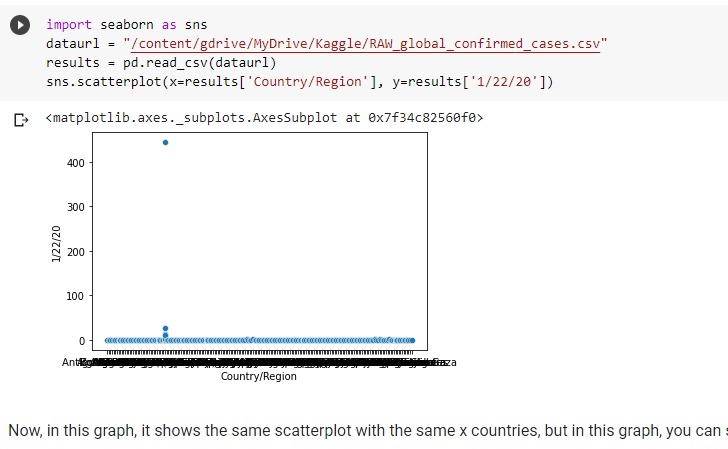
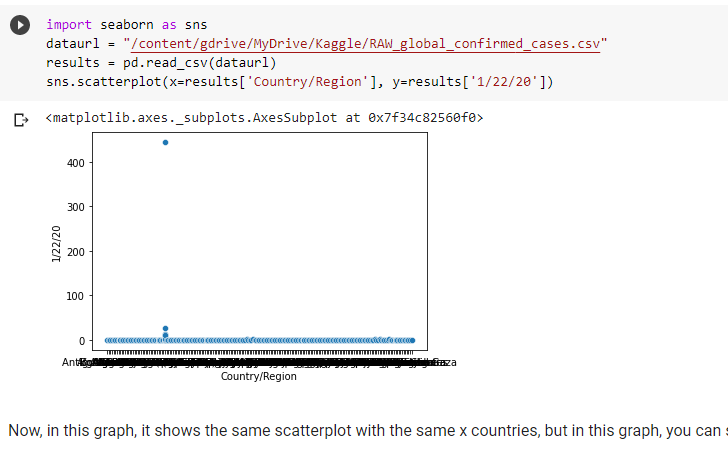
Graph 1 - data for cases on 1/22/20 scatterplot
-
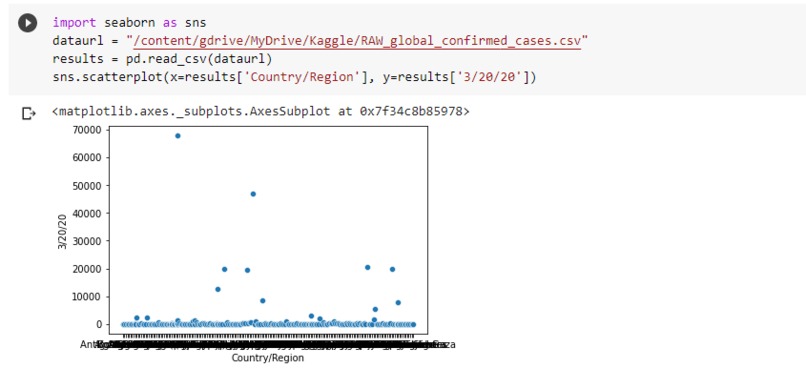
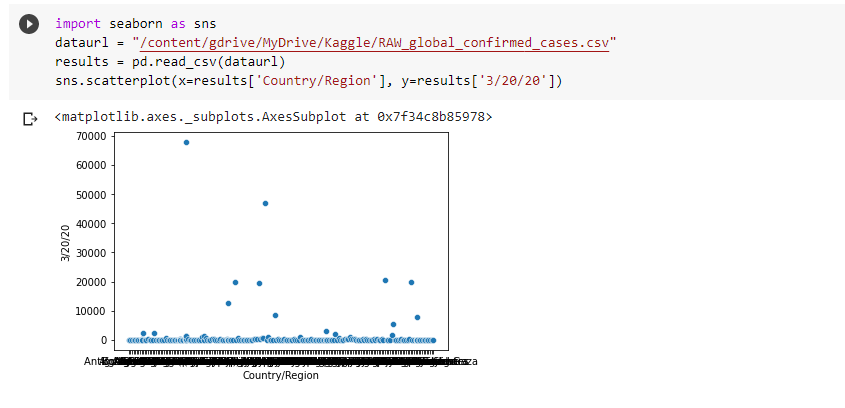
Graph 2 - data for cases on 3/20/20 scatterplot
-
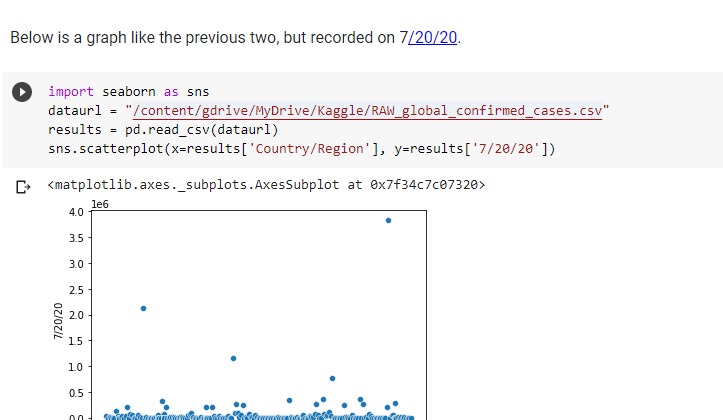
Graph 3 - data for cases on 7/20/20 scatterplot
-
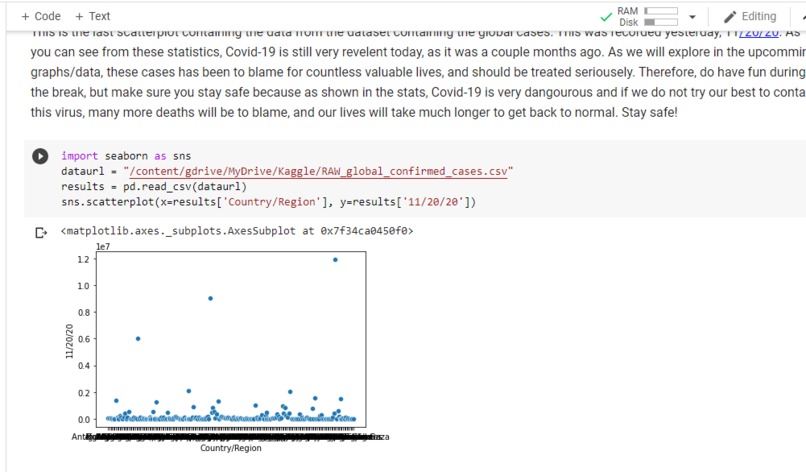
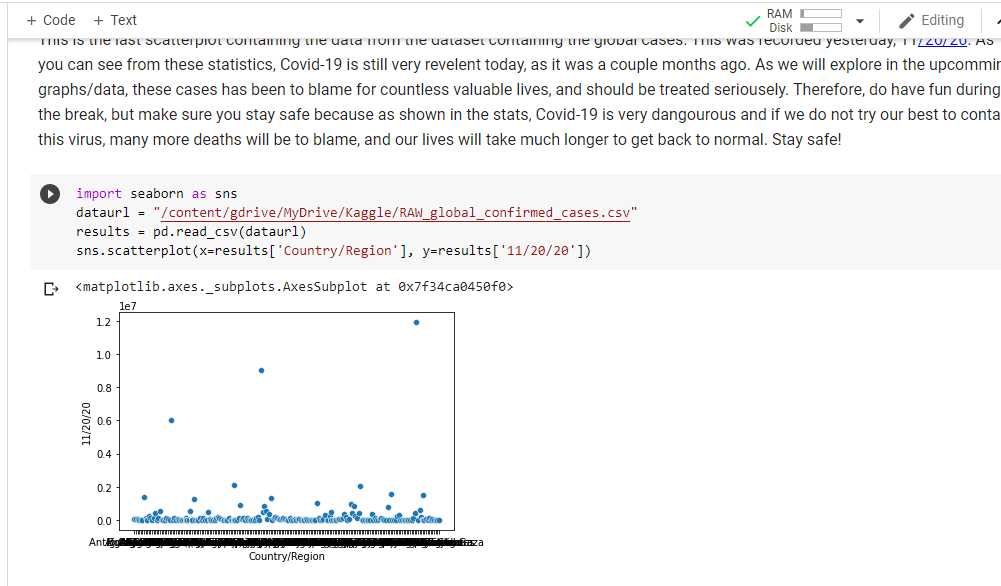
Graph 4 - data for cases on 11/20/20 (yesterday) scatterplot
-
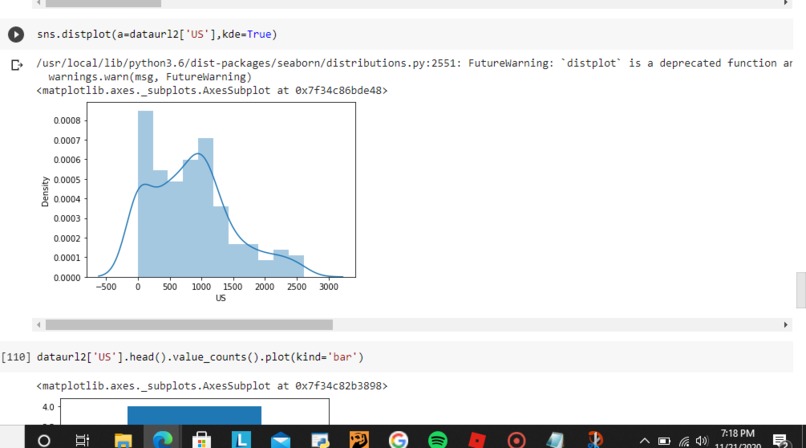
graph 5 - graphs of Covid Deaths distplot
-
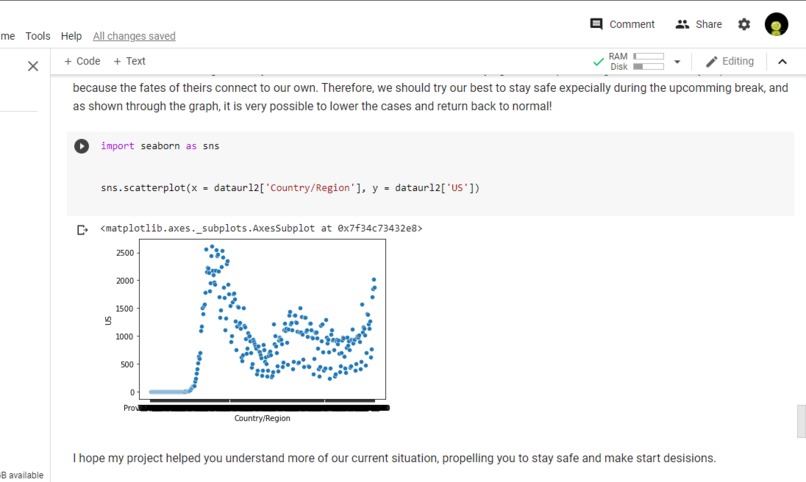
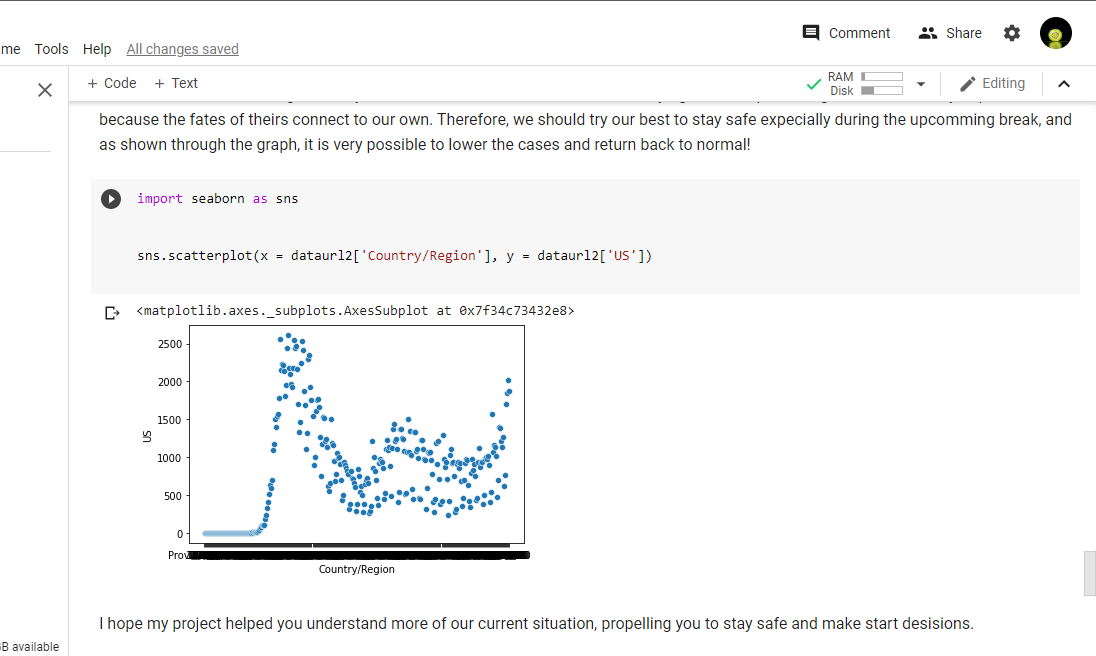
Graph 6 - graph of Covid deaths; "wave" scatterplot


Inspiration
In this notebook, I used Python's amazing data science abilities to visualize and analyze the data from Covid-19 datasets uploaded from Kaggle. Especially during the Thanksgiving season, many Americans are most likely to travel to visit families and friends. My goal for this project was to help users visualize data and help them to see and understand the dangers or Covid-19, so that they are more aware of the current situation and help them make better decisions. Hopefully, this notebook will help inform the public so that they can make better decisions and help them understand more of our current situation from a person just like them.
What it does
This program uses John's Hopkin's data from Kaggle.com and python libraries such as Numpy, Pandas, and Matplotlib to create cool graphs so that users can visualize the information in a different perspective.
How I built it
I built it using Google Collab, Python libraries, Kaggle's John's Hopkin's Covid-19 dataset [https://www.kaggle.com/antgoldbloom/covid19-data-from-john-hopkins-university], and Python.
Challenges I ran into
I ran into some challenges along the way. For example, a challenge I had was that the files weren't downloading as it should have. After some Stack Overflow, I was able to solve it. Another challenge I had was that some graphs were not as good as others, so after some researching, I found graphs that conveyed the data well.
Accomplishments that I'm proud of
I am really proud of how I was able to see this data in a different perspective. Instead of just listening some guy from CNN ramble on about all these graphs and the Covid-19 waves, I was able to experience and create it directly/hands-on. I was able to see the data instead of just hearing the stuff.
What I learned
I've learned the power of data, and a lot more types of graphs that I could use in any future projects. I've learned how very relevant and serious Covid-19 should be taken, even today where it seems like no one cares and that it is almost over.
What's next for Roana-19 data
Well, I am thinking about gathering more information, for example from my parents who said they had information from the NIH related to Covid. I wish to continue this hunt for information and influence others to stay safe and careful. And I wish for this project to help me learn and reach my Python data-science goals.
Built With
- google-colab
- kaggle
- python
- python-libraries


Log in or sign up for Devpost to join the conversation.