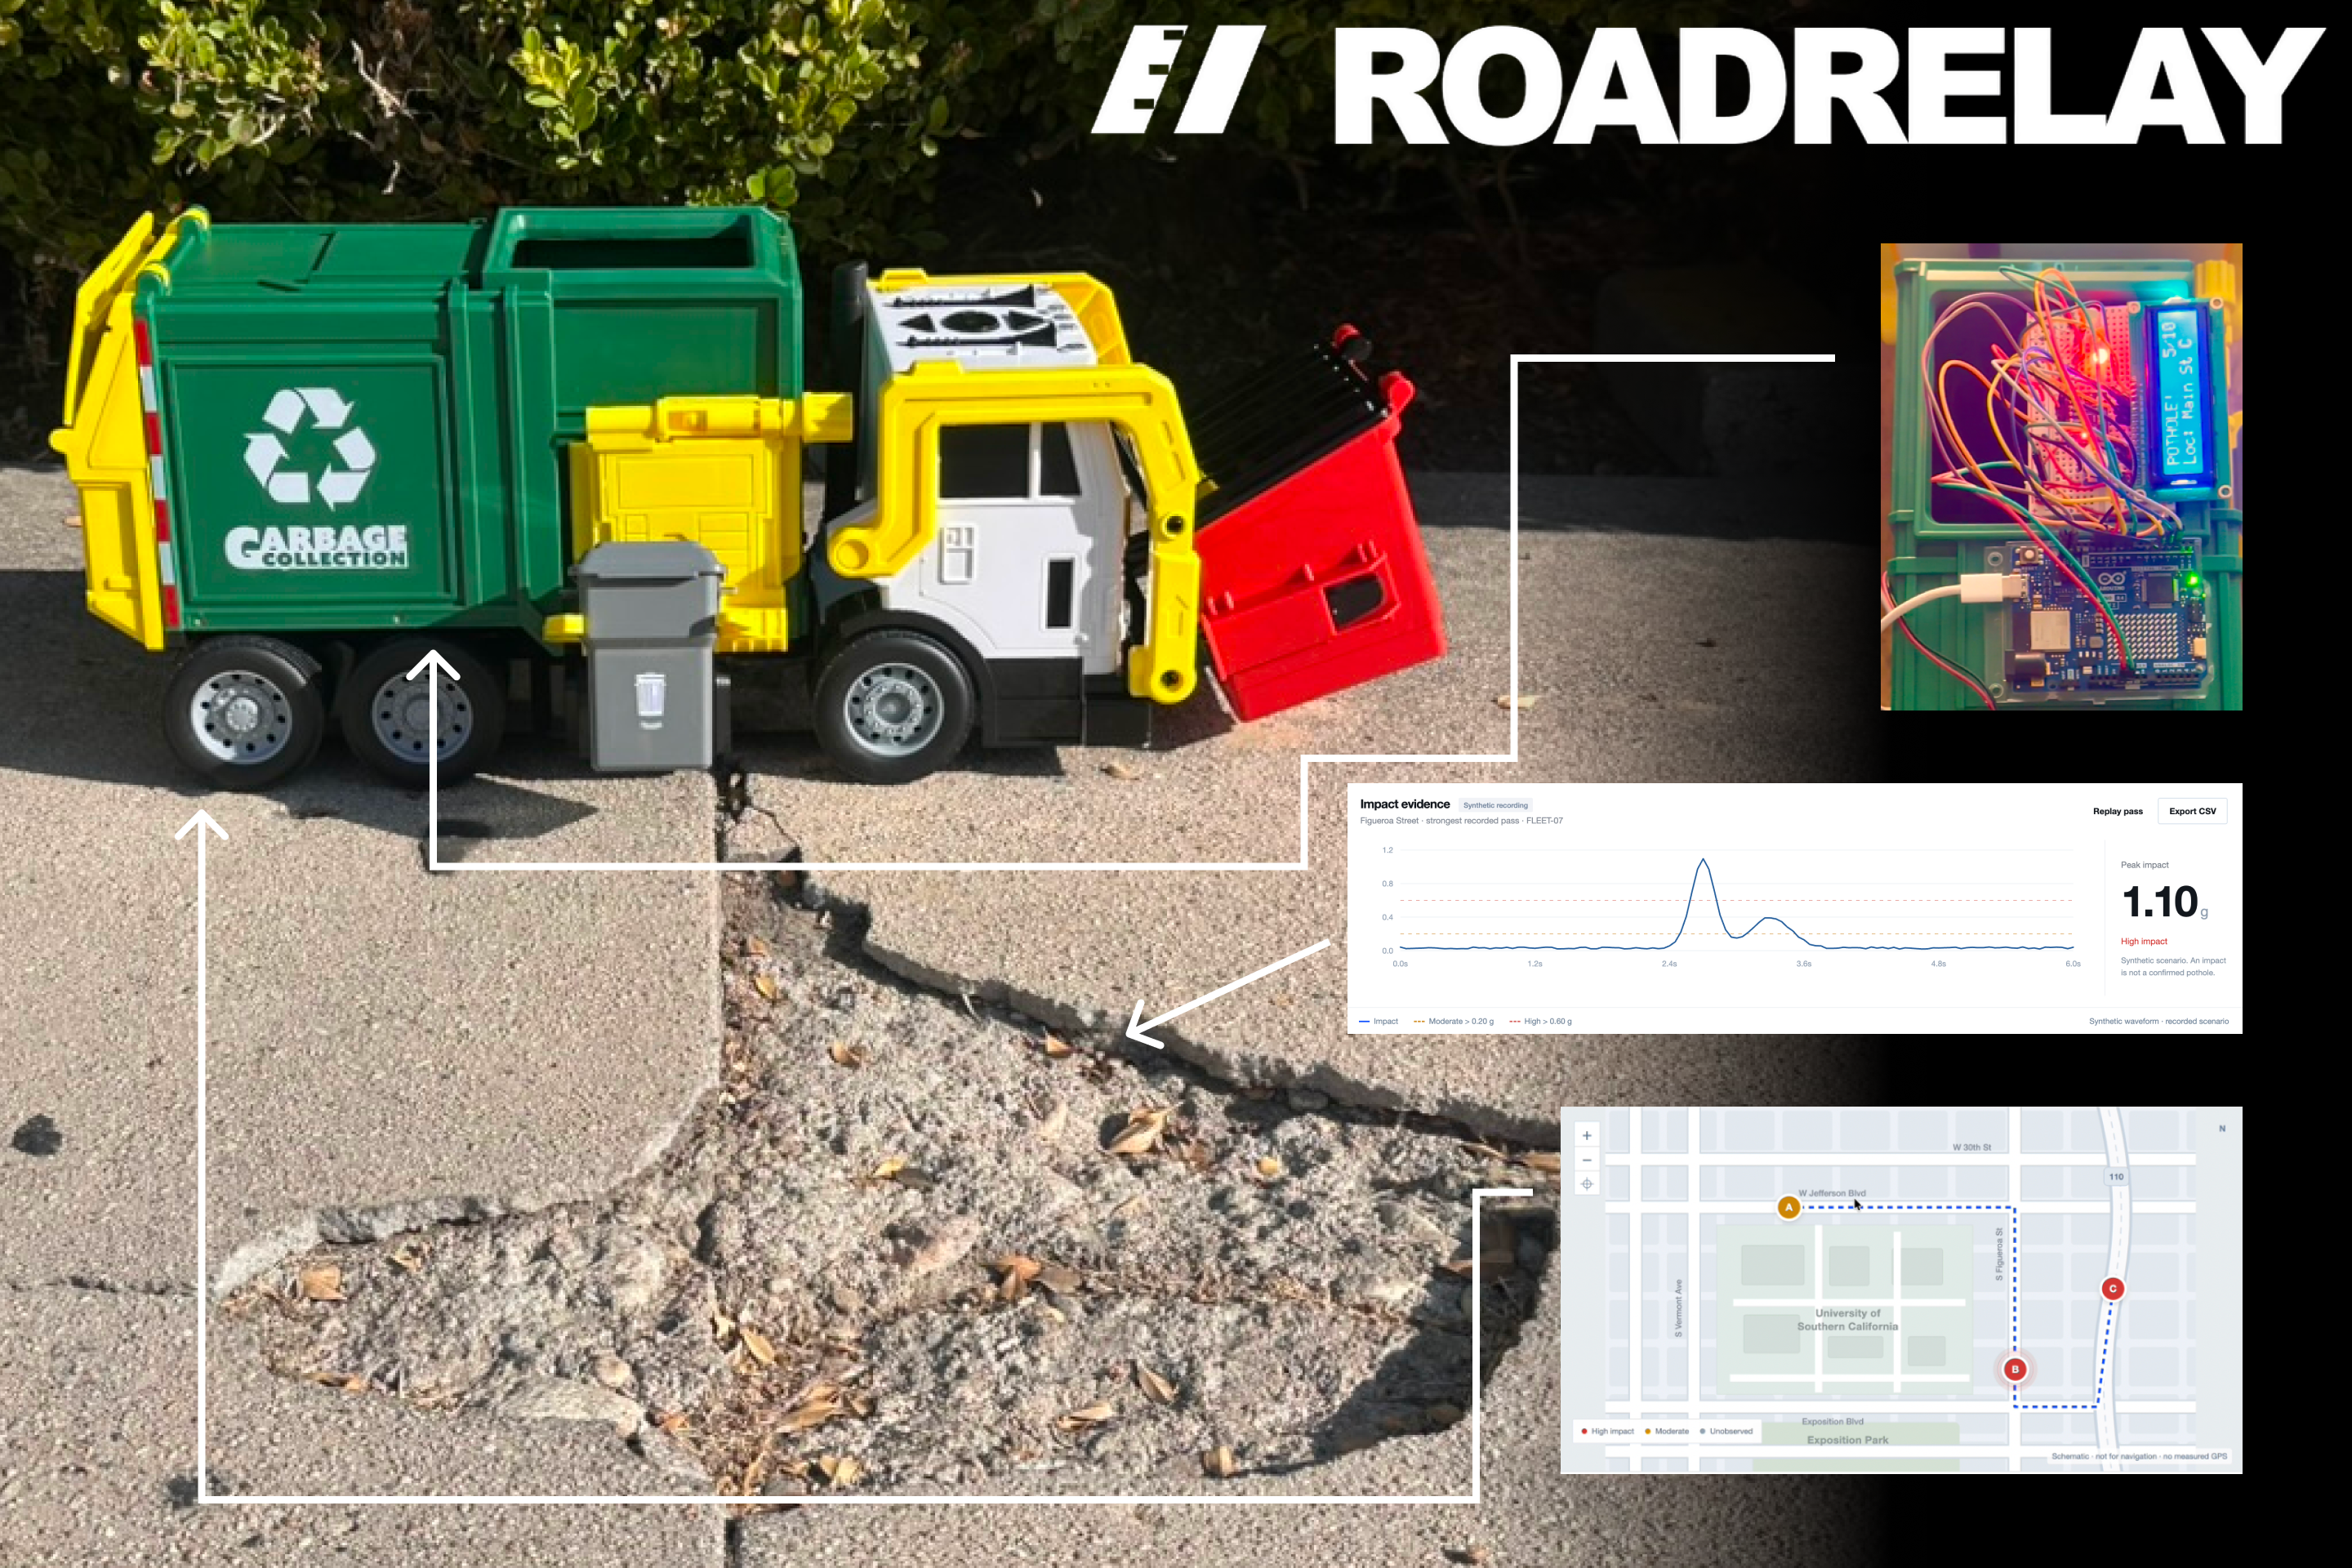
RoadRelay
Every route. A road worth knowing.
Turn routine fleet journeys into evidence for the next road inspection.
Explore RoadRelay · Try the interactive demo · Explore the code and technical documentation
Inspiration
A campus shuttle, a maintenance van, and a municipal service truck may travel the same road every day. Each journey is an opportunity to notice that something has changed. Our starting question was simple: could the vehicles already doing useful work also help us decide where to inspect next?
That question became RoadRelay, our response to Origin Weekend's Prompt D: “How can we detect infrastructure damage and failures before they become expensive, and rapidly prioritize recovery when they occur?”
The prompt spans many kinds of infrastructure and many possible technologies. We chose a specific problem that we could build and demonstrate: collecting road-impact observations and carrying them through a maintenance review workflow. The ambition is to make emerging road problems easier to notice and investigate through everyday operations, with disaster recovery as a possible later application.
Los Angeles provided a concrete setting. In its January 28, 2026 budget overview, StreetsLA reported a reduction of 406 authorized positions, or 26%, over the preceding two fiscal years. The same presentation listed average pothole repair time as five days in FY 2024–25 and an anticipated seven days in FY 2025–26. These are published agency figures and projections, not RoadRelay results. They helped frame a practical question: how can limited inspection capacity be directed toward useful, reviewable observations? Source: StreetsLA budget overview, pages 3 and 5
Detection is only part of that problem. Someone still needs to review the evidence, identify the responsible asset owner, inspect the location, authorize work, and check what happened afterward. RoadRelay is designed around that entire sequence.
What it does
RoadRelay combines a physical sensing prototype with a dashboard for reviewing suspected road anomalies.
The prototype uses an Arduino UNO R4 WiFi, an MPU6050 accelerometer module, a 16×2 LCD, and green, yellow, and red LEDs. In the toy-car demonstration, the sensor measures acceleration while the car moves across a controlled surface. The Arduino calculates an impact signal, displays it locally, and transmits readings to a dashboard running on the same local network.
The dashboard lets an operator record a pass at a manually selected demonstration location, inspect the waveform, and review an inspection candidate when the impact exceeds the demonstration threshold. Further abnormal passes can contribute evidence to the same open candidate.
The product meanings of the indicators are deliberately specific:
- Green: no above-threshold anomaly was detected during this pass.
- Yellow: a moderate impact was observed and needs context.
- Red: a high impact was observed; a suspected road anomaly needs inspection.
A red light does not establish that a pothole exists. A green light does not certify that a road is safe. The original LCD labels remain in the prototype firmware; the dashboard explains the more careful interpretation of those signals.
From a signal to an accountable next step
The workflow is:
Observe → record → review → assign an inspection → confirm or dismiss → document repair → recheck.
The coordinator can see the peak impact, linked abnormal passes, distinct reporting device IDs, waveform evidence, status, and notes. They can assign a demonstration inspection team and record findings. A confirmed issue can proceed to a repair-completed state and then a follow-up review.
The roles have different responsibilities. Drivers would continue their authorized routes. Fleet operators would approve installations and vehicle access. Maintenance coordinators would review evidence and organize inspections. Asset owners would retain authority over priorities and spending. Inspectors and repair crews would supply the field findings that a sensor cannot provide.
Assignments in this prototype are local records. They do not contact a government agency, notify a contractor, or issue a real work order.
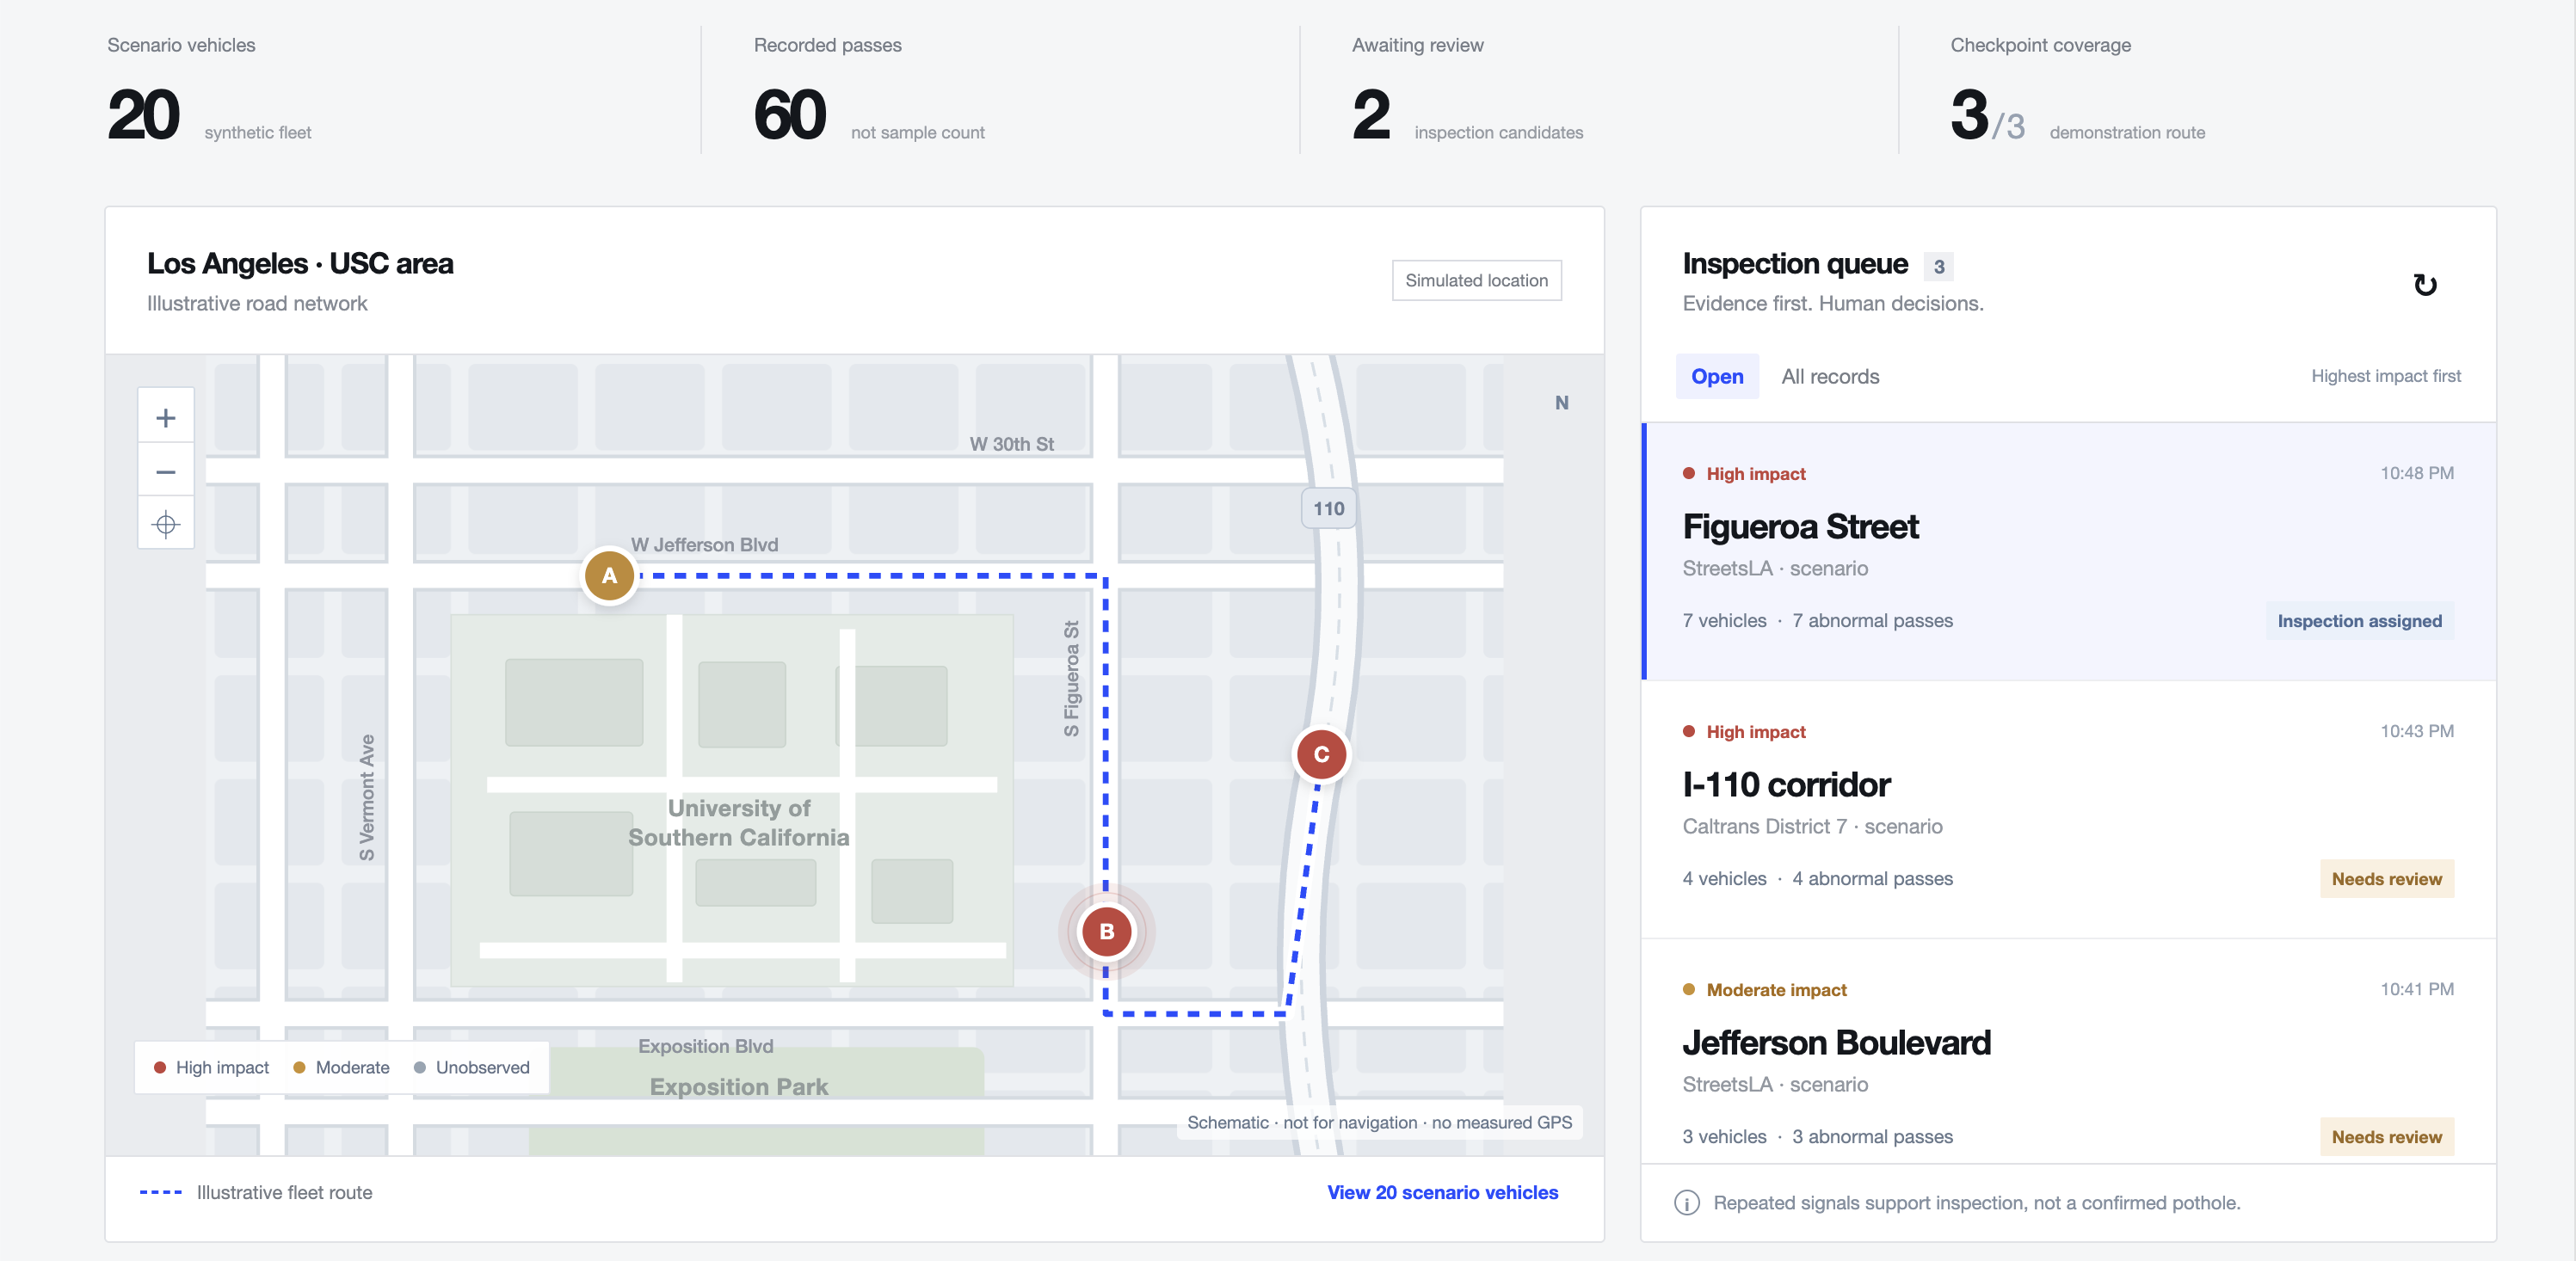
The fleet screenshot shows synthetic observations on an illustrative map. It does not report actual defects on the pictured roads.
How we built it
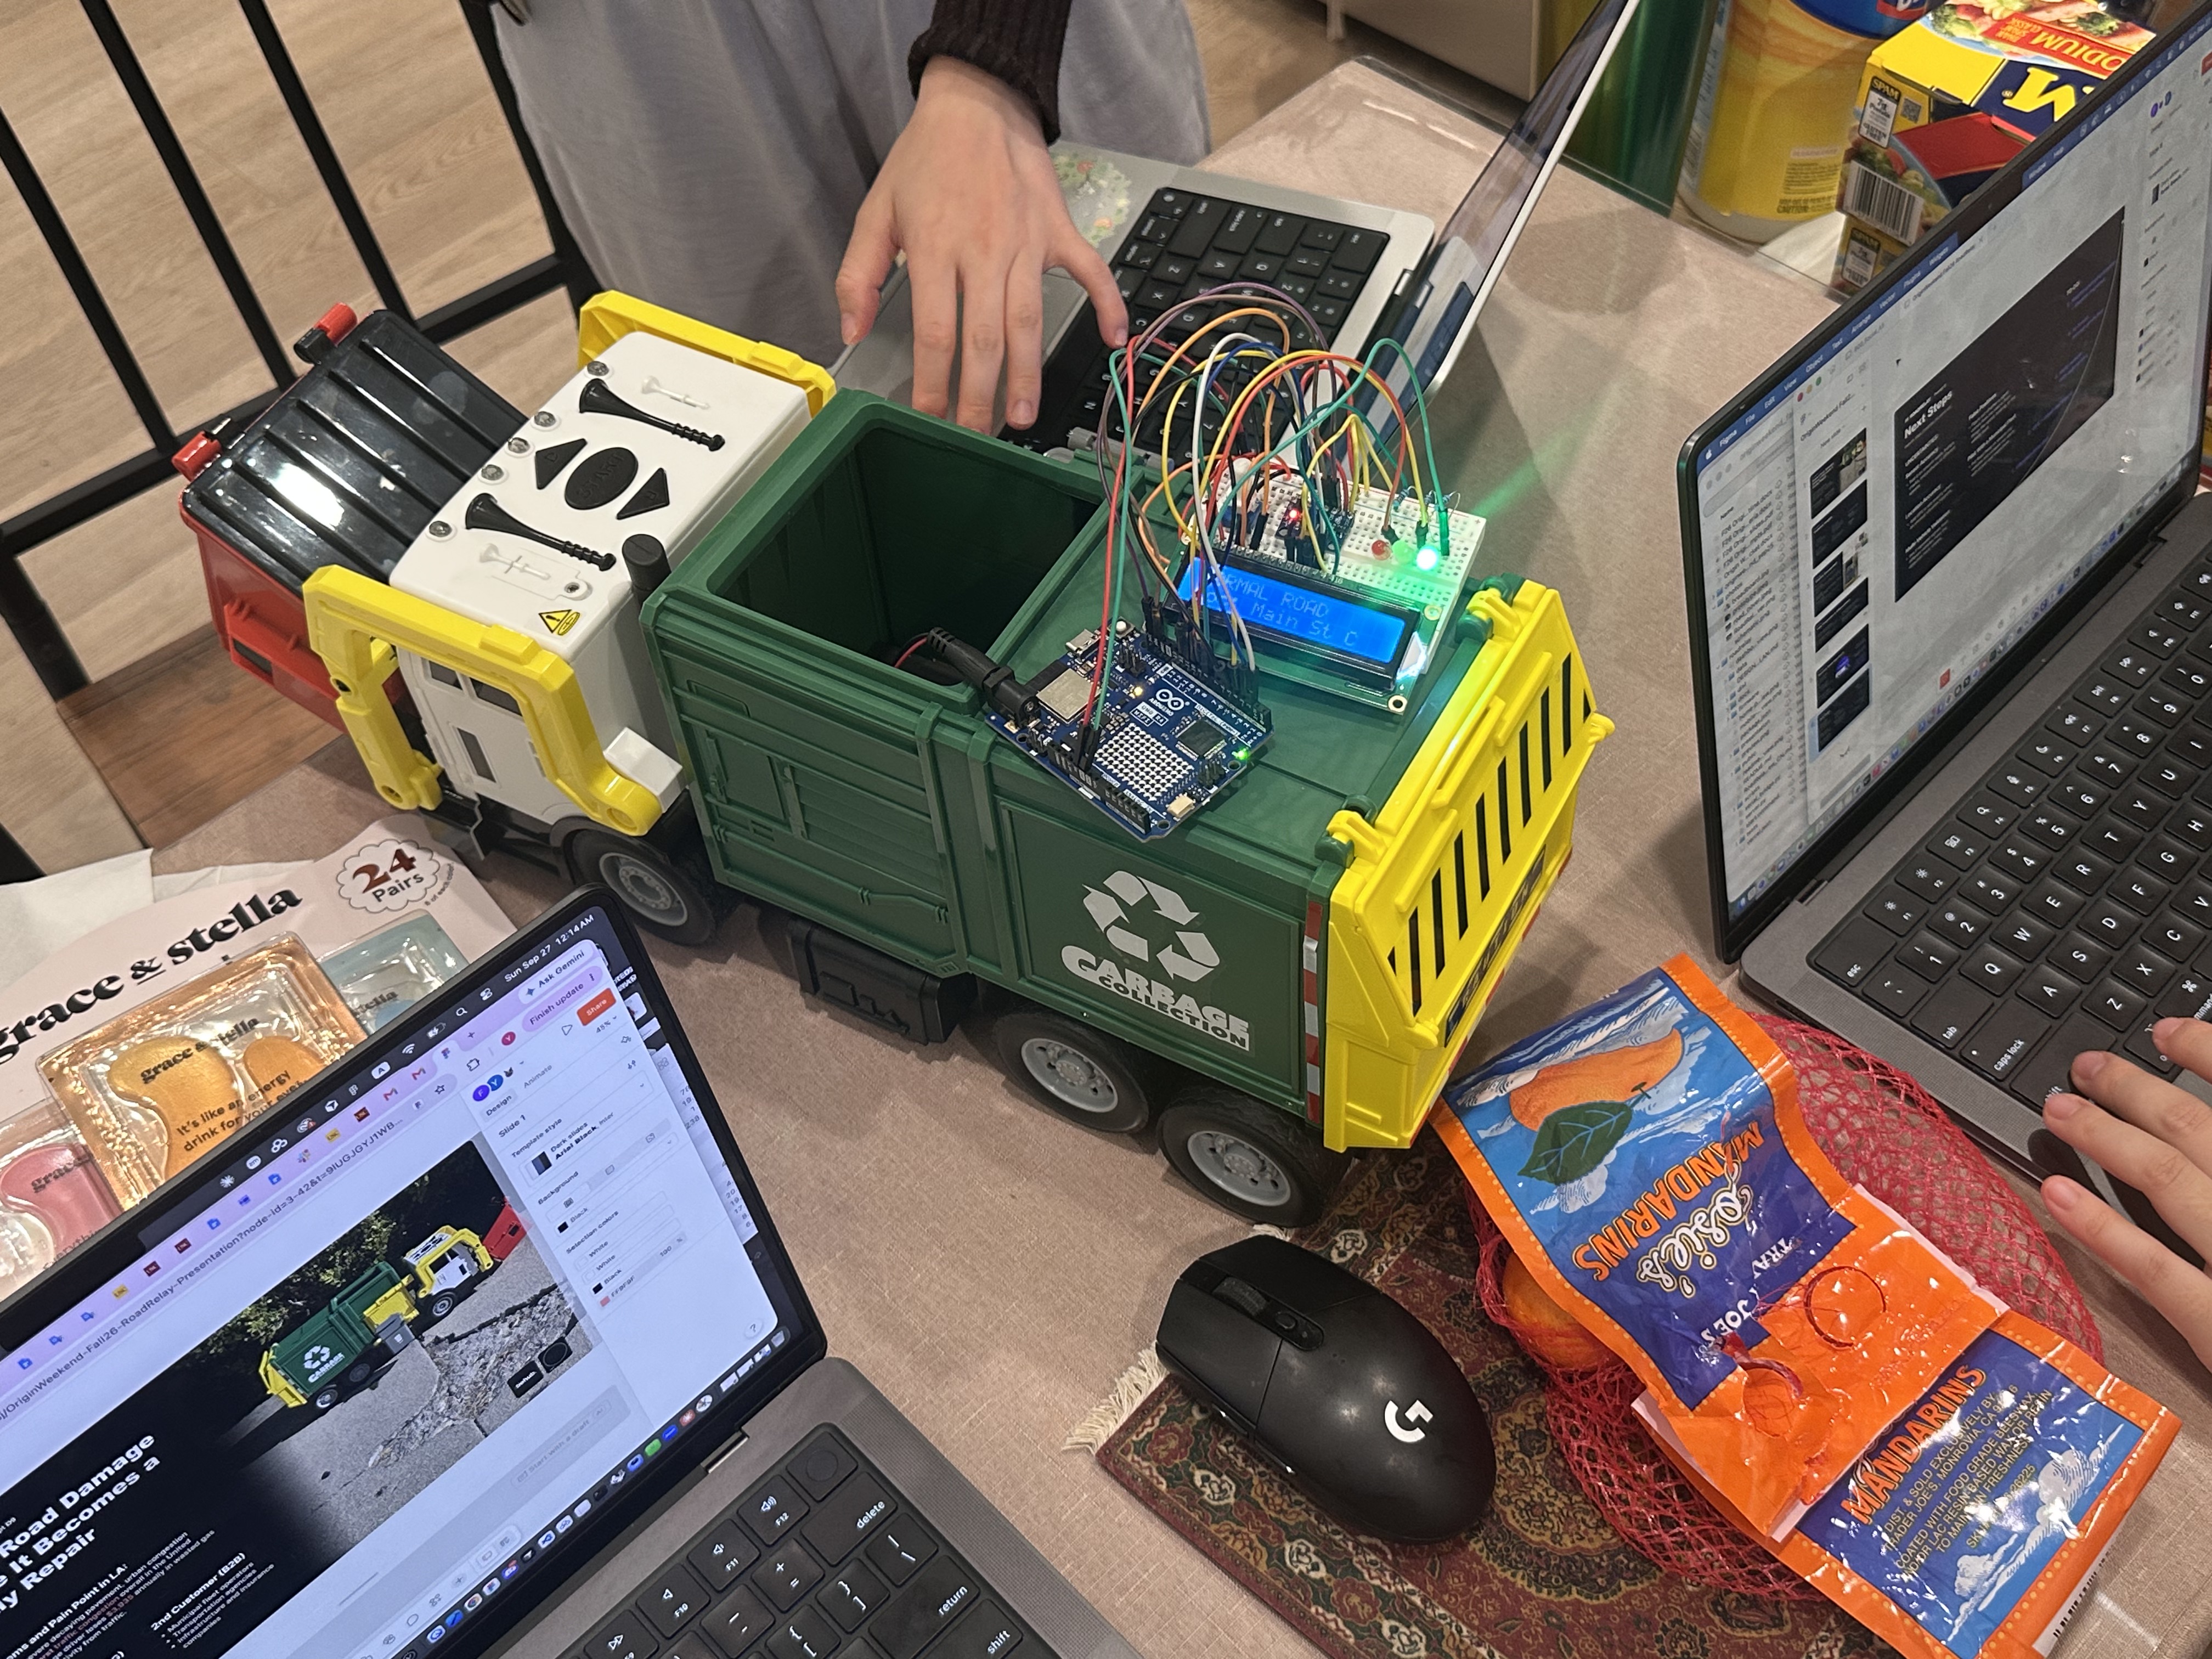
Building RoadRelay together. Our work-in-progress setup brings the sensing hardware onto a toy garbage truck, making the everyday-fleet concept tangible. The Arduino, sensor, LCD, and LEDs support a controlled demonstration while we develop the software and presentation alongside it.
1. Make the physical signal visible
We started with the sensing loop: read the accelerometer, calculate an impact value, and make the result visible through the LEDs and LCD. This gave the project a physical demonstration that could be understood without looking at a software console.
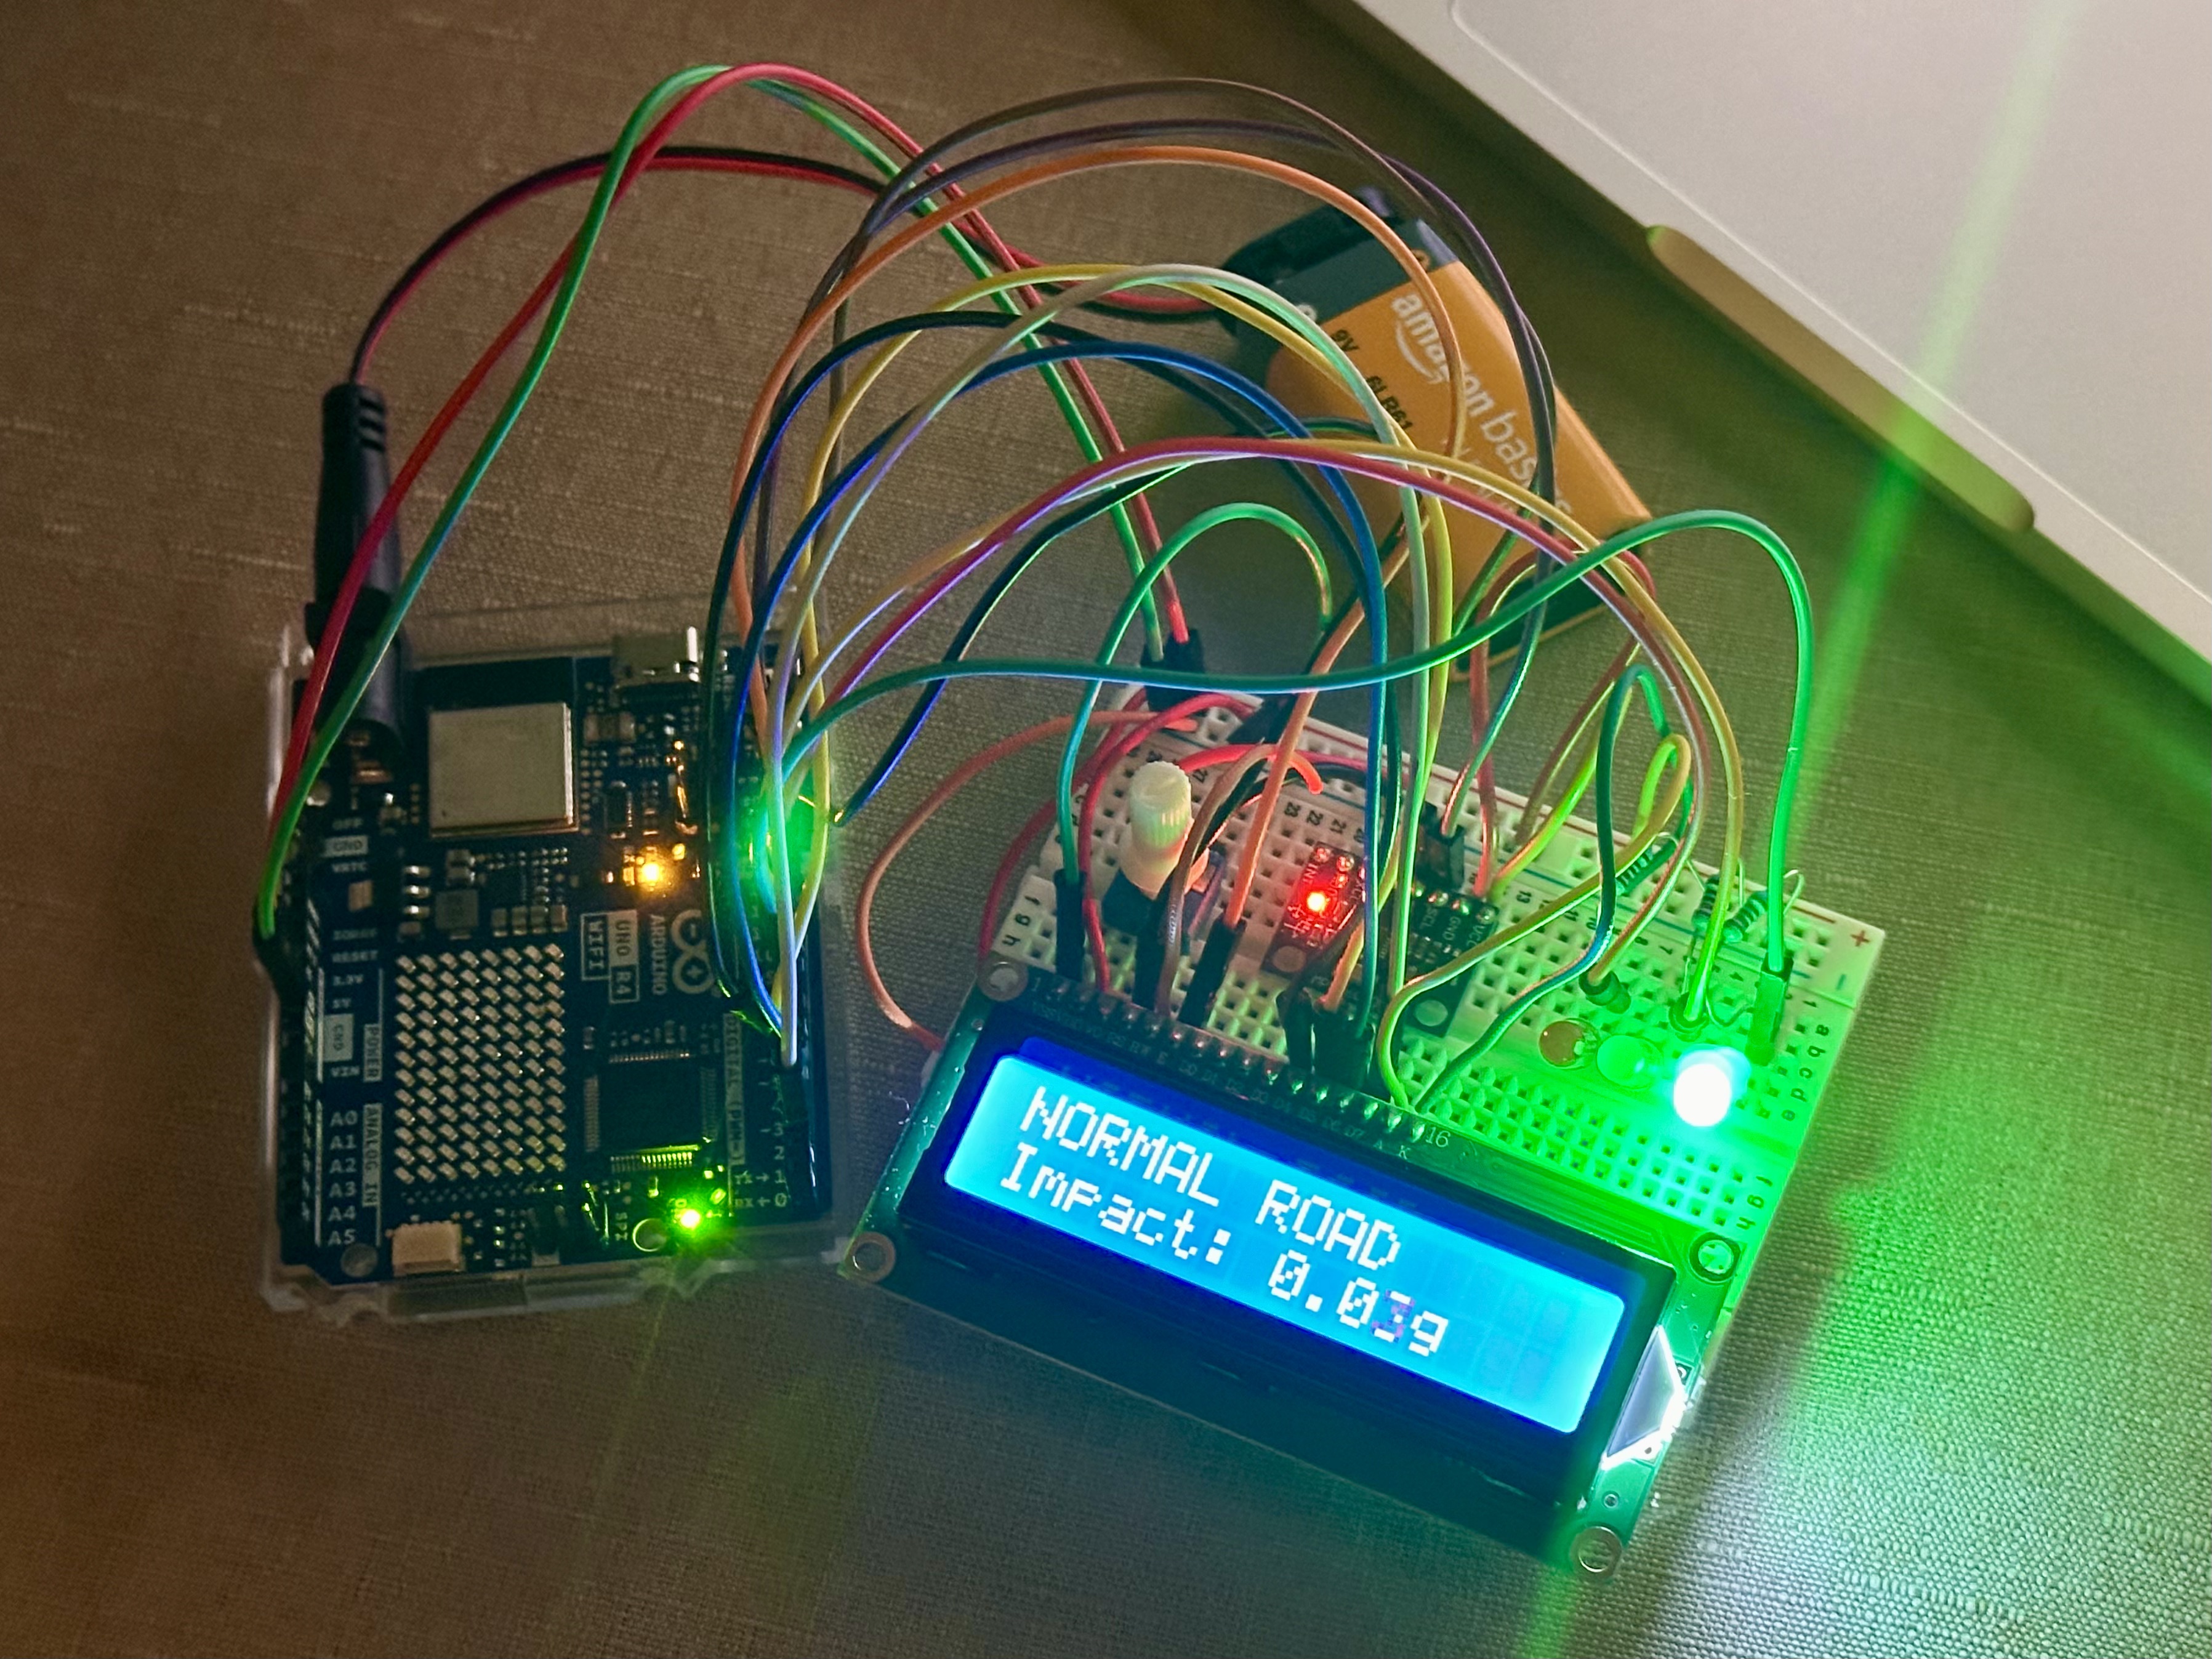
The assembled bench prototype. The display shows an approximately 0.03 g impact reading. The photograph documents the build, not a road-safety assessment or a field-validation result.
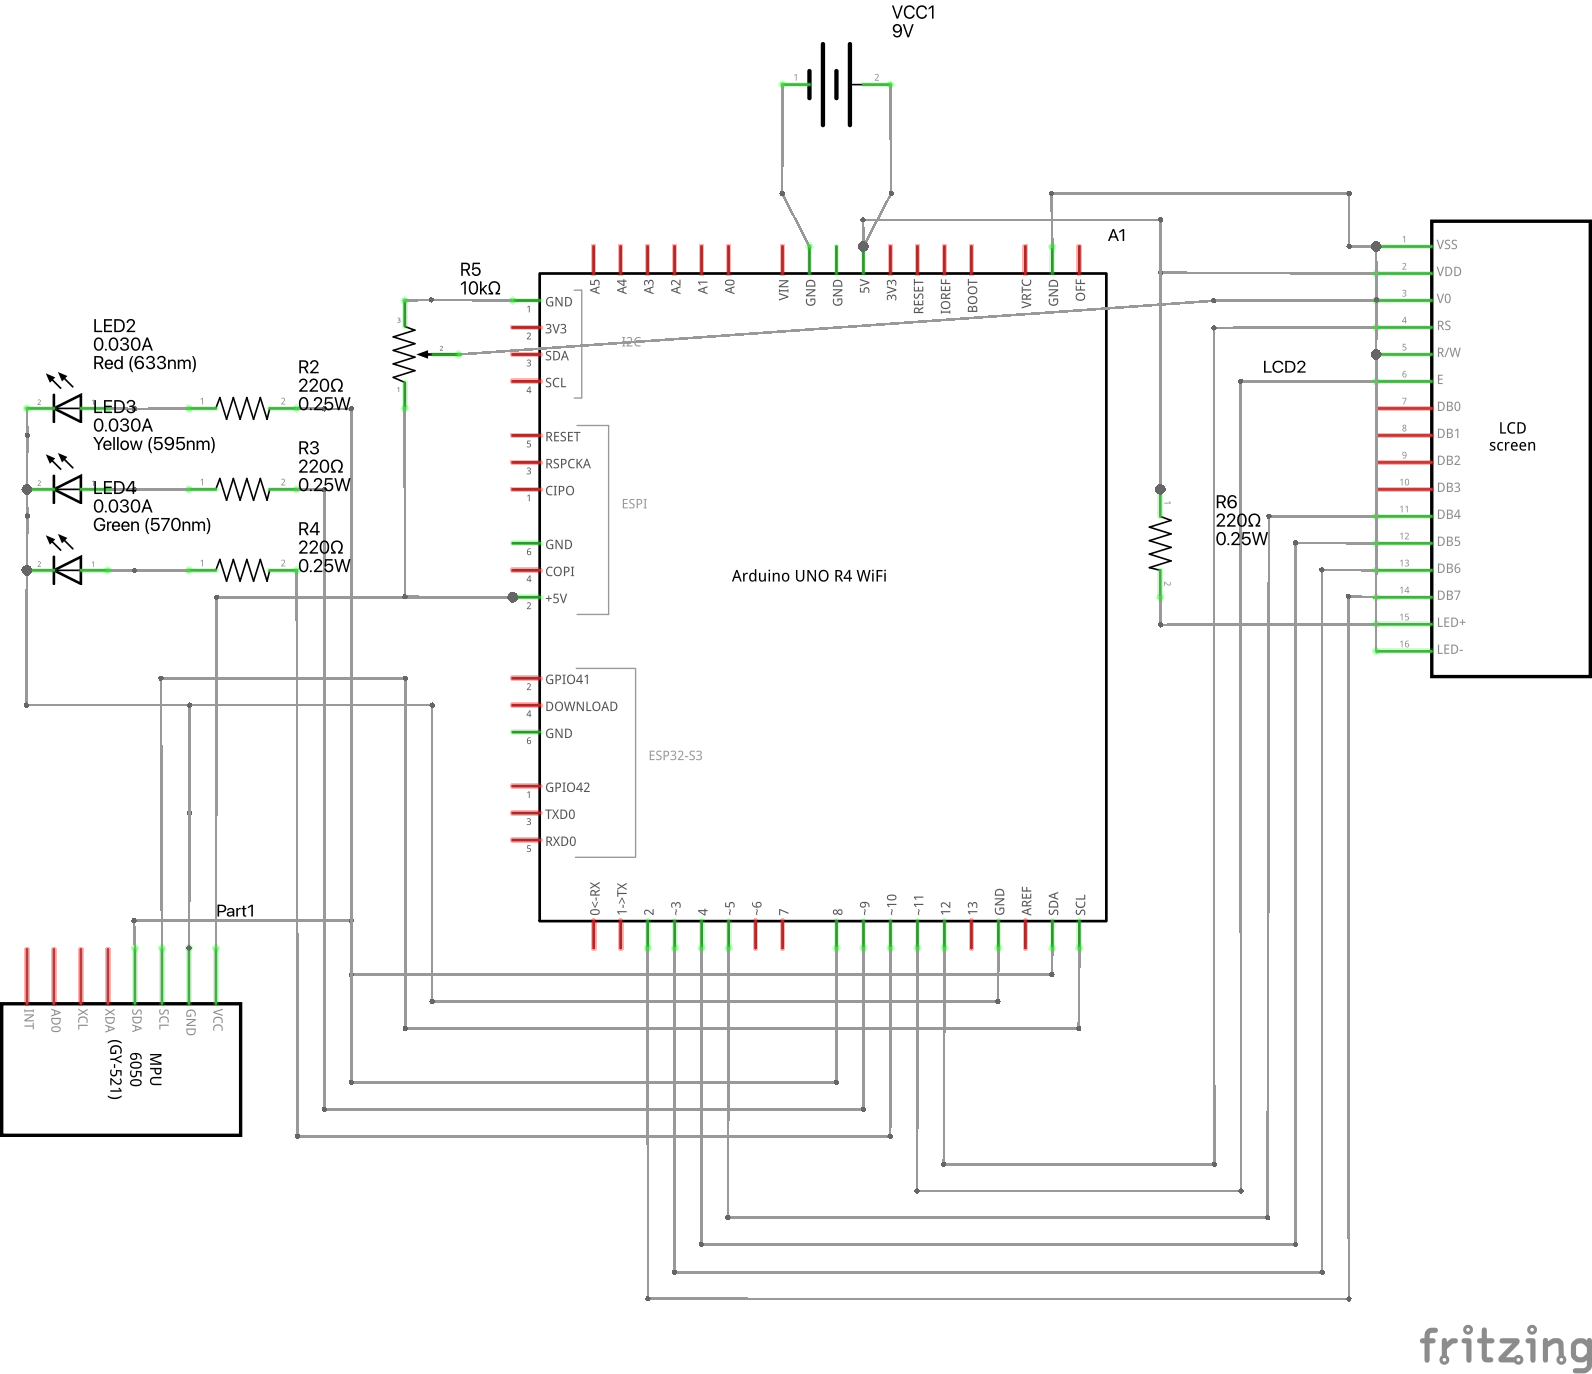
Our circuit schematic documents the hardware connections: I2C for the MPU6050, a four-bit parallel interface for the LCD, and separate digital outputs for the three status LEDs. The potentiometer controls LCD contrast.
Draft wiring correction: the drawing shows a 9 V battery connected to the board's 5 V pin. Do not reproduce that connection. Use USB-C power for the bench demo, or a suitable external supply through the board's designated VIN or barrel-jack input with correct polarity. This original schematic is a design reference, not a verified assembly guide; see the hardware documentation for the firmware pin mapping and power notes.
The MPU6050 is configured for its ±8 g accelerometer range. The firmware converts the signed raw readings into acceleration expressed in g:
$$ a_x = \frac{r_x}{4096}, \qquad a_y = \frac{r_y}{4096}, \qquad a_z = \frac{r_z}{4096} $$
The implemented impact signal is the absolute deviation of acceleration magnitude from 1 g:
$$ I_t = \left|\sqrt{a_{x,t}^{2}+a_{y,t}^{2}+a_{z,t}^{2}}-1\right| $$
This is a transparent starting point for detecting impacts. It reduces dependence on static sensor orientation, but it does not isolate vertical road motion or fully remove gravity during vehicle movement. Braking, turning, suspension, mounting vibration, and ordinary road features can also influence the signal.
The instantaneous demonstration classification is:
$$ c_t = \begin{cases} 0 & I_t \leq 0.20 \ 1 & 0.20 < I_t \leq 0.60 \ 2 & I_t > 0.60 \end{cases} $$
The three classes correspond to below-threshold, moderate, and high impact. These thresholds are prototype settings, not validated road-condition standards. They do not measure pothole depth or produce a calibrated probability of damage.
The LEDs hold an elevated state for approximately 1.5 seconds after the relevant impact so that a person can see a short event. The dashboard uses the measured impact values to create evidence; it does not count the held red light as a sequence of separate road defects.
2. Connect the device to the local dashboard
The WiFi firmware batches 12 samples per UDP packet. Packets include the device ID, boot identifier, sequence number, and sample timestamps, along with impact values and LED states. A Python receiver checks the payload, tracks sequence gaps, and rejects duplicate or out-of-order batches within a device session. A USB serial bridge provides a local fallback.
SQLite stores measurements, recorded passes, inspection candidates, evidence links, and audit entries. A local HTTP API serves the browser dashboard, which is built with HTML, CSS, and JavaScript. The interface includes live waveforms, recording controls, an inspection queue, detail panels, and CSV export.
The receiver preserves relative sample timing inside a batch by estimating each sample's host-aligned timestamp:
$$ \hat{t} = a - \frac{b-s}{1000} $$
Here, a is the packet arrival time in host seconds, b is the last device timestamp in the batch in milliseconds, and s is the current sample's device timestamp in milliseconds. In plain language: estimated sample time = packet arrival time − (last device timestamp − current device timestamp) / 1000. This preserves the spacing between samples within the batch; it does not eliminate network delay or synchronize device and host clocks.
The firmware includes a 10 ms loop delay, but reading the sensor, updating the display, and transmitting data also take time. We therefore do not claim a guaranteed 100 Hz sampling rate or a measured end-to-end latency.
3. Turn measurements into meaningful evidence
One important design decision was to distinguish samples, passes, and devices.
A single bump can produce many above-threshold samples. Counting each sample as a new report would make the evidence look much stronger than it is. RoadRelay groups measurements within an explicitly recorded pass and links that pass to an inspection candidate without repeatedly adding the same pass.
For each candidate, the useful quantities are:
$$ P = \max_i I_i, \qquad A = \text{number of linked abnormal passes}, \qquad V = \text{number of distinct reporting device IDs} $$
For example, forty above-threshold samples from one traversal are still one abnormal pass. Three abnormal passes from the same device are three passes from one device, not three independent vehicles.
The local queue puts open records first and then orders them by peak impact. Repeated passes and distinct devices are visible evidence for the reviewer. They are not currently inputs to a learned risk score.
4. Separate real sensing from a public fleet demonstration
The project has two distinct environments:
- Local hardware application: real sensor readings, a Python receiver, SQLite storage, and a live prototype dashboard.
- Public Vercel website: a company introduction and an interactive dashboard using clearly labeled synthetic data, with demonstration edits stored in the browser.
The public website does not receive telemetry from the Arduino or expose our local receiver computer. This lets visitors explore the product without needing our hardware or network connection.
The synthetic scenario contains 20 vehicle IDs, 60 passes, and three demonstration locations. The local seed generates 121 samples per pass:
$$ 20 \times 3 \times 121 = 7{,}260 \text{ synthetic samples} $$
The hosted demo carries three representative strongest-pass waveforms, totaling 363 evidence samples, along with summary records. Its scenario includes 14 abnormal passes. These are constructed demonstration data, not measured road conditions or model-performance results.
5. Add a bounded role for AI
We added an optional, server-side AI brief integration for the local application. When configured and explicitly requested, it can summarize a selected observation into Evidence, Recommended next step, and Unknowns.
Its role is to help a coordinator read an existing record. It does not classify raw sensor data, confirm a pothole, invent a GPS location, assign a crew, or authorize a repair. A human remains responsible for the next action.
The public demo and an unconfigured local installation provide a separate rule-based summary, clearly labeled as such. A working template is not presented as an AI result, and the presence of an AI integration is not evidence that its output quality has been validated.
Challenges we ran into
An impact can have many causes
The most consequential challenge was deciding what the system could honestly infer. A pothole, a speed bump, a pavement joint, and a movement of the sensor itself can all produce acceleration changes.
That led us to frame the output as an inspection candidate. The waveform and repeat observations help a person review the event; field inspection establishes what actually happened. A future classifier will require labeled examples of both damage and ordinary road features across vehicles, speeds, and mounting conditions.
A working sensor is not automatically a connected system
Switching to a phone hotspot exposed a practical connectivity problem: the board and computer need compatible network access, and the receiver address depends on the computer's current network. A sensor can continue lighting its LEDs while the dashboard has no fresh readings.
This made device freshness, connection guidance, and a USB fallback important parts of the demonstration. The current network path remains a local prototype; production would require secure device provisioning, encrypted transport, buffering, and more resilient reconnection behavior.
A waveform does not know where the vehicle is
The toy car does not have measured GPS. We used manually selected checkpoints to demonstrate the association between a pass and a location.
Those checkpoints do not mean roads can only be sensed at three special places. They substitute for location input in this demonstration. A field version would require GNSS, speed, road-segment matching, and location uncertainty. Parallel roads, opposite lanes, and overpasses would need particular care.
Recording and reviewing are different actions
A live chart can show a large impact while the inspection queue remains empty if the operator has not started a location-tagged pass. That distinction needed to be understandable in the interface.
The resulting flow asks the operator to select a demonstration location and begin recording before moving the toy car. It also explains that pausing the chart does not stop incoming data. These details help people interpret what the dashboard has actually recorded.
Maintenance involves ownership and authority
A street near a university is not necessarily maintained by that university. A state highway and a local street may have different responsible agencies. A useful signal can still become an unusable task if it reaches the wrong organization.
Researching USC Facilities Planning and Management's work-order process reinforced the need to fit existing maintenance operations. RoadRelay currently demonstrates the review and documentation steps; it has no integration with USC's FAMIS system or an agency dispatch platform.
Accomplishments that we're proud of
The main accomplishment is connecting the physical demonstration to an understandable operational workflow. A visitor can see the hardware respond, inspect the associated measurements locally, and follow the next decision in the dashboard.
We are also proud of the separation between what works physically and what illustrates future scale. The public fleet scenario makes the concept explorable while remaining explicitly synthetic. Real toy-car readings are identified as real sensor data, and manually selected locations remain identified as simulated.
The company homepage, animated globe, responsive dashboard, and inspection detail panels give the project a coherent presentation. The repository also includes hardware photographs, wiring references with documented corrections, algorithms, research sources, and setup instructions. Existing automated checks cover software behavior; they do not establish real-road detection accuracy.
What we learned
The unit of evidence matters. A sample, a vehicle pass, and a distinct vehicle tell different stories. Choosing the wrong denominator can make a dashboard misleading even when every number comes from valid data.
Uncertainty belongs in the interface. A red light is compelling, but the explanation beside it determines whether a user treats it as a useful observation or an unsupported diagnosis. Labels such as “simulated location,” “rule-based summary,” and “suspected anomaly” are part of the product's accuracy.
A sensor needs an operational destination. The valuable output is a record that someone can inspect, assign, question, and follow up. The workflow has to respect the responsibilities of drivers, coordinators, inspectors, and asset owners.
AI needs evidence and boundaries. A concise brief can be useful after measurements and context are organized. It cannot supply missing ground truth, and fluent language should not make uncertain evidence look conclusive.
The first customer should make validation feasible. A city-scale vision becomes more credible after a small operator can install the hardware, label observations, use the workflow, and decide whether the product is worth paying for.
Who it is for and how it could become a business
Our proposed first customer is a campus or industrial-site operator that controls both a small fleet and the roads included in a pilot. The economic buyer would be a facilities or asset-management director, and the daily user would be a maintenance coordinator. Public works and state-road operators are the longer-term market.
The value proposition is to use journeys already being made to produce reviewable road observations and support follow-up. Whether this improves inspection efficiency or reduces total operating cost still needs to be measured.
A starting pricing hypothesis is USD 300 per site per month for up to ten vehicles, plus USD 250 per installed device. These figures are assumptions to test against installation cost, support needs, and willingness to pay. There are no paid customers, signed pilots, or validated margins claimed here.
The proposed route to the first 100 customer organizations is five founder-led design partners, followed by twenty additional customers through references and facilities networks, then seventy-five through qualified maintenance or inspection partners. Each stage would depend on measured value and repeatable onboarding. These are acquisition targets, not existing partnerships.
Research so far is based on published sources. First-hand interviews with drivers, maintenance staff, inspectors, and buyers are a necessary next step.
What's next for RoadRelay
The next milestone is a bounded, permissioned field pilot that can test whether RoadRelay produces useful inspection decisions.
- Make the hardware suitable for a vehicle. Review electrical design, correct the supplied draft wiring references, add protected power, a secure mount, and an appropriate enclosure.
- Add measured position and speed. Replace manual checkpoints with GNSS and road-segment association, while preserving location uncertainty.
- Build a labeled dataset. Compare candidate observations with independent inspections across different roads, vehicles, days, and speeds. Inspect unflagged segments too, so missed defects can be measured.
- Evaluate detection and workload. Report precision, recall, false candidates per 100 vehicle-kilometers, location error, and confirmed findings per inspection hour.
- Validate the operational fit. Observe how coordinators use the evidence, measure time to assignment, and test a paid pilot before expanding.
- Develop reliable field infrastructure. Add concurrent vehicle recording, stronger authentication, encrypted telemetry, retention controls, and approved work-order integrations.
The core detection metrics would be:
$$ \mathrm{Precision} = \frac{TP}{TP+FP}, \qquad \mathrm{Recall} = \frac{TP}{TP+FN} $$
These must be defined at the inspected defect or road-segment level, not the raw-sample level. Repeated passes over the same location must not leak between training and evaluation sets. No RoadRelay precision or recall result has been established yet.
Disaster recovery is a longer-term extension: on routes already authorized as safe to traverse, new observations could help qualified teams decide where to inspect next. The current prototype cannot assess structural damage, detect hidden failures, or certify a route as safe.
RoadRelay's mission is to make routine journeys useful to the people who maintain our roads. The next step is to put that idea in front of those people, collect field evidence, and learn whether it deserves a place in their everyday work.


Log in or sign up for Devpost to join the conversation.