RoadPulse — Built for the Roads That Data Forgot
Inspiration
I study Civil Engineering at IIT Roorkee. Every time I travel back home to Gadchiroli, Maharashtra — a district that sits at the edge of India's road network — I see the same thing: broken stretches, waterlogged patches, potholes deep enough to swallow a tyre. And nothing changes.
It's not that people don't care. It's that reporting is broken.
The average citizen in rural India would need to find the right government portal, fill a multi-field complaint form, attach GPS coordinates, describe damage in official language, and upload a properly formatted photo — all from a patchy internet connection on a budget Android phone. Most give up before the second screen.
Meanwhile, India loses over 3,500 lives per year to pothole-related accidents alone. The roads that kill people the most are precisely the roads that get reported the least.
I kept thinking: what if reporting a road problem was as easy as taking a photo?
That question became RoadPulse.
🔨How I Built It
The entire project was built using Cursor AI — and the speed was genuinely surprising. Features that would've taken me a day to scaffold were done in hours.
Tech Stack
| Layer | Tool |
|---|---|
| Frontend | React.js (mobile-responsive) |
| AI Vision | Claude Vision API (image analysis) |
| Geolocation | Browser Geolocation API + OpenStreetMap Nominatim |
| Map | Leaflet.js with colour-coded severity pins |
| Report Generation | Auto-formatted complaint text → PDF export |
| Backend | Node.js + Express + lightweight JSON store |
| Editor | Cursor AI |
The Core Flow
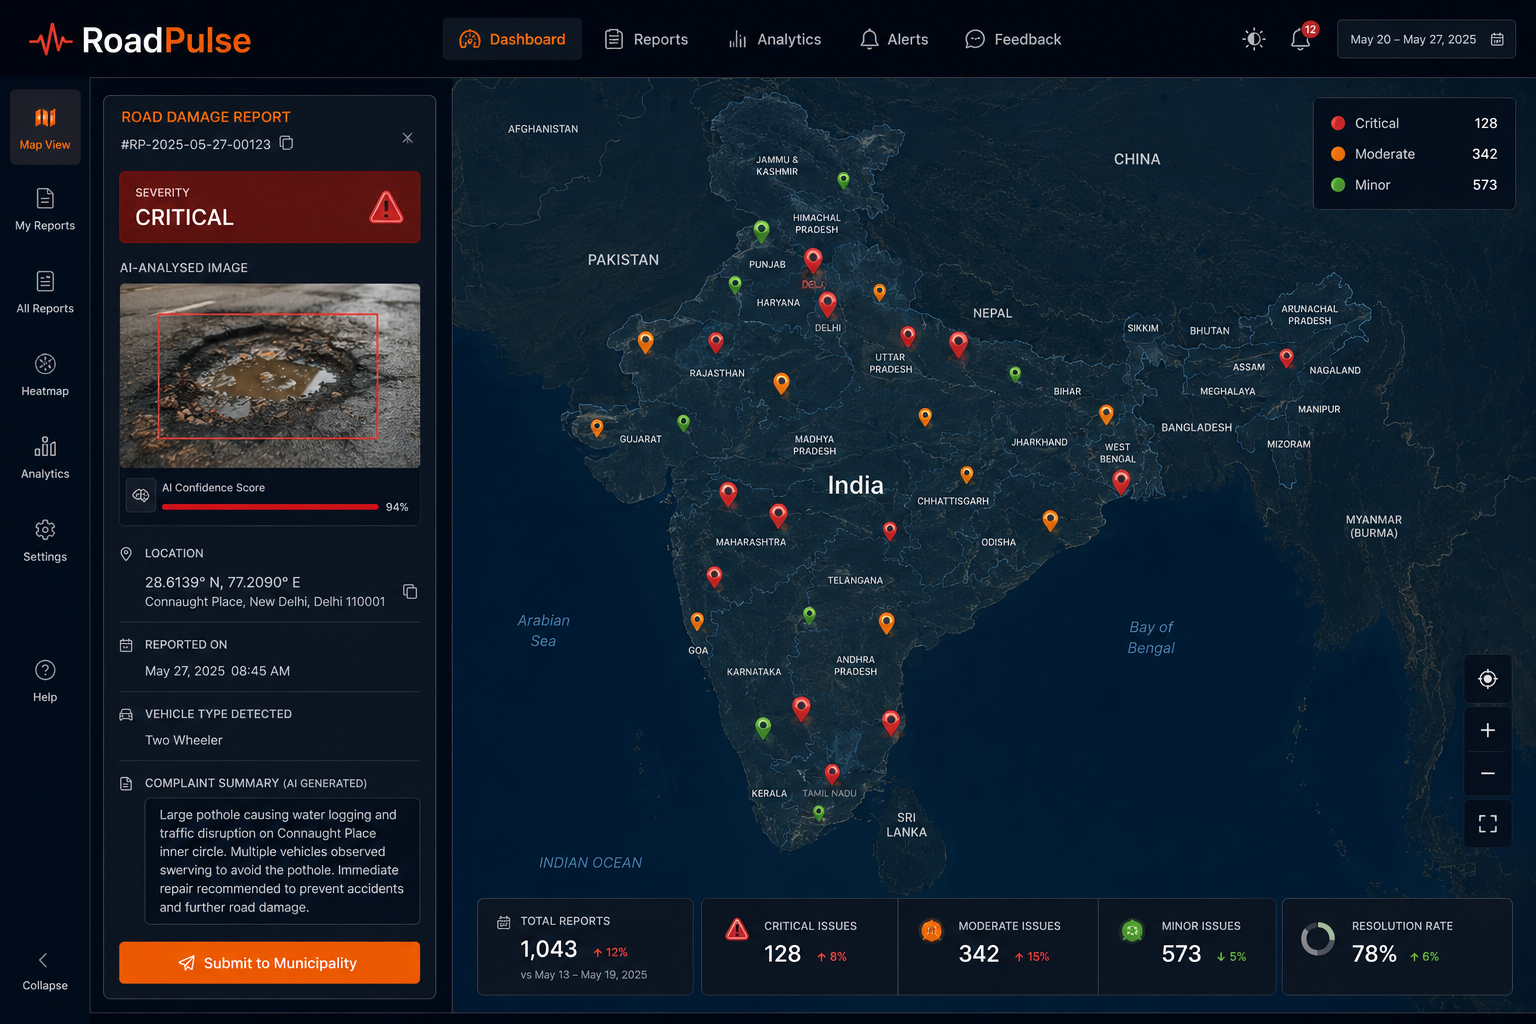
The AI severity classification works on a simple but effective logic. Each uploaded image is analysed for:
- Damage type — pothole, surface crack, waterlogging, broken divider, missing signage
- Coverage area — estimated % of road surface affected
- Depth/deformation — inferred from shadow and deformation cues in the image
These map to a 3-tier severity score:
$$ S = \begin{cases} \text{Minor} & \text{if } A < 15\% \text{ and depth is shallow} \ \text{Moderate} & \text{if } 15\% \leq A < 40\% \text{ or medium depth} \ \text{Critical} & \text{if } A \geq 40\% \text{ or structural damage detected} \end{cases} $$
Where $A$ = estimated affected road surface area from image analysis.
The complaint report is then auto-generated with:
- Damage type and severity label
- GPS coordinates + reverse-geocoded address
- Timestamp
- AI-generated description paragraph
- Unique reference number
All reports are pinned live on a shared Leaflet map — green for Minor, orange for Moderate, red for Critical.
Challenges I Faced
1. Getting AI to Understand Road Images Consistently
Road damage photos are messy — bad lighting, weird angles, moving vehicles in frame. Getting the vision model to return structured, consistent JSON (damage type + severity + confidence) required careful prompt engineering. I spent a significant chunk of time tuning the system prompt until the outputs were reliable enough to feed directly into the report generator.
2. Reverse Geocoding in Rural Areas
OpenStreetMap's Nominatim works brilliantly in cities. In rural India? Not so much. Many coordinates returned vague or missing locality names. I built a fallback that displays raw lat/long with district-level metadata when a street-level address isn't available — not perfect, but honest.
3. Making It Work on Low-End Mobile Browsers
RoadPulse is a web app — no install needed. But making it genuinely usable on a budget Android phone with Chrome required stripping unnecessary JS, lazy-loading the map, and compressing the image before upload client-side so it doesn't time out on a 2G connection.
4. Building Fast with Cursor
This was my first time going deep on Cursor's agent mode for a full-stack project under time pressure. The challenge wasn't using it — it was trusting it. Once I stopped double-checking every generated line and started focusing on the architecture decisions, the pace accelerated dramatically. That was the real learning.
What I Learned
- AI vision models are ready for civic tech. The classification quality on road images was far better than I expected without any fine-tuning — just prompt engineering.
- The UI is the product. For a civic tool meant for non-technical users, the interface needed to be near-zero friction. Every extra tap is a user lost.
- Cursor changes the pace of hackathon building. Not by writing perfect code — but by eliminating the dead time between ideas and working implementations.
- Real problems build better products. Because I've personally experienced bad roads in Gadchiroli, every design decision had a clear answer: what would actually help someone in that situation? That clarity made the build faster and the product sharper.
What's Next for RoadPulse
- Offline mode — queue reports without internet, submit when connected
- Community upvoting — if $n \geq 10$ users report the same $500\text{m}$ stretch, severity auto-escalates to Critical
- Direct PWD / PMGSY integration — submit complaints directly to government portals via API
- Open data layer — public API for researchers, journalists, and urban planners to query aggregated road condition data
- Historical resolution tracking — citizens can mark a road as fixed, creating a closed-loop feedback system
A Civil Engineering student looked at broken roads, a broken reporting system, and a billion smartphones — and connected all three with a single photo tap.
Built With
- browser-geolocation-api
- claude-vision-api-(anthropic)
- cursor-ai
- express.js
- github
- jspdf-(pdf-report-generation)
- leaflet.js
- node.js
- openstreetmap-nominatim-(reverse-geocoding)
- react.js
- tailwind-css

Log in or sign up for Devpost to join the conversation.