Inspiration
We were challenged with fixing a problem with transportation and in places like south Florida where it has heavy interstate highway traffic for most daily commuters, unforeseen incidents on the road are commonplace. Services like Google Maps and waze have a system for reporting some of these incidents but they are distracting, dangerous, inconvenient, and limited for most people. Navigating multiple menus from across the screen while driving provides too much friction for most users to bother reporting incidents. We also saw that Waymo car systems struggle with extraneous variables on the road like construction work, animals, and debris on the road. We wanted to create a solution for both these problems where the data we use will benefit not just the companies developing transportation technology, but also the end user that will enjoy more predictable driving events and easer to use systems.
What it does
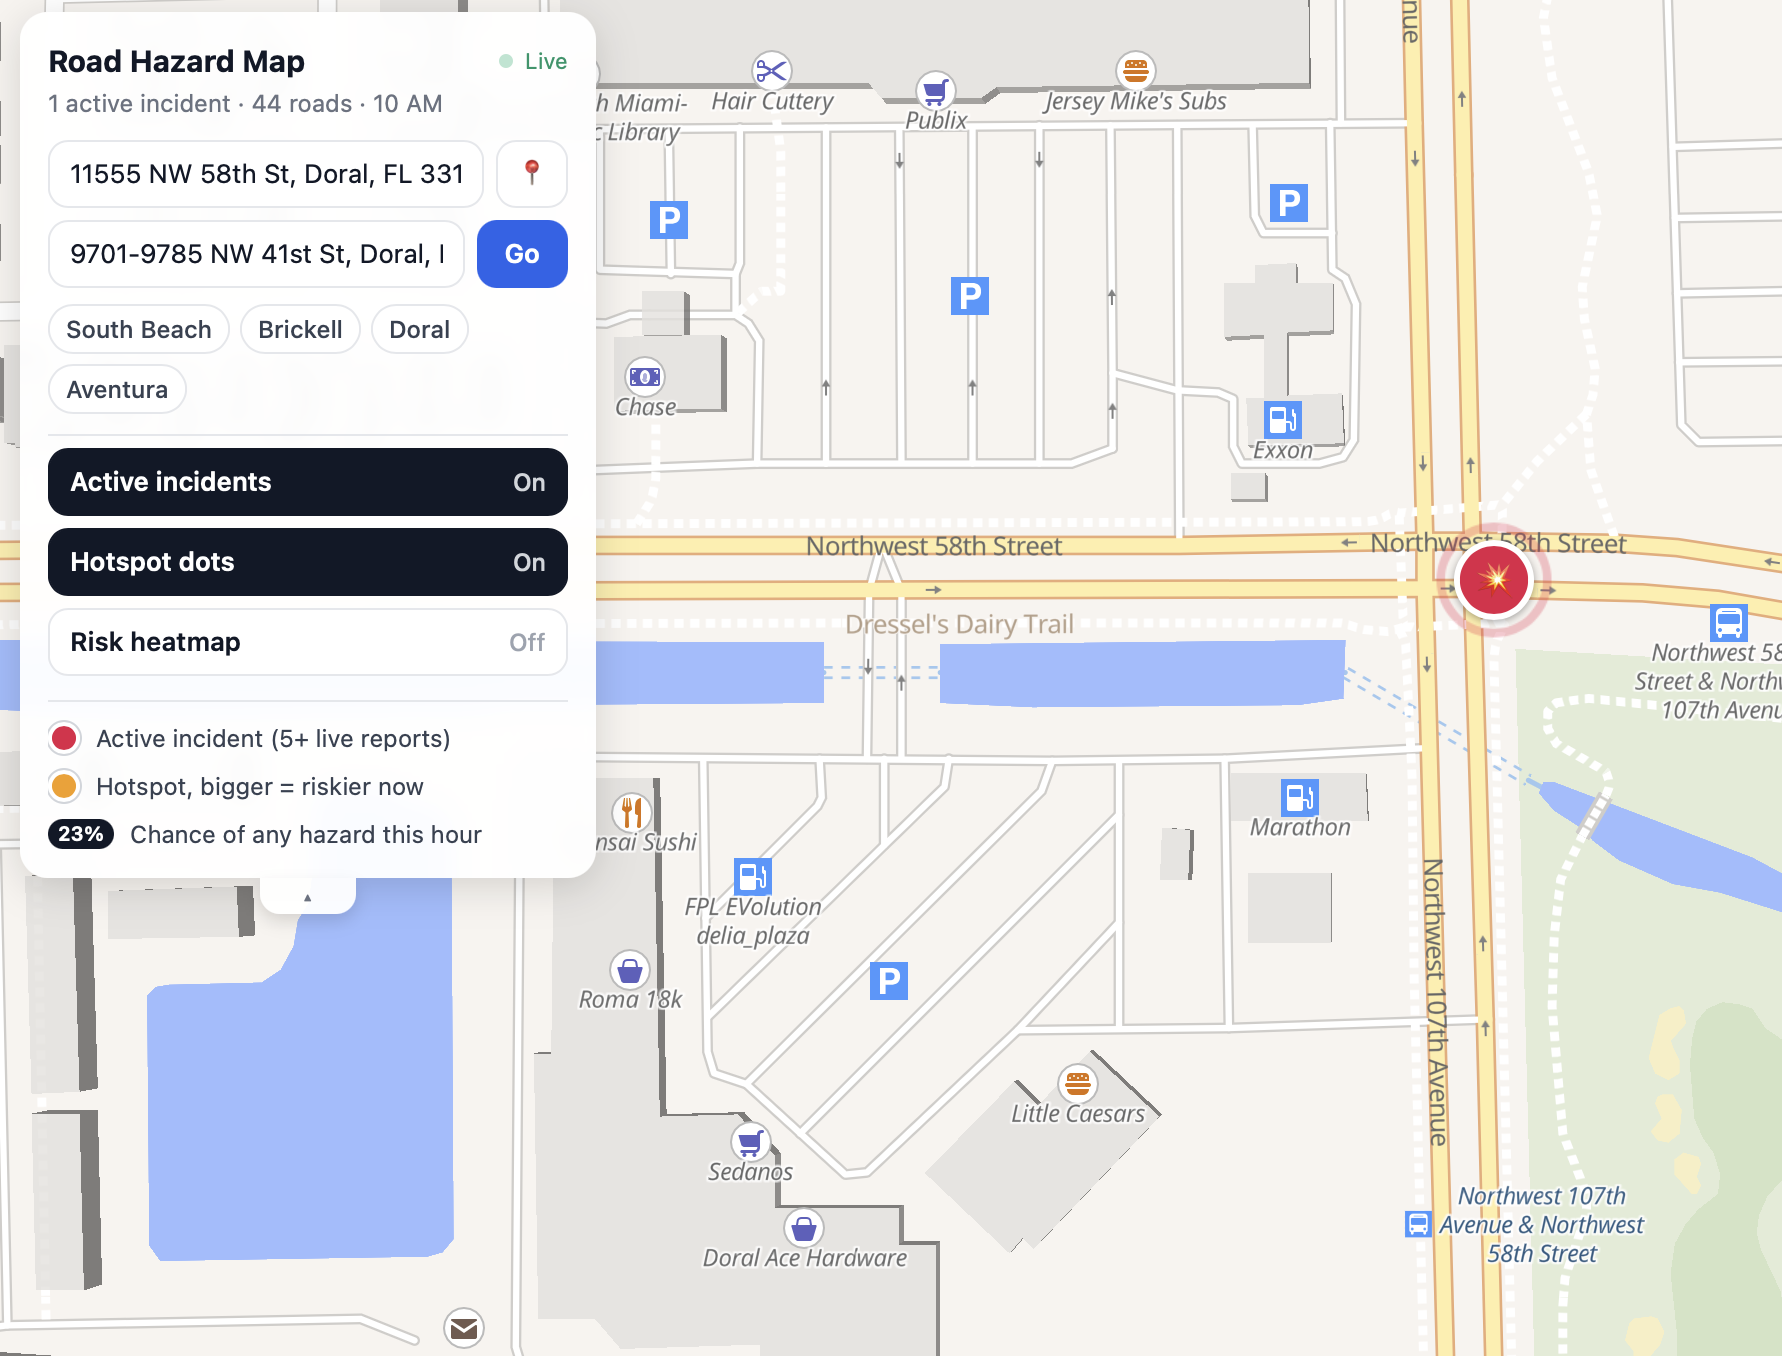
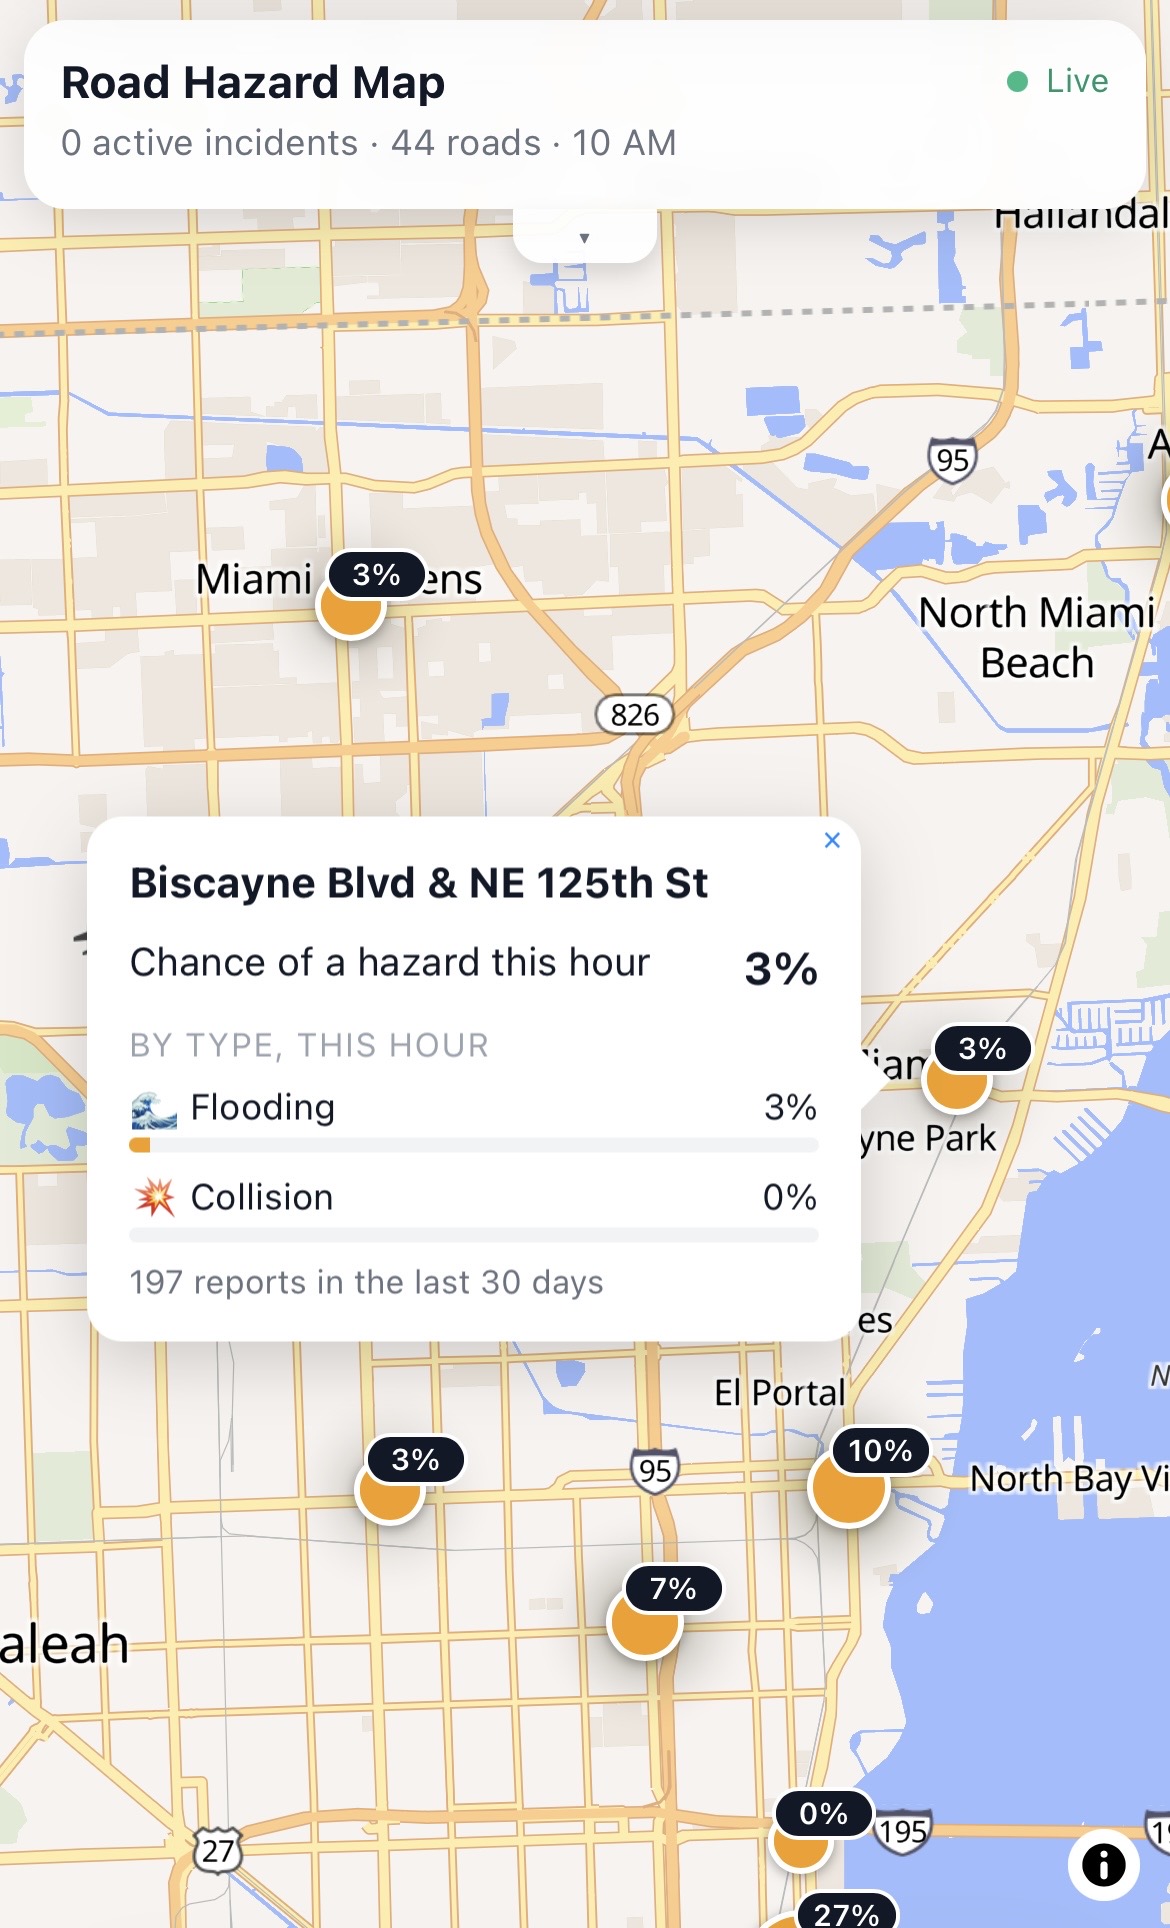
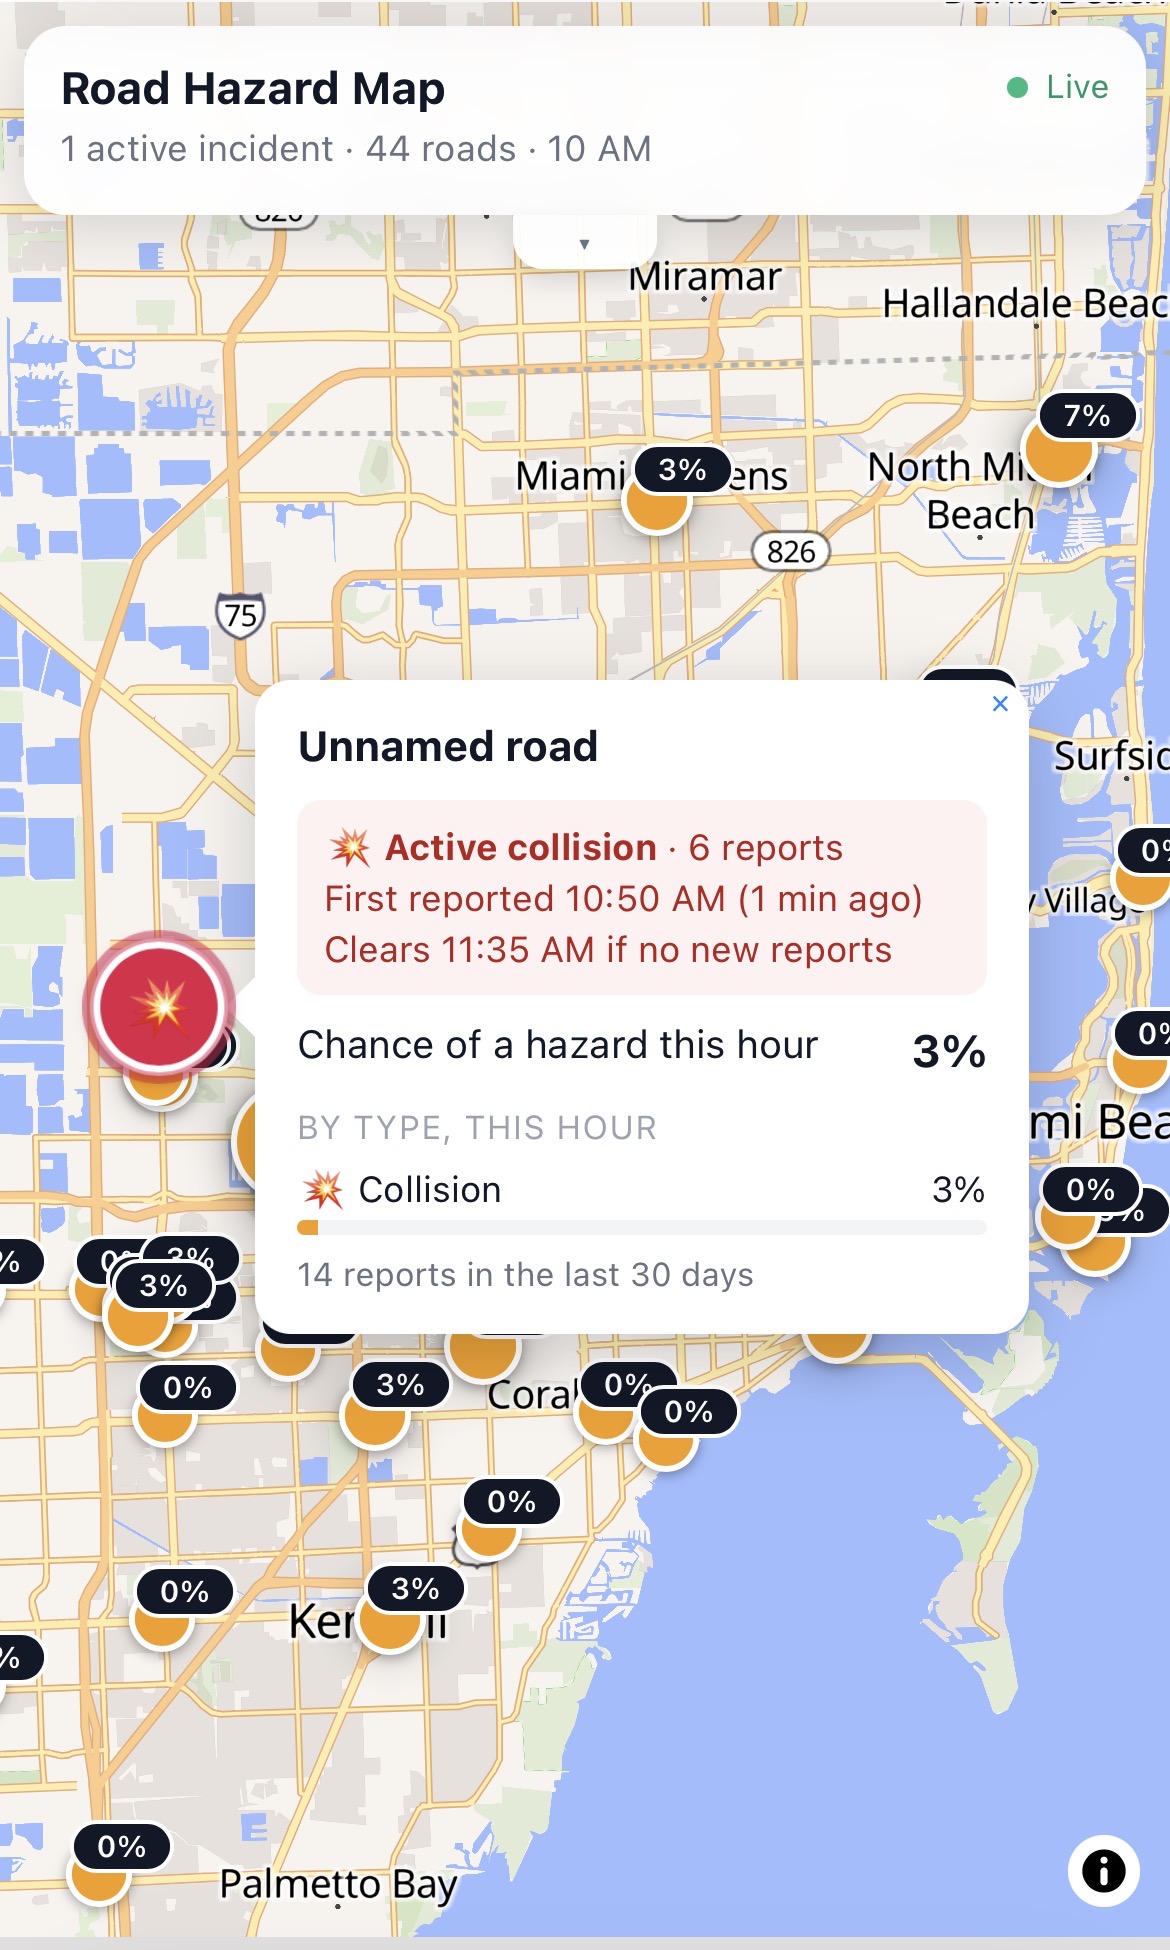
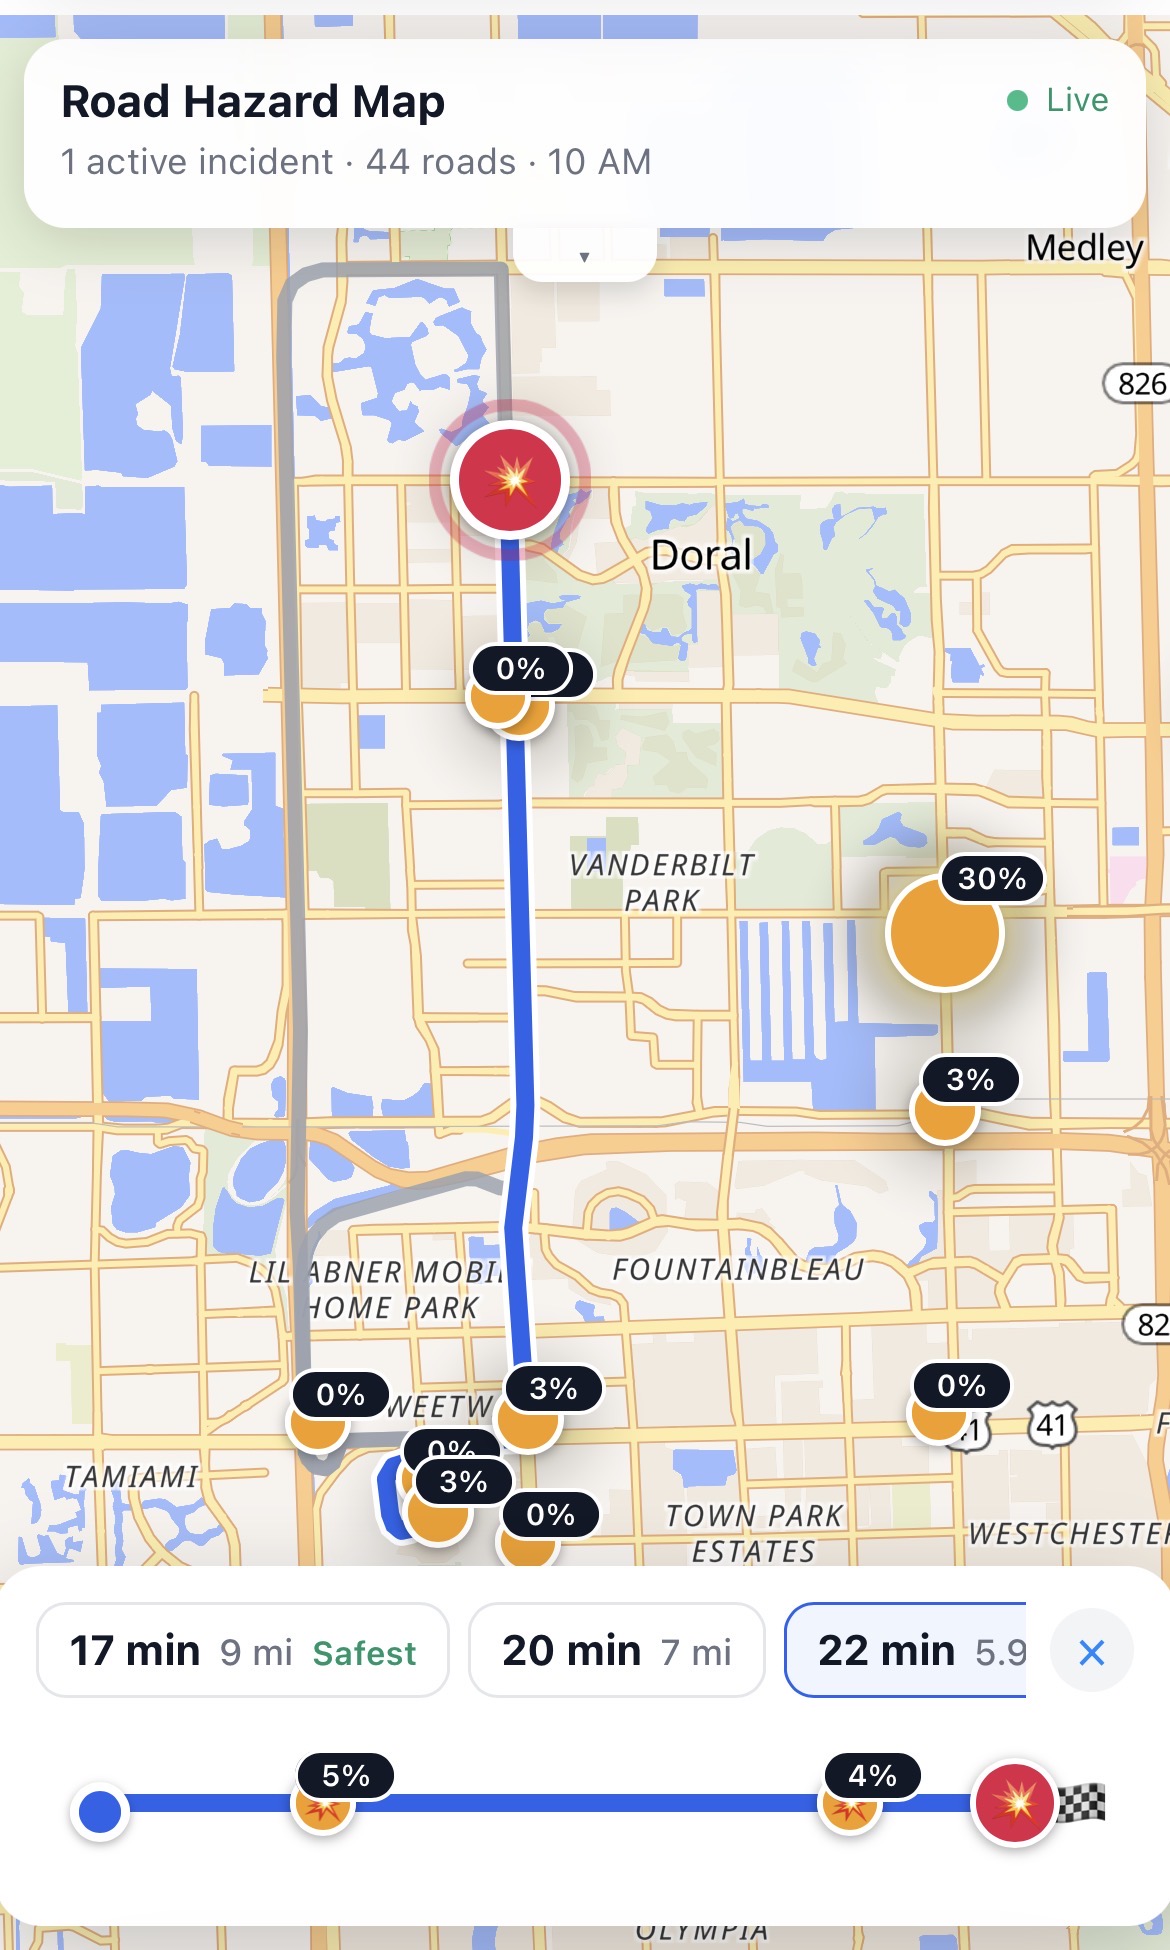
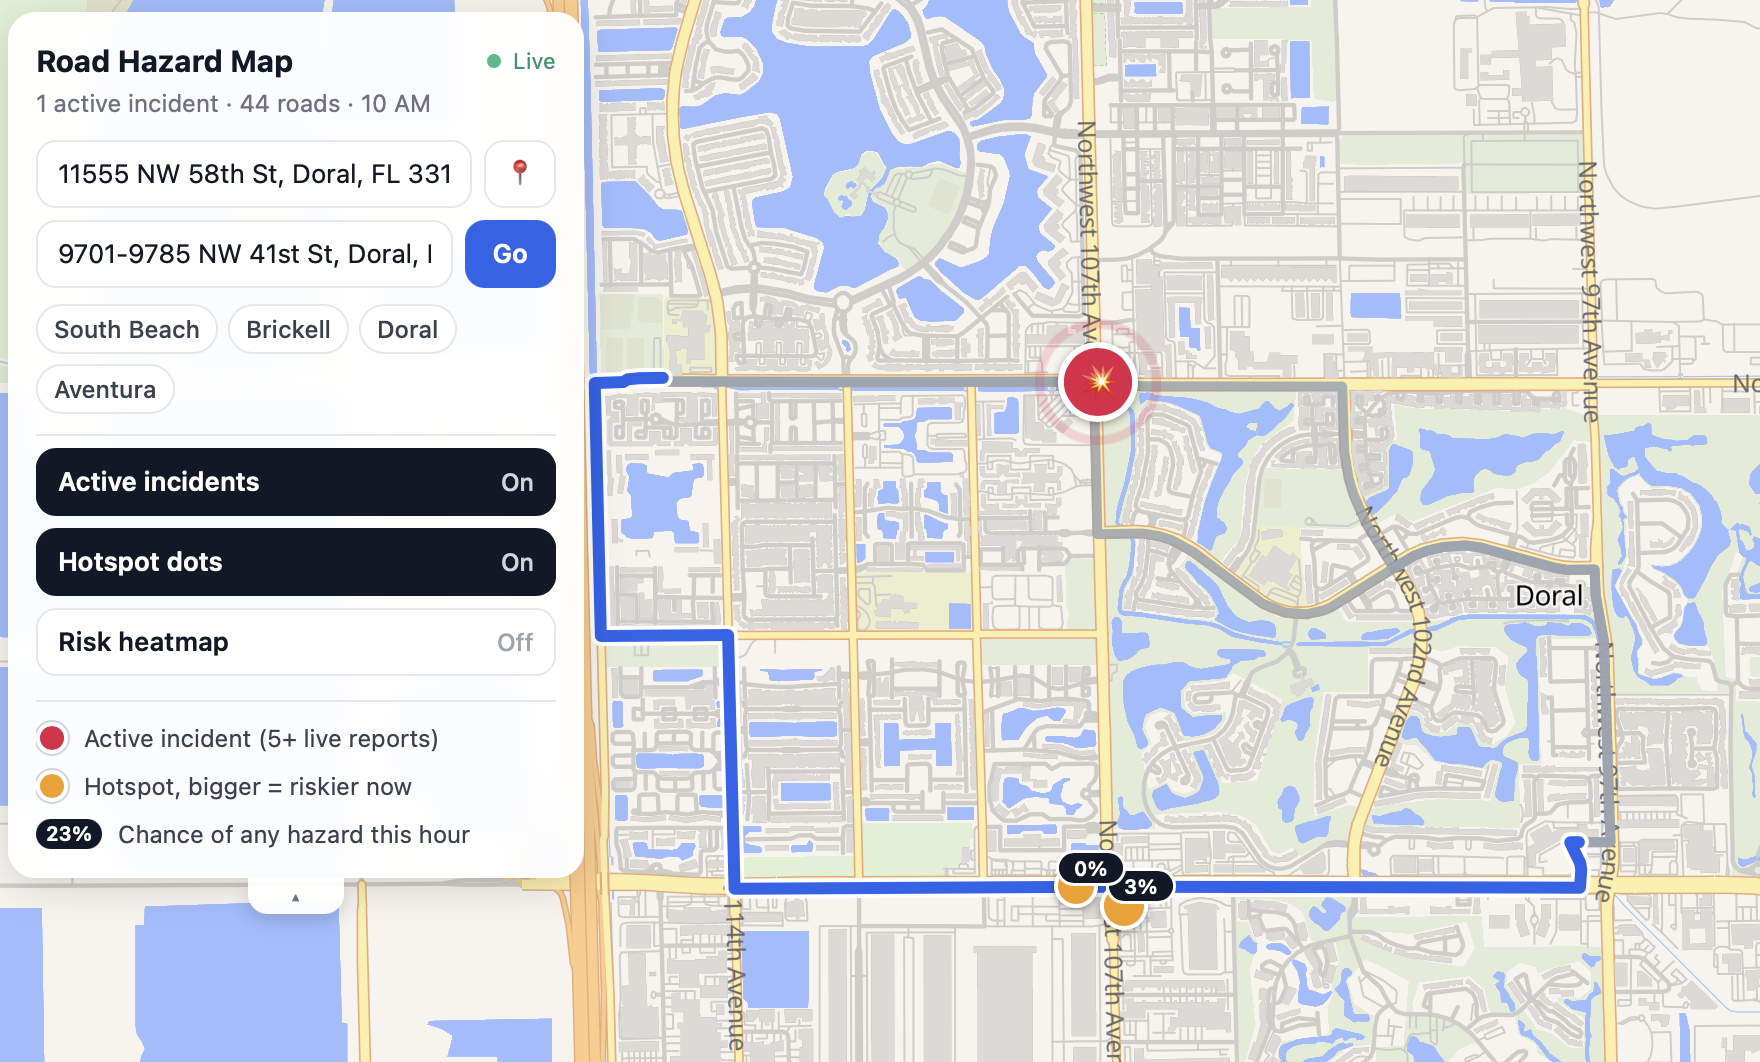
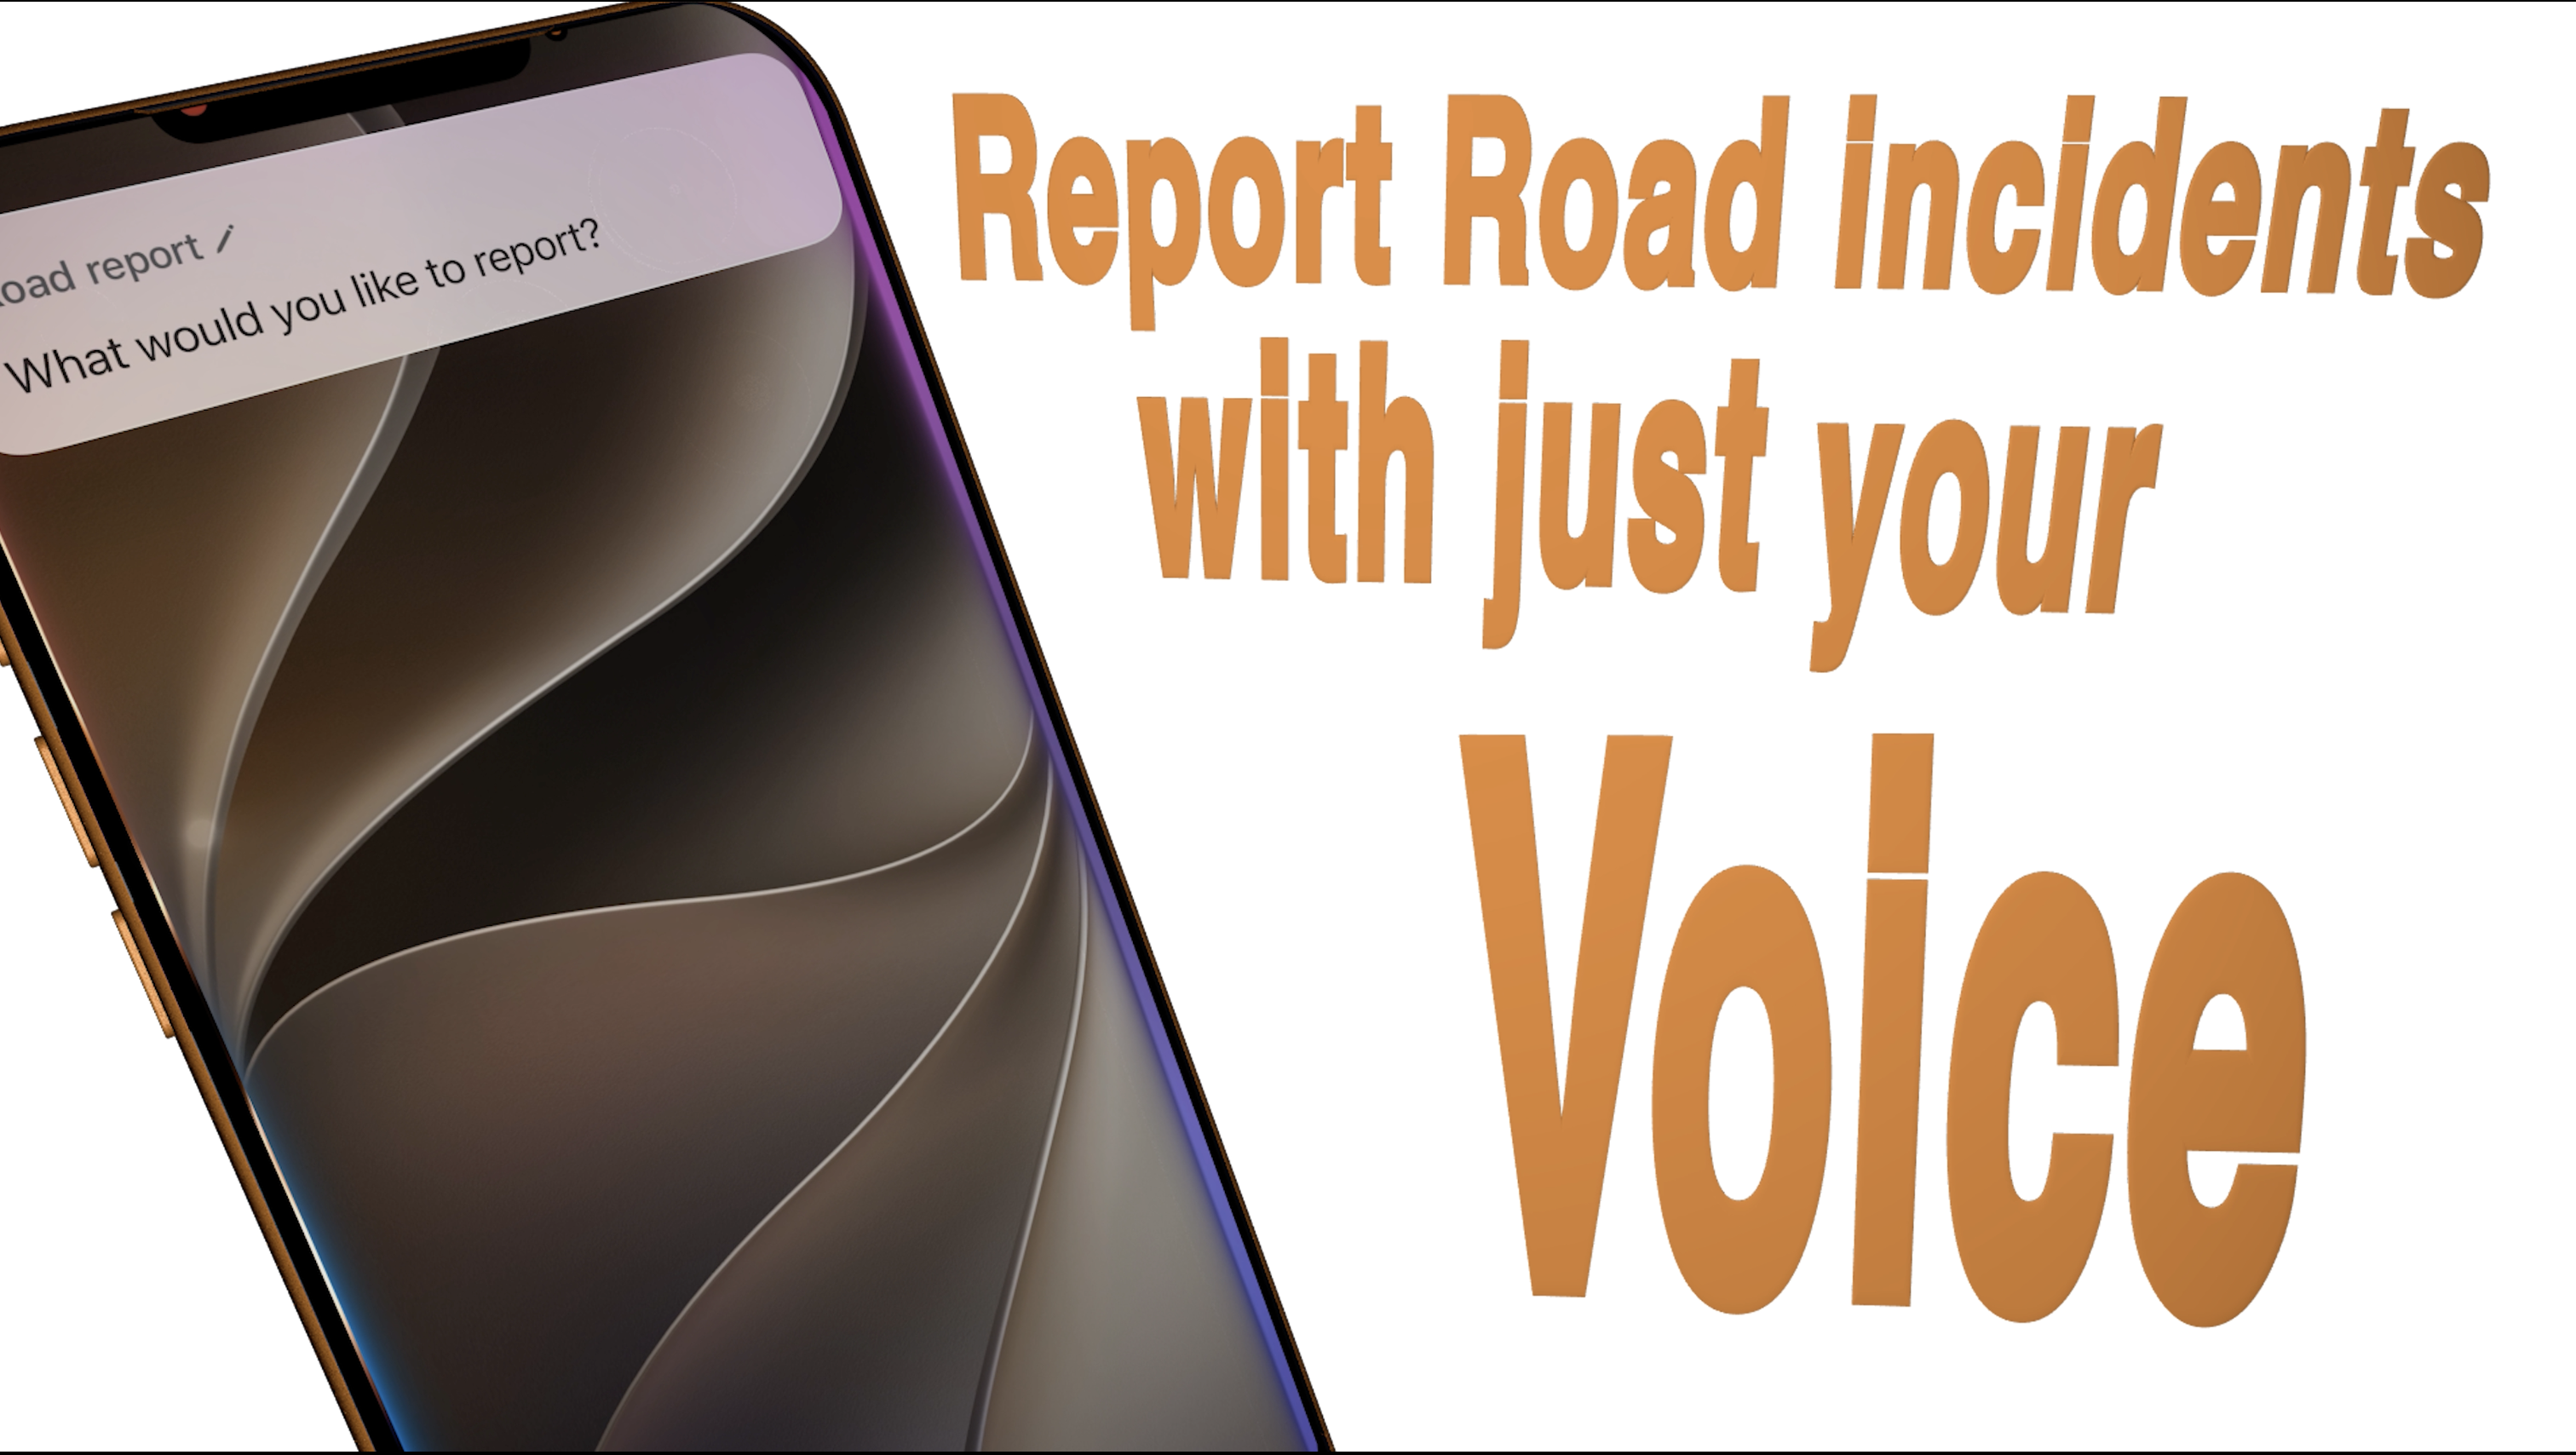
Our project uses your phone's built-in assistant to create on-road reports covering a wide spectrum of potential incidents, like animals, objects on the road, construction, stopped or crashed cars, EMS vehicles on the shoulder, and more. With the reporting system being initiated by your phone's operating system, you can create reports without the need of a separate app, which increases the potential for data gathering of incidents. The reports then create a potential event where if more than 5 reports of the same incident occur it becomes public that can be seen by approaching users. Once the event stops being reported the event closes and the incident type and beginning and end time get stored to a database. The users whom reported the incident accurately get awarded with points. The users can receive more accurate road incident descriptions with far more ease of use to contribute which will ultimately lead to more accurate and safer driving by helping driver expectations and adjustments to driving styles for incoming slowdowns/maneuvers.
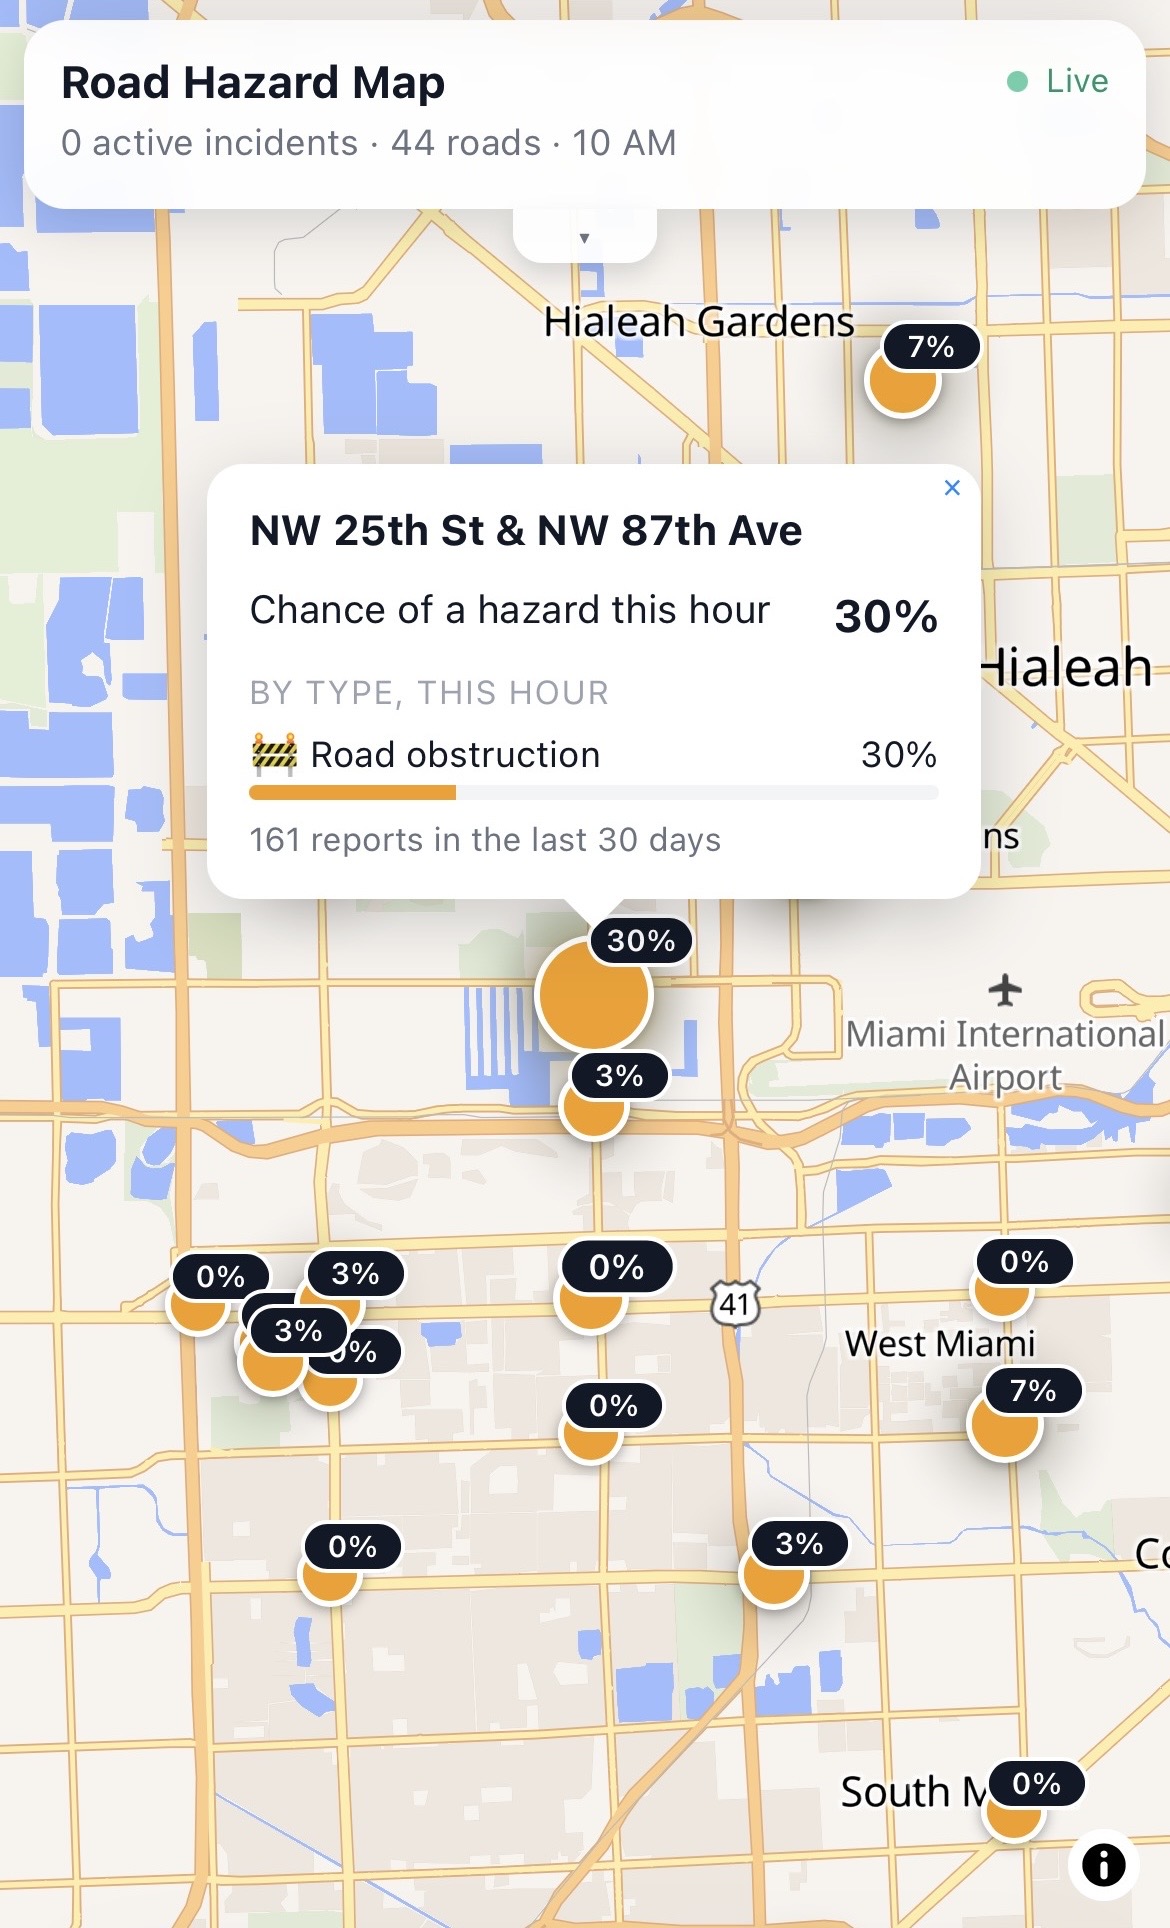
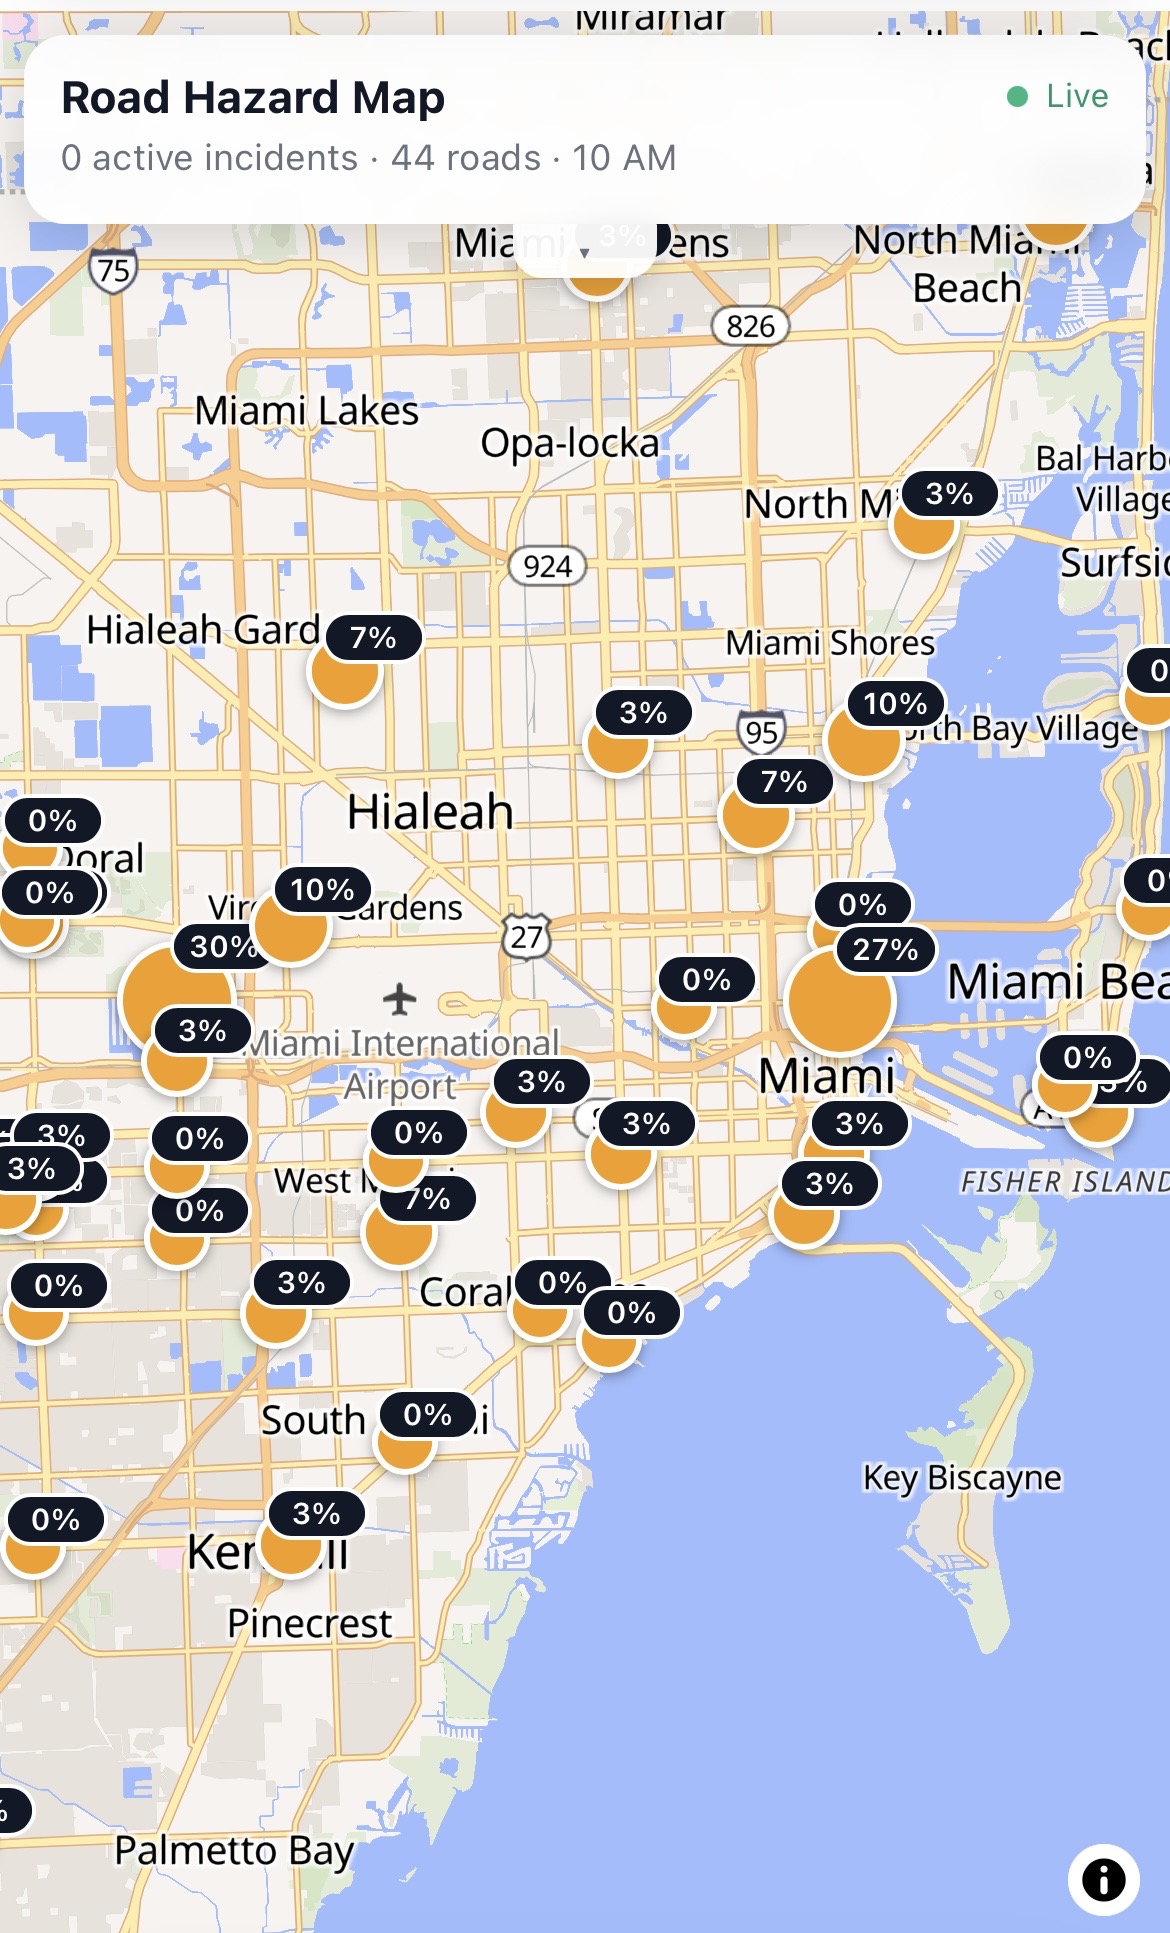
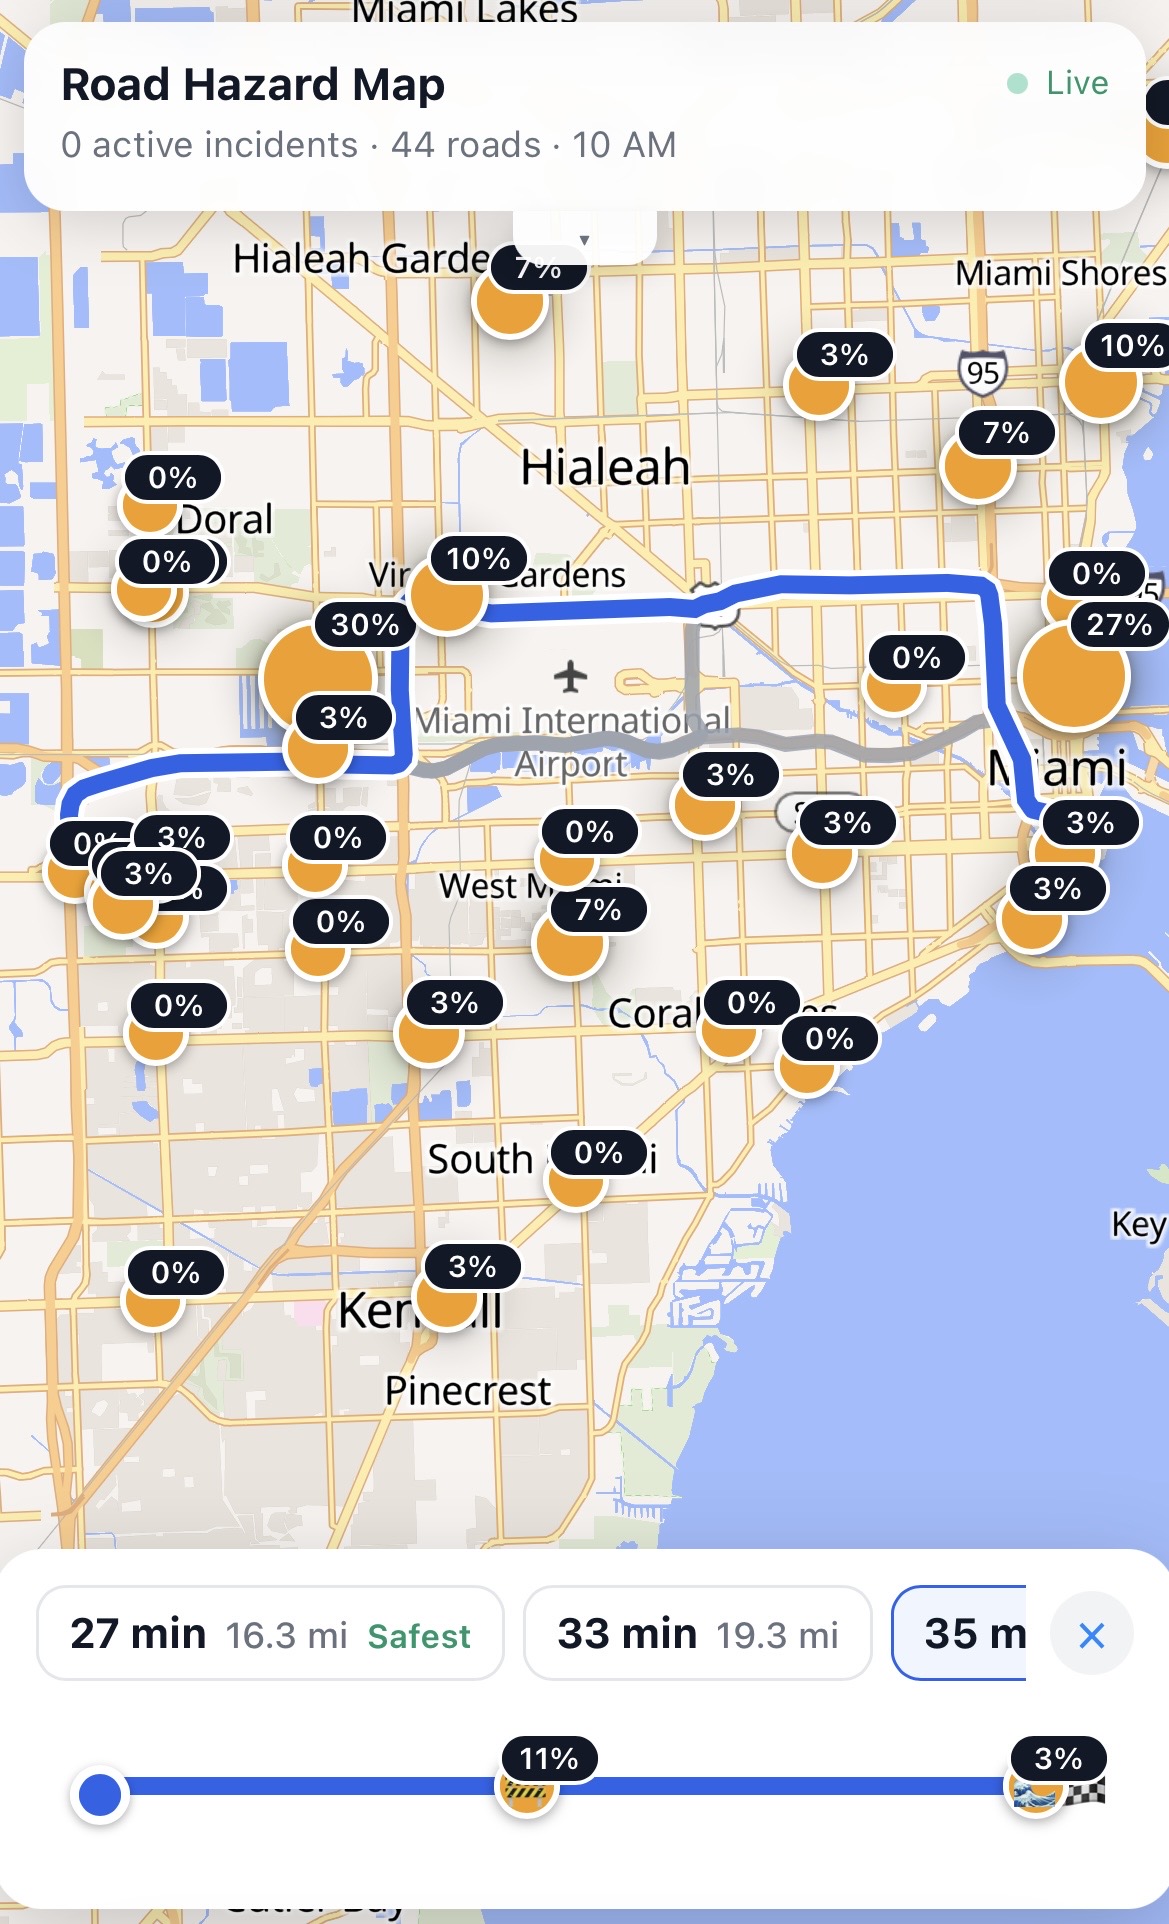
The incident location, duration, and times are stored in a database that can be used to generate heat maps of increased incidents and filtered by common incidents creating metrics to which the applications are wide. The event data has many uses for third parties as, over time, trends in incidents will appear throughout specific times of year, times of day, and types of incident. This data, for a company like Waymo can be used for planning alternate routes or using specific driving patterns in high hazard areas such as avoiding or slowing down on common deer crossing areas from November-January during 7:00AM-6:00PM. Urban planners can look at areas of the city where there are increased incidents to plan construction projects and placements of new roundabouts, traffic lights, and other appropriate methods for making driving safer. The data can be used for determining periods of increased construction in areas during longer city projects and for measuring local economic changes. It can be used by researchers for looking at animal migration patterns impacted by human activity. Incidents with fallen utility poles can be specifically and quickly reported to local communities to resolve the issues.
How we built it
We started with several ideas, and rather than committing to the first one we liked, we kept refining them until we landed on the most well-rounded option. Before writing any code, we spent time working through the idea in detail so that every member understood where the project was headed and how their piece fit into it. Once the direction was clear, we divided the work based on each person's strengths.
Challenges we ran into
Throughout development, we ran into several technical hurdles, especially when it came to handling large amounts of location-based data efficiently, grouping duplicate reports, and keeping the map responsive as more incidents were added.
We also had to think carefully about how reports should be validated, stored, and displayed so users would not be overwhelmed by multiple reports of the same road hazard. Designing a system that could combine similar incidents while still preserving useful information pushed us to rethink parts of our original architecture.
Connecting the user system OS to our software and database also required a lot of testing and debugging. These challenges forced us to adapt quickly, simplify parts of our design, and build a more scalable solution.
One challenge our frontend developer faced was dealing with mobile UI and designing it. He also had some issues with JavaScript which needed to be fixed before continuing with the development. There were also design and time constraints that needed to be considered when dealing the UI which had to be changed to be within the scope of the project.
Accomplishments that we're proud of
Going out and testing the functionality on an actual road was really cool to see because we were able to actually see our product in the real-world. We're also proud of how we scoped the project, as we are mostly new to hackathons as a team, so we had to make sure we didn't try to do too many things at once.
What we learned
The idea is what makes or breaks a project. With so many possible directions to take, narrowing everyone's ideas down to a single one took real collaboration and a willingness to adjust our own preferences along the way.
What's next for Road Report
The next step in Road Report is finding more ways to encourage users to report incidents when they come across them. One of those ideas was to gamify the system in which users are encouraged to report accidents in order to gain points they can spend on in-app prizes. These prizes would include custom avatars and/or custom voices they can acquire by spending points gained from sending reports. Of course restrictions would have to be in place so that users won't abuse the point system by spamming reports. This can be done by only giving points when the hotspot reported becomes an active incident
Built With
- google-maps
- javascript
- react
- tiger-data
- typescript


Log in or sign up for Devpost to join the conversation.