Inspiration
A Toronto street is a fixed width, but the people who need it keep changing. Drivers, delivery trucks, bus riders, cyclists, people walking and local shops all want a share. Arguments about bike lanes, bus lanes and parking get heated fast, and the trade-offs are hard to see from a news story or a spreadsheet.
The School of Cities challenge asks for civic technology that helps people understand a real urban problem facing Toronto, built on Toronto urban data. Its Transit, Congestion and Access theme asks "Bikes vs. cars vs. pedestrians: can Toronto streets work for everyone?" and "What would changing how we use road space actually do?"
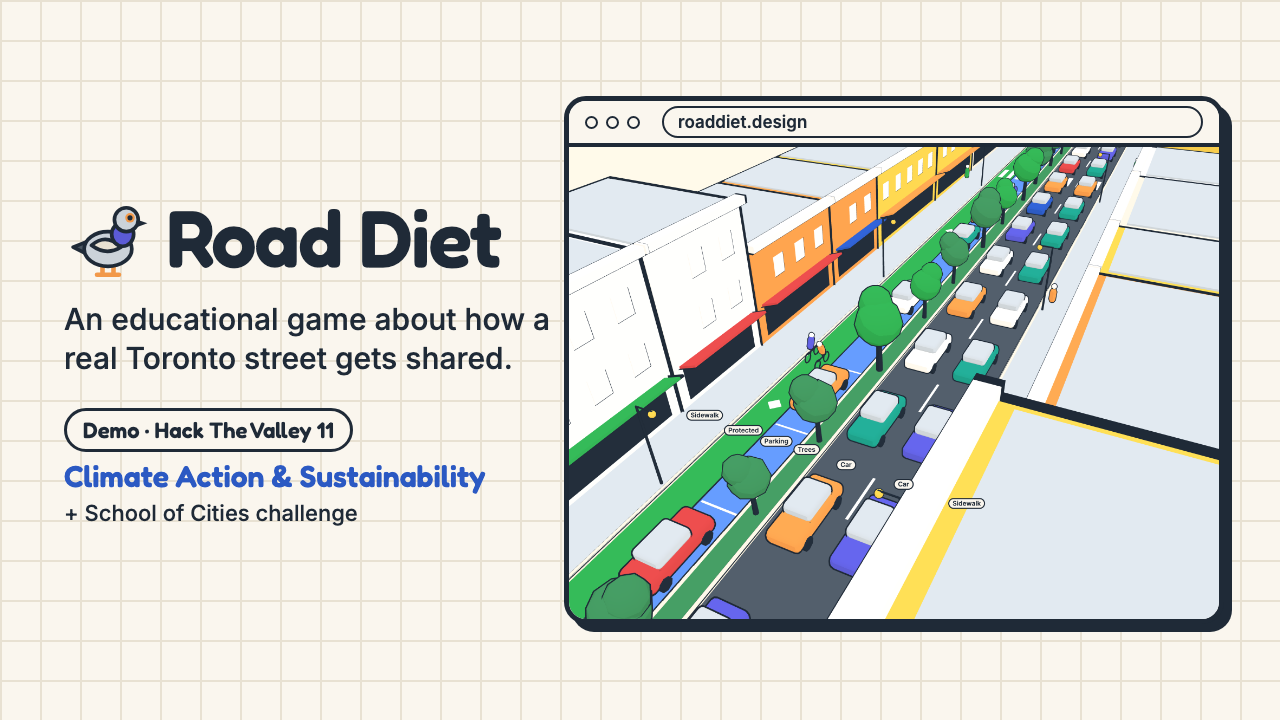
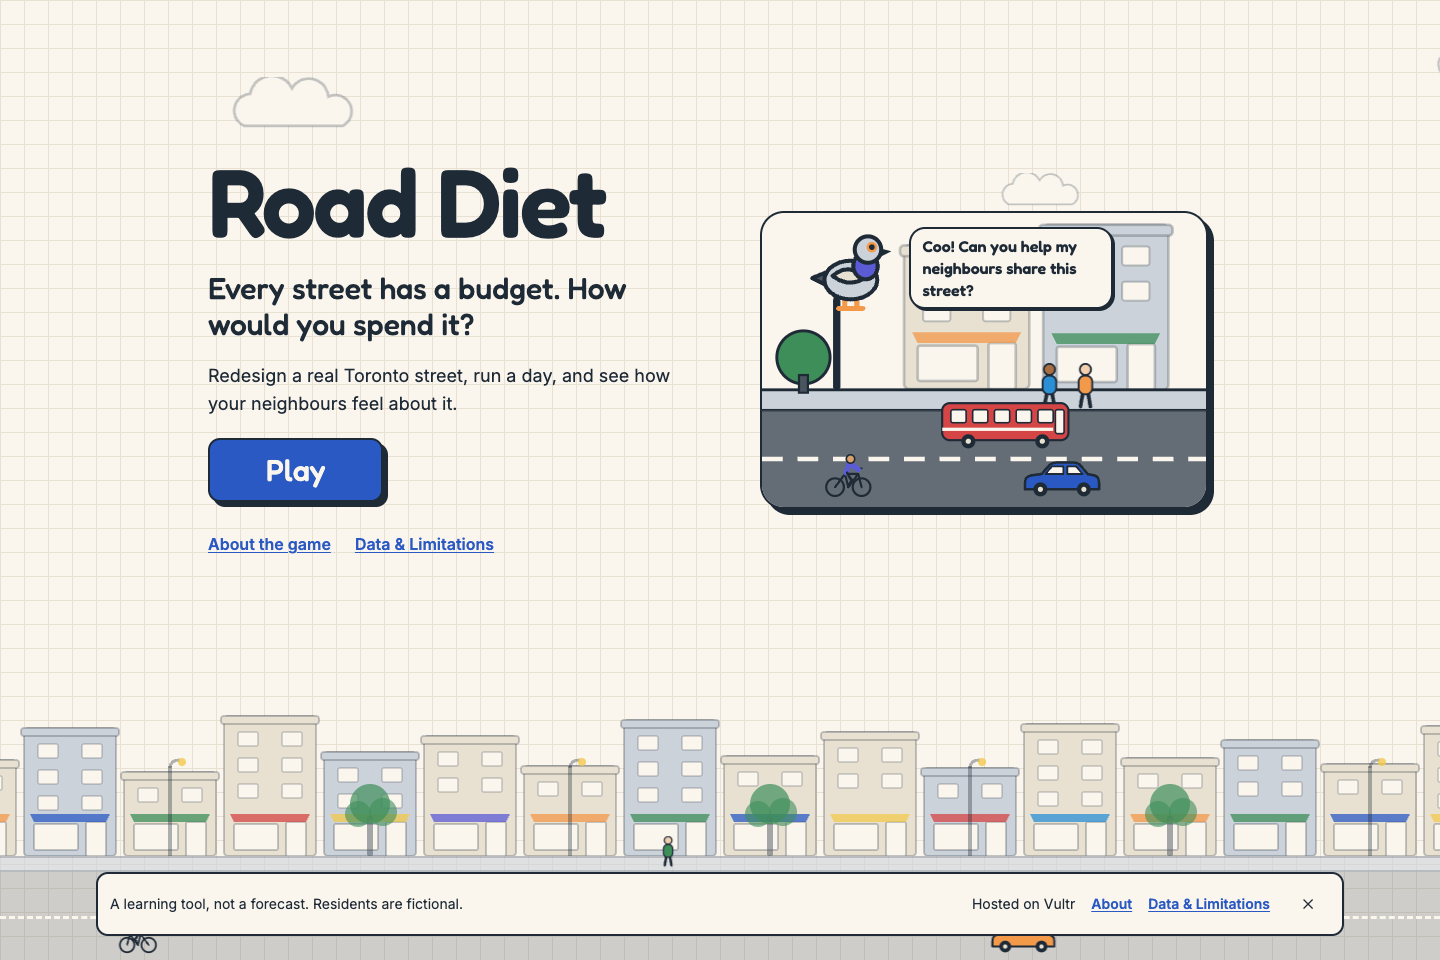
Road Diet is an educational game for that second question. Students, teachers and neighbours redesign a real street themselves, run a day, and hear from the residents who use it. The aim is not to find one right answer. It is to feel why every choice helps someone and costs someone else, and to learn the words planners use for it.
What it does
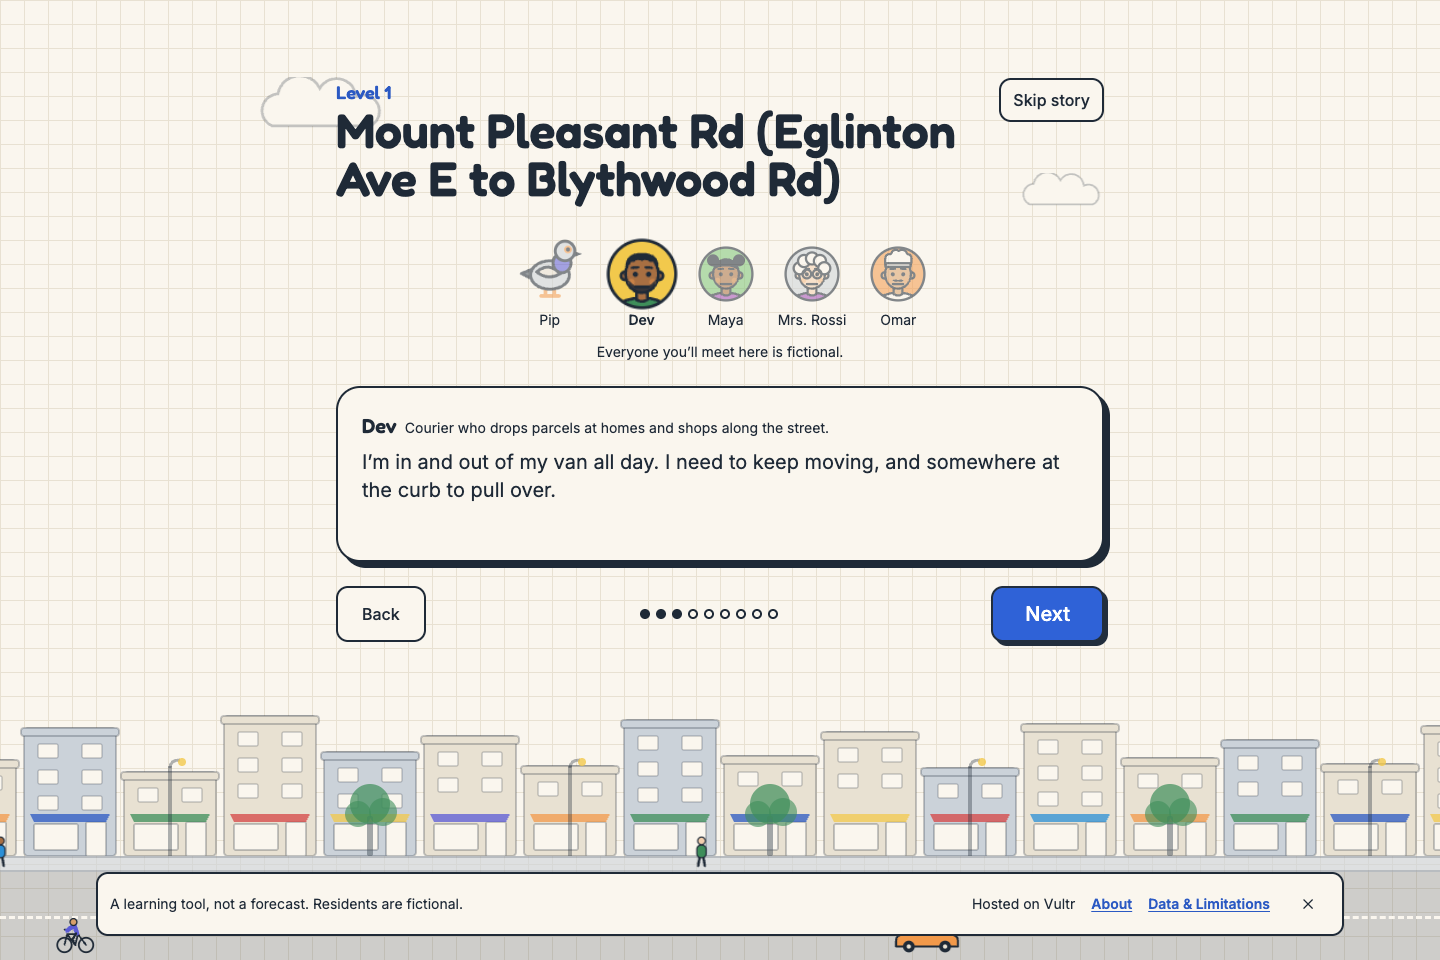
Pip's story. Pip, a bird who lives on a lamppost on the street, introduces the residents and their problem. Each street has its own cast of four fictional residents in the same four roles: a delivery driver, a student who would bike, a senior who walks, and a shop owner.
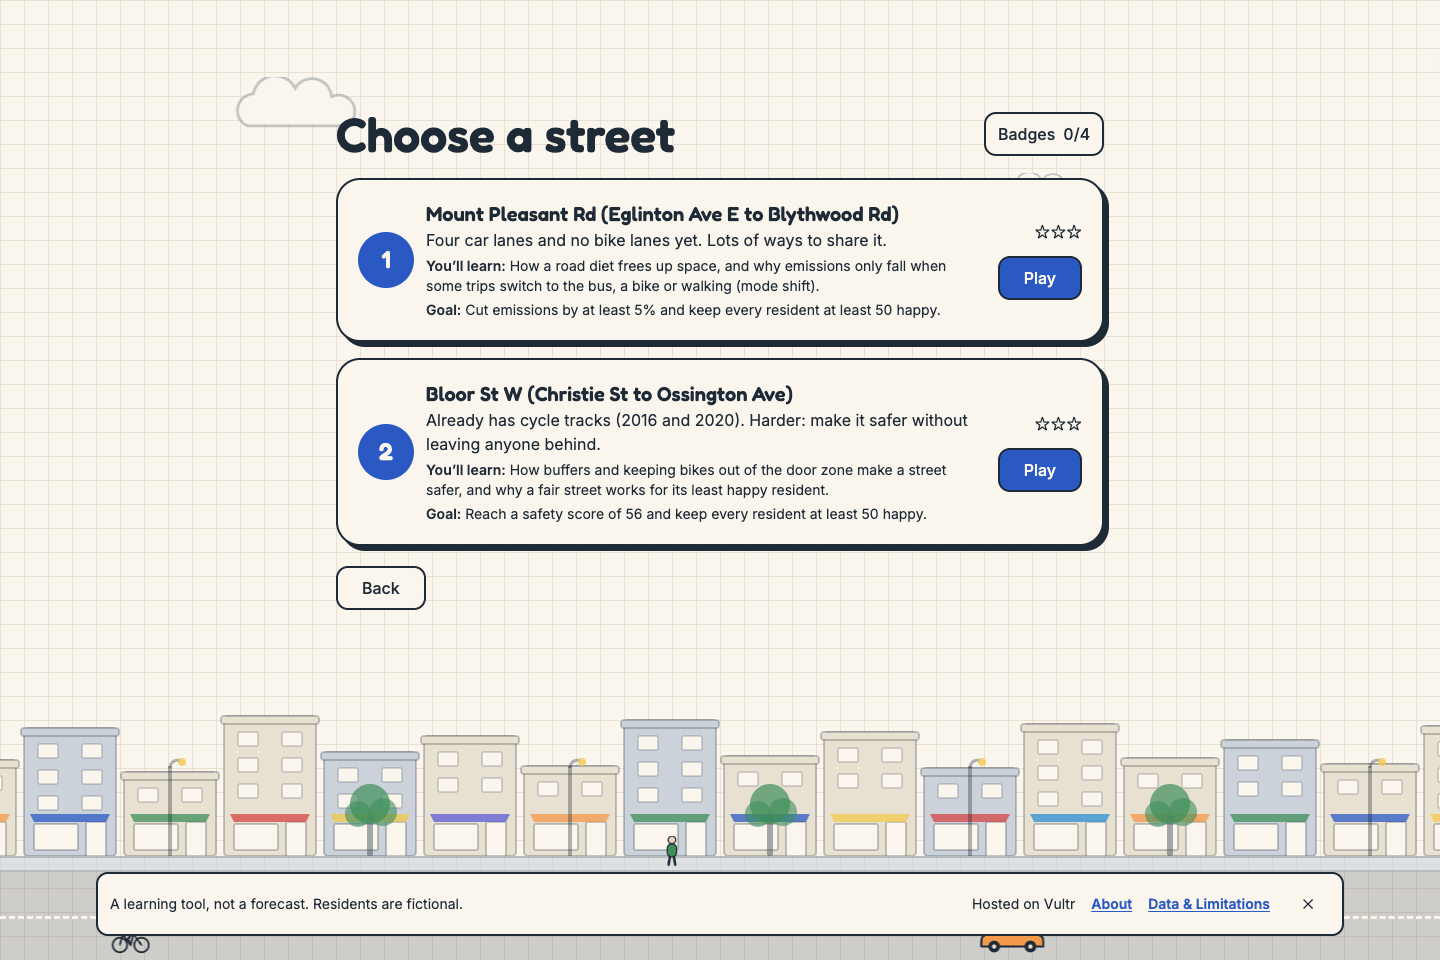
Two real streets.
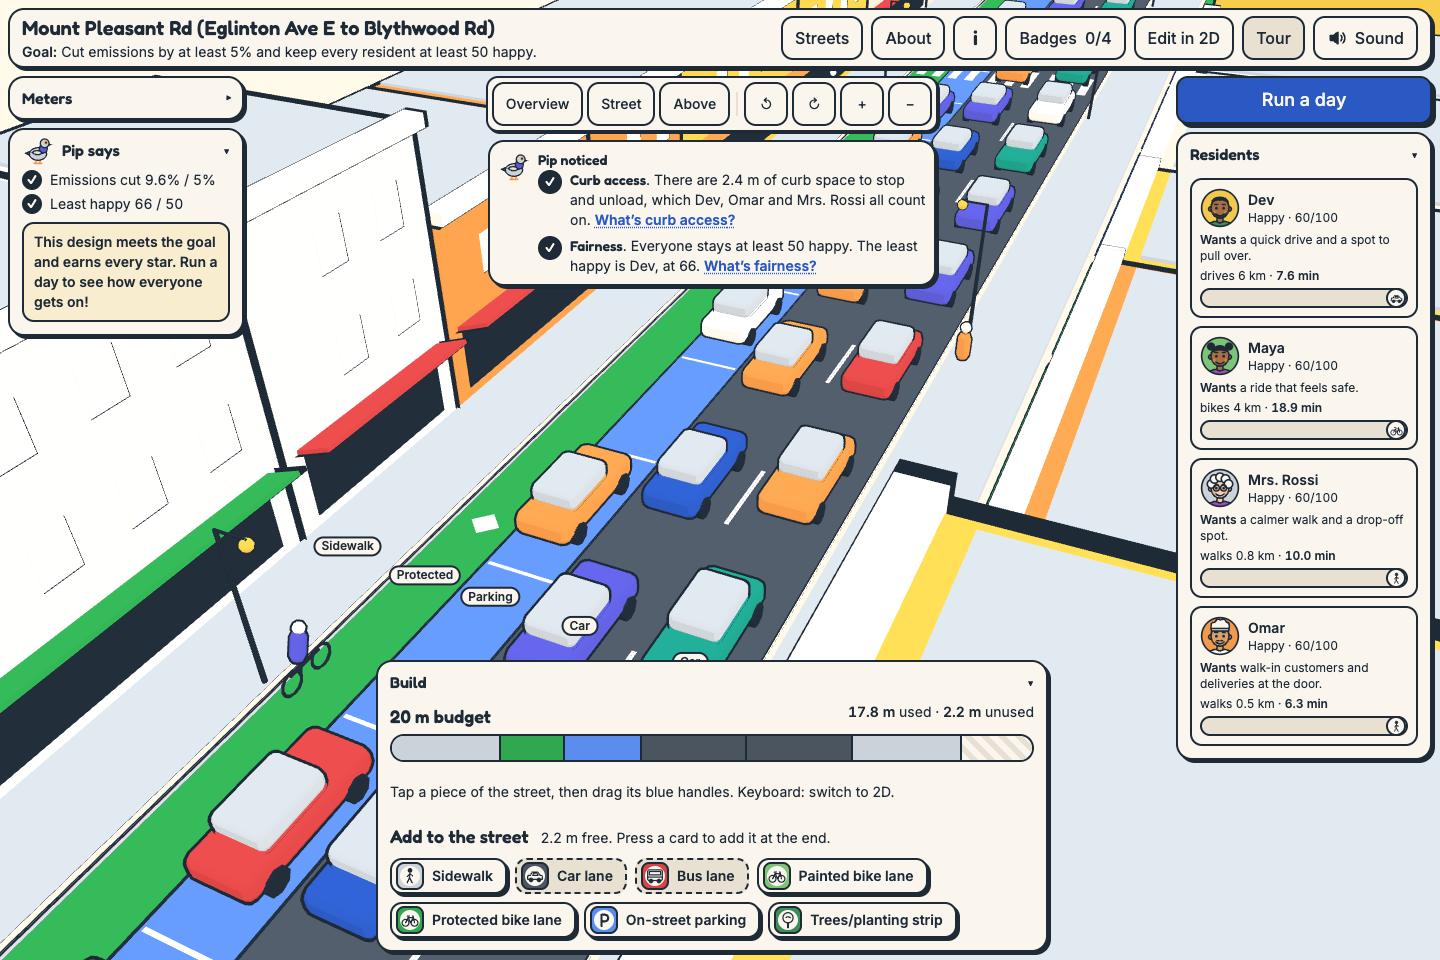
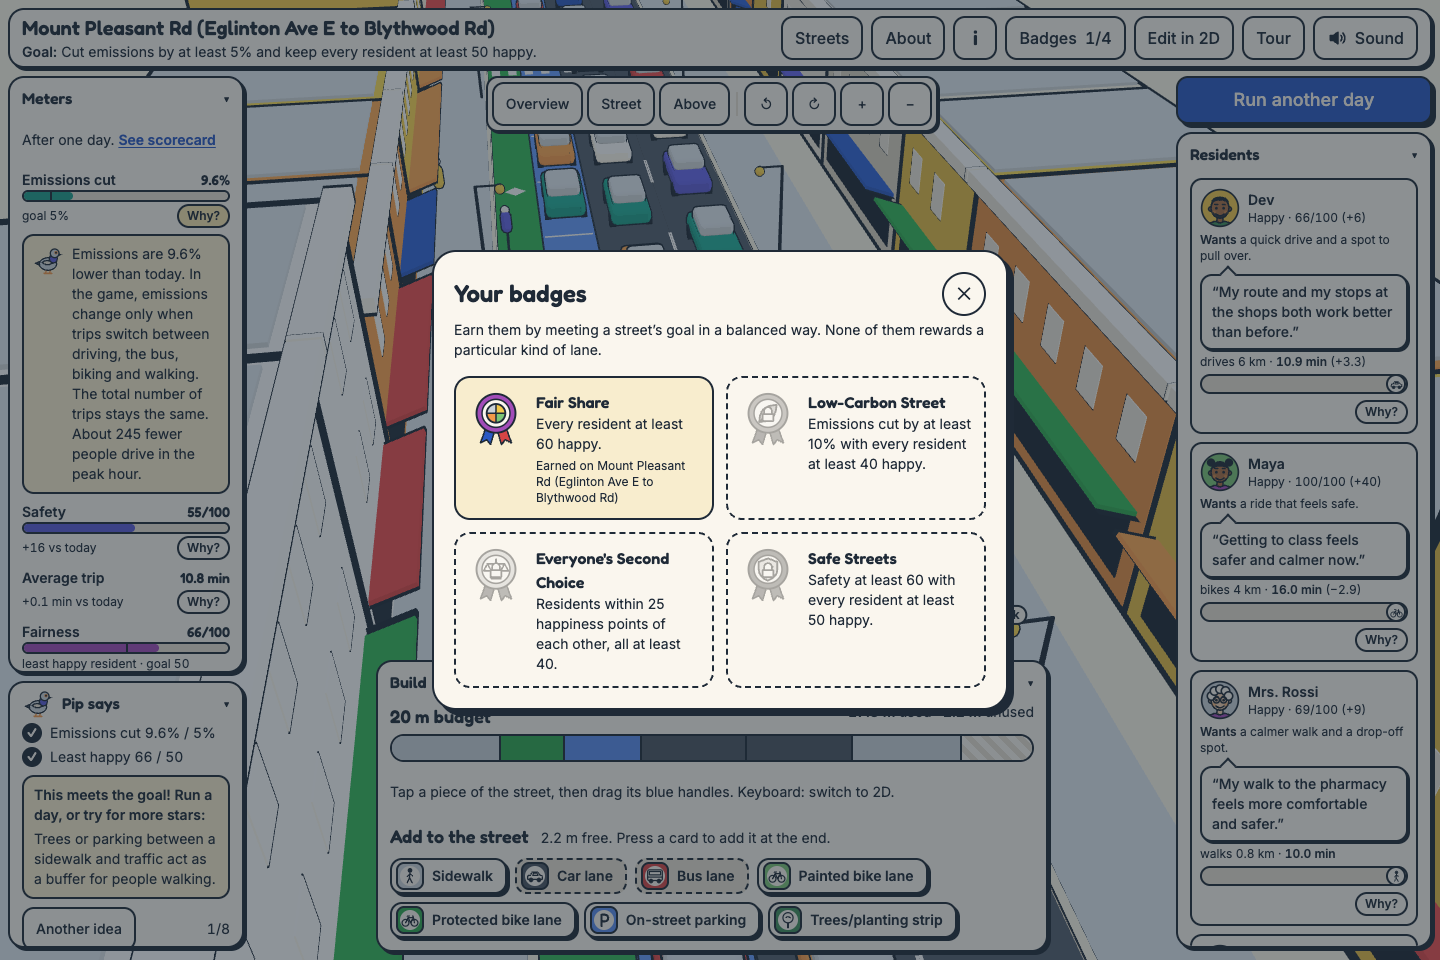
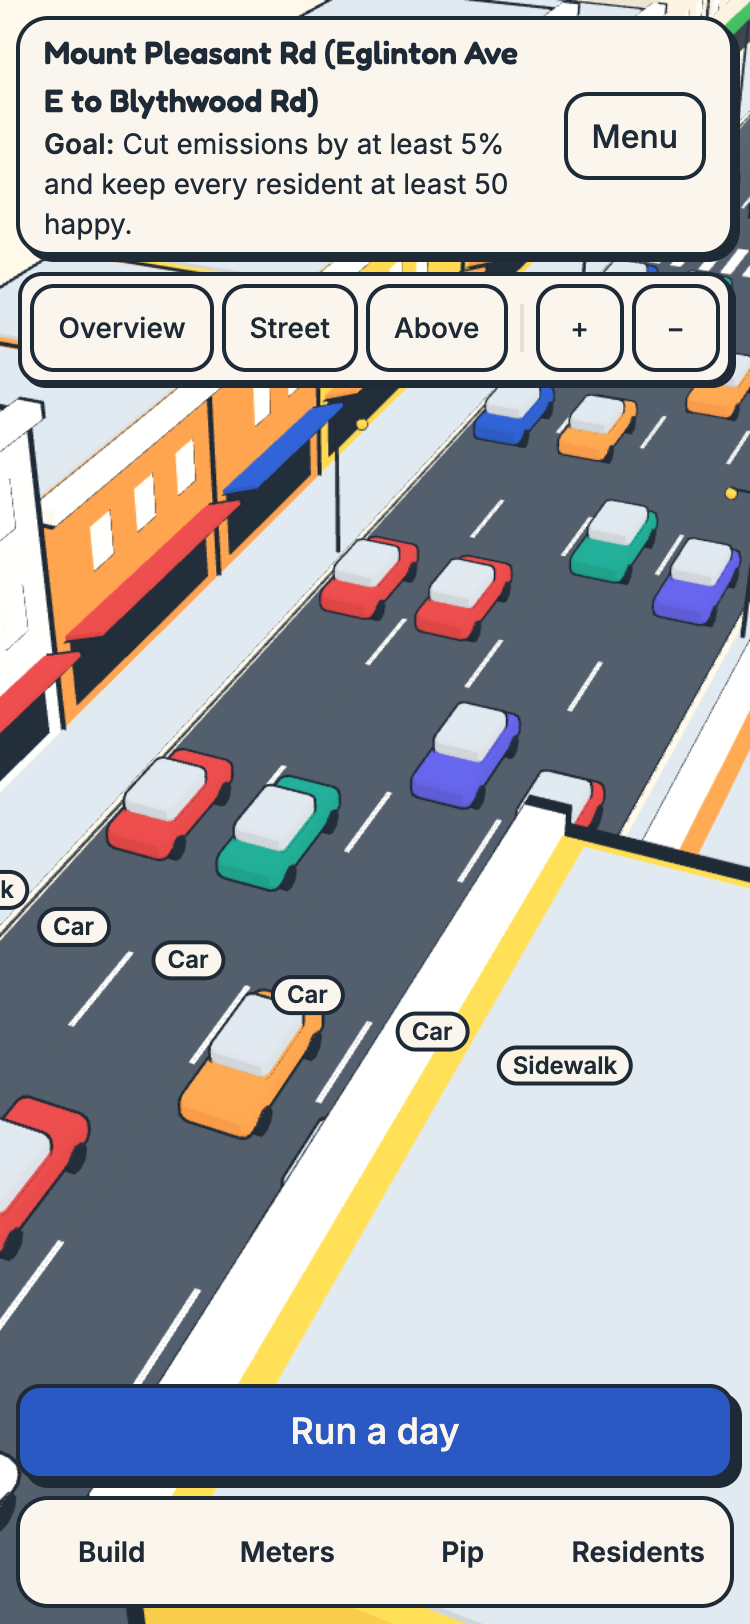
- Level 1: Mount Pleasant Rd, Eglinton Ave E to Blythwood Rd. 20 m wide and 1.1 km long, with four car lanes and no bike lanes today. Goal: cut emissions by at least 5% and keep every resident at least 50/100 happy. You'll learn how a road diet frees up space, and why emissions fall only when some trips switch to the bus, a bike or walking (mode shift).
- Level 2: Bloor St W, Christie St to Ossington Ave. 20 m wide and 0.61 km long, with cycle tracks from 2016 and 2020. Goal: raise the safety index to at least 56 and keep every resident at least 50/100 happy. You'll learn how buffers and keeping bikes out of the door zone make a street safer, and why a fair street works for its least happy resident.
Build. Add, remove, resize and reorder sidewalks, car lanes, a bus lane, painted or protected bike lanes, parking and trees within the street's fixed width.
- Edit in 3D (tap a piece, drag its handles) while cars, buses, bikes and people move along the lanes you build.
- Or switch to a 2D view from above that also works fully by keyboard and screen reader.
- As you build, short lessons appear when a change brings up a planning idea, such as a painted bike lane beside parking putting riders in the door zone.
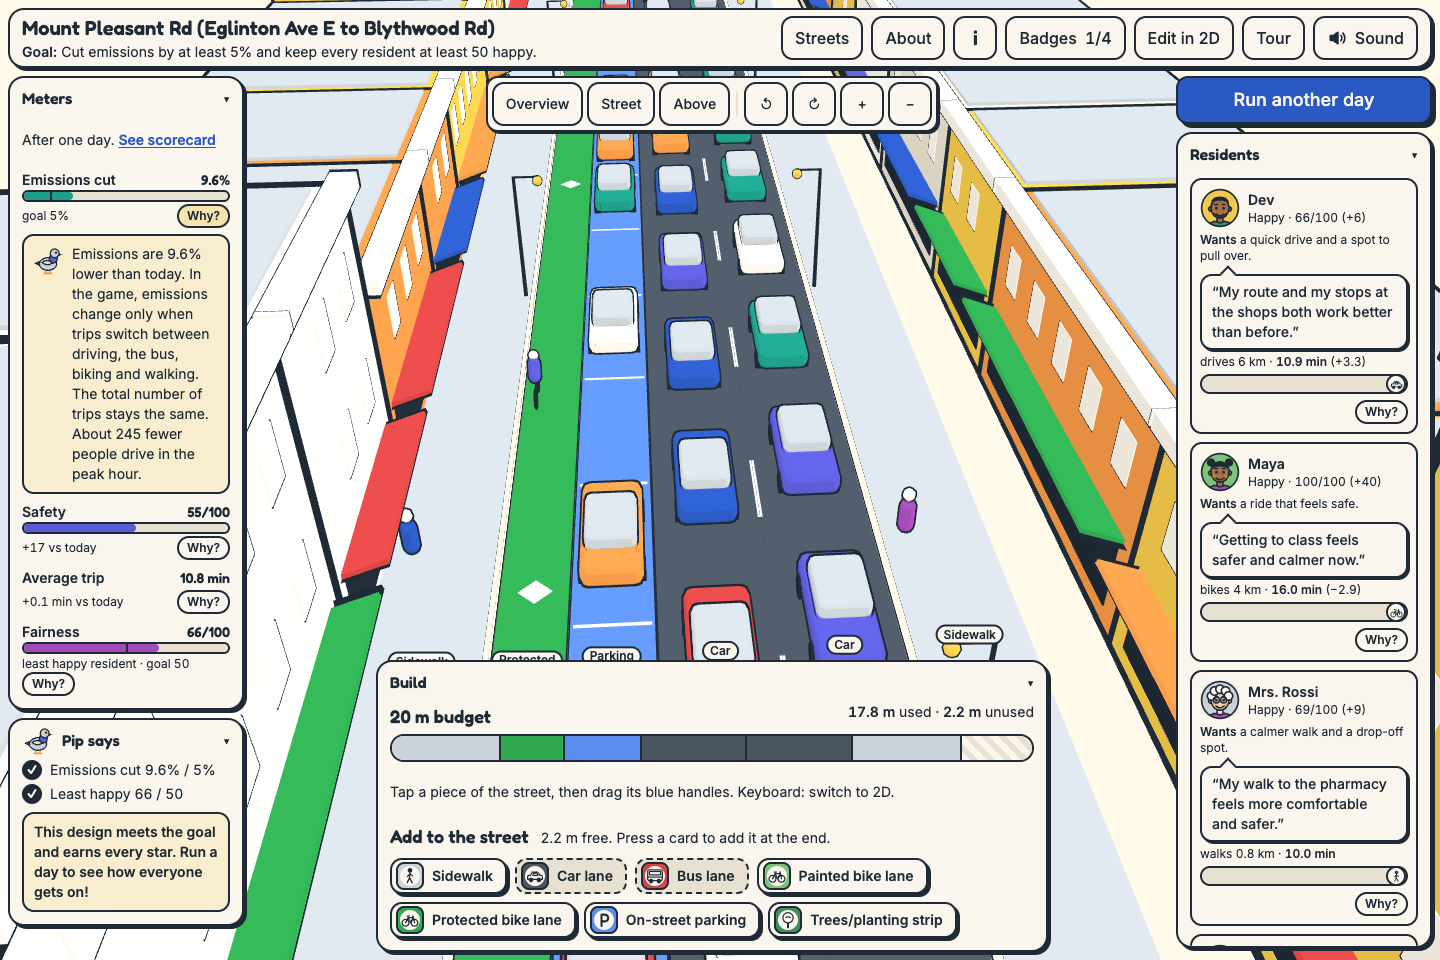
Run a day. A transparent model estimates emissions (kg CO₂e and the % change against today), a safety index, travel times, and how happy each resident is with their trip.
Scorecard.
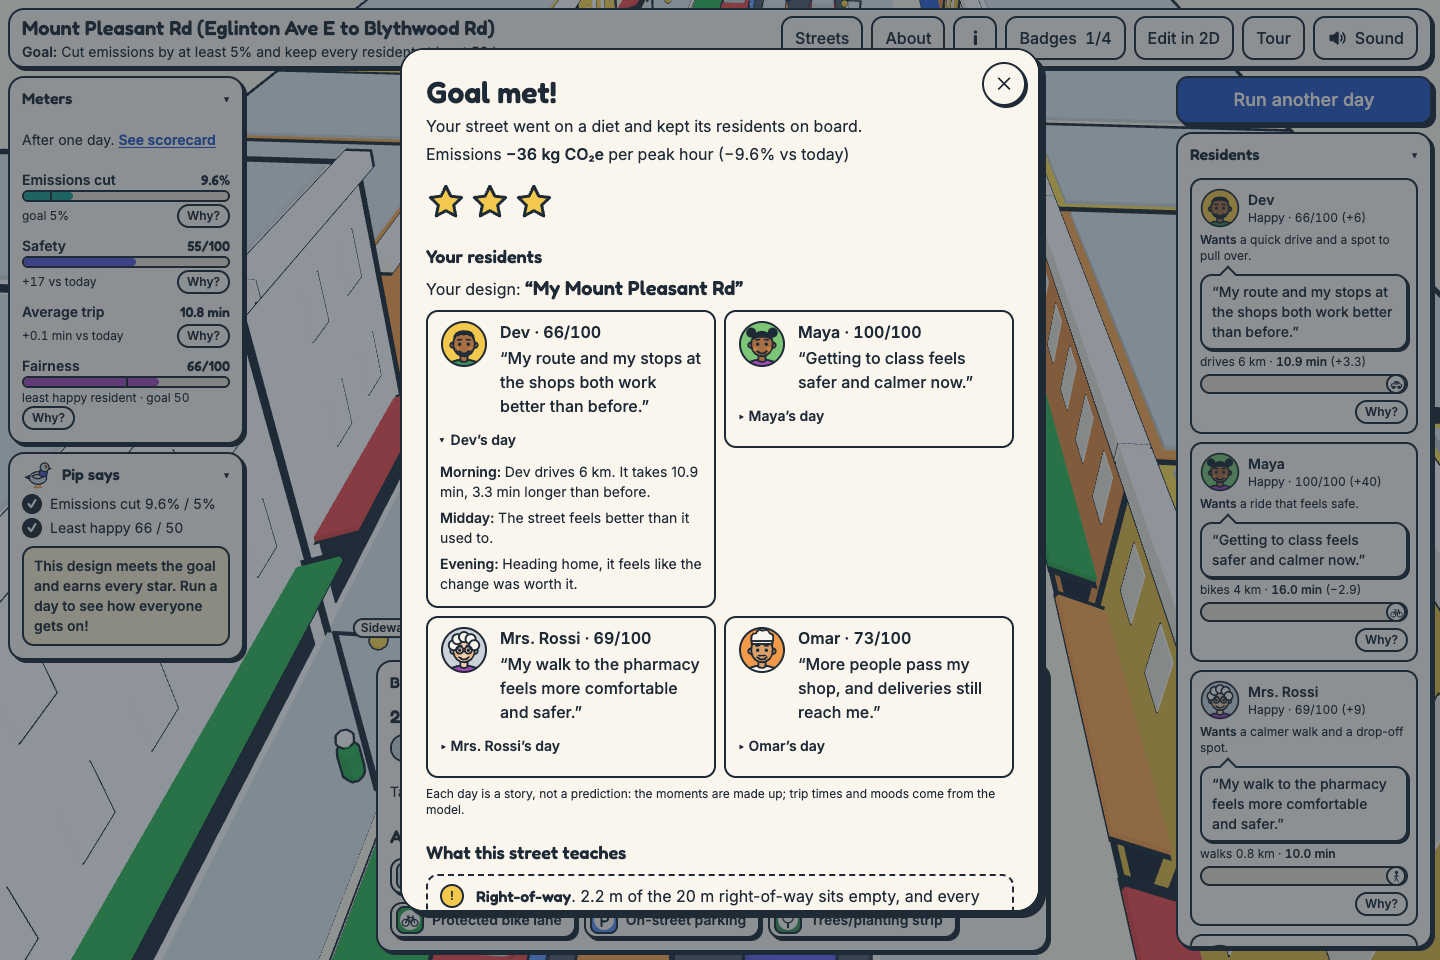
- Each resident reacts in their own words, and you can open the story of their day on your street (morning, midday, evening).
- Your design gets a short name.
- Ask Pip "Why?" on any meter or resident to hear the cause in plain words.
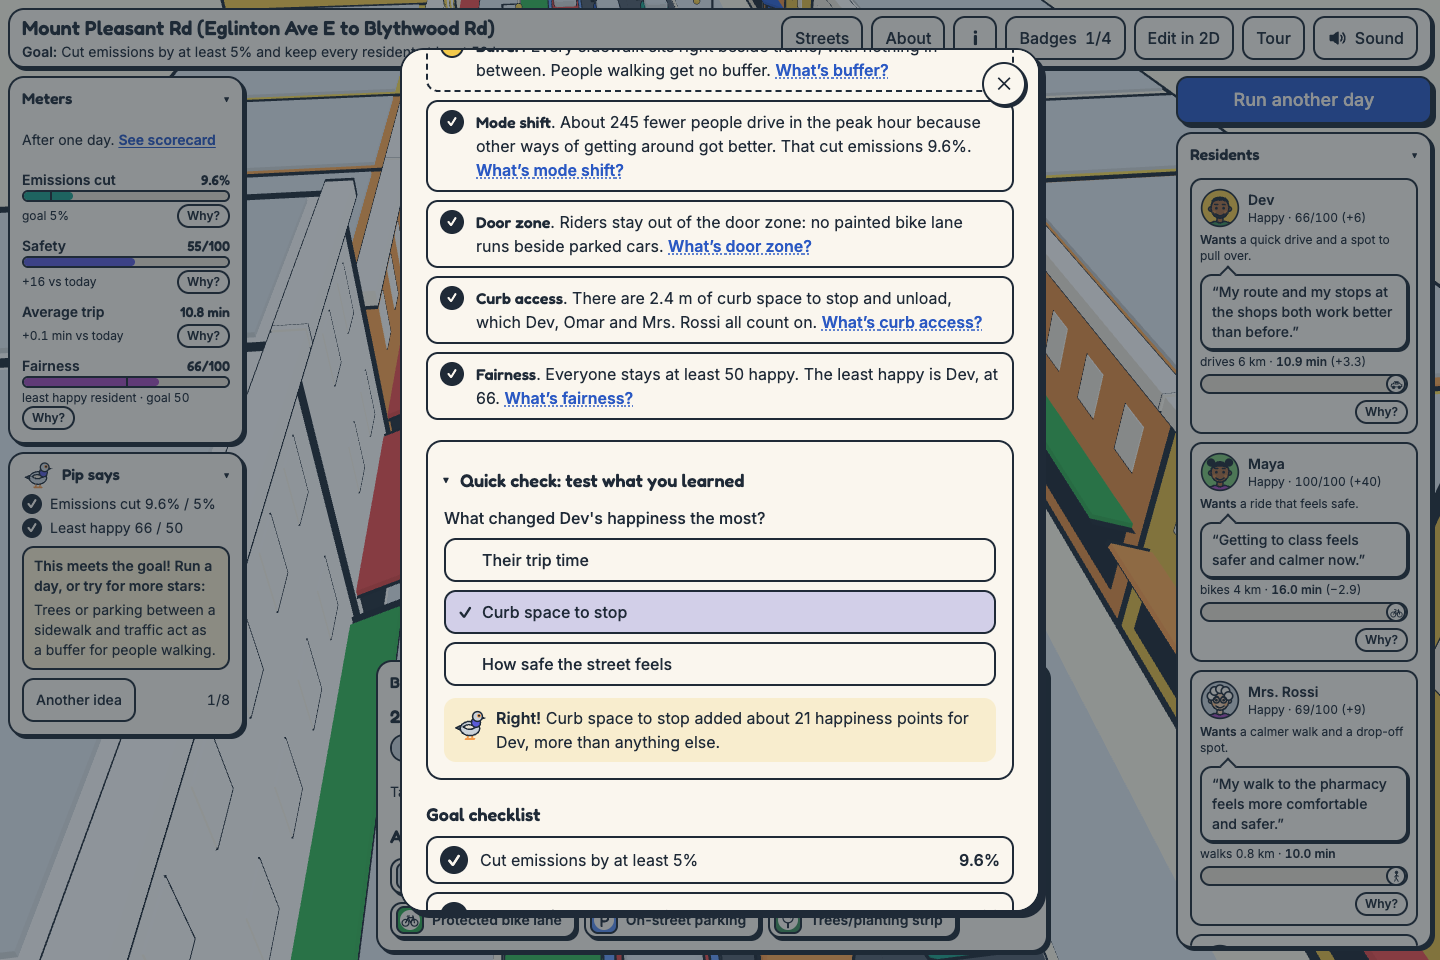
- A quick-check question about your own design tests what stuck.
- Goal checklist, stars, badges, and Pip's ideas for what to try next.
- A shareable postcard image of your street.
- A chart of how other players solved the same street.
- A visible Limitations panel.
Learning outcomes and audience
After a few runs, a player should be able to:
- Explain the street budget. A street has a fixed width, its right-of-way, so every metre given to one use comes from another.
- Predict mode shift. Say which changes make some people switch from driving, and why a new layout only cuts emissions by changing how people choose to travel.
- Spot safer layouts. Recognise buffers between people and traffic, keep bikes out of the door zone, and notice how many lanes people have to cross.
- Judge fairness. Look at a design through its least happy resident, and find a change that helps them without failing someone else.
- Read data critically. Tell measured numbers from estimates, find where each number comes from, and see what open data can't tell you.
- Use the words planners use. Right-of-way, road diet, mode shift, door zone, buffer and curb access.
How it teaches. By trying things. An idea that fails teaches as much as one that works. The planning idea behind a change appears when it happens, "Why?" answers any surprise, and the residents turn a percentage into a person.
Who it's for. Students in geography, civics, environmental science or urban planning; teachers looking for a short, hands-on activity (one street per lesson, in a browser, with no account or install); and neighbours who want to understand the trade-offs of changes to their street. No planning background is needed.
School of Cities questions
- Who is the user? Students and teachers learning how cities work, and Toronto residents who hear about changes to their street and want to understand the trade-offs.
- What problem are they facing? Every metre of a street given to one use is taken from another, but those trade-offs are hard to see in the debate. The data behind them is spread across many City datasets and reports, and none of it shows what a change would mean for the people who use the street.
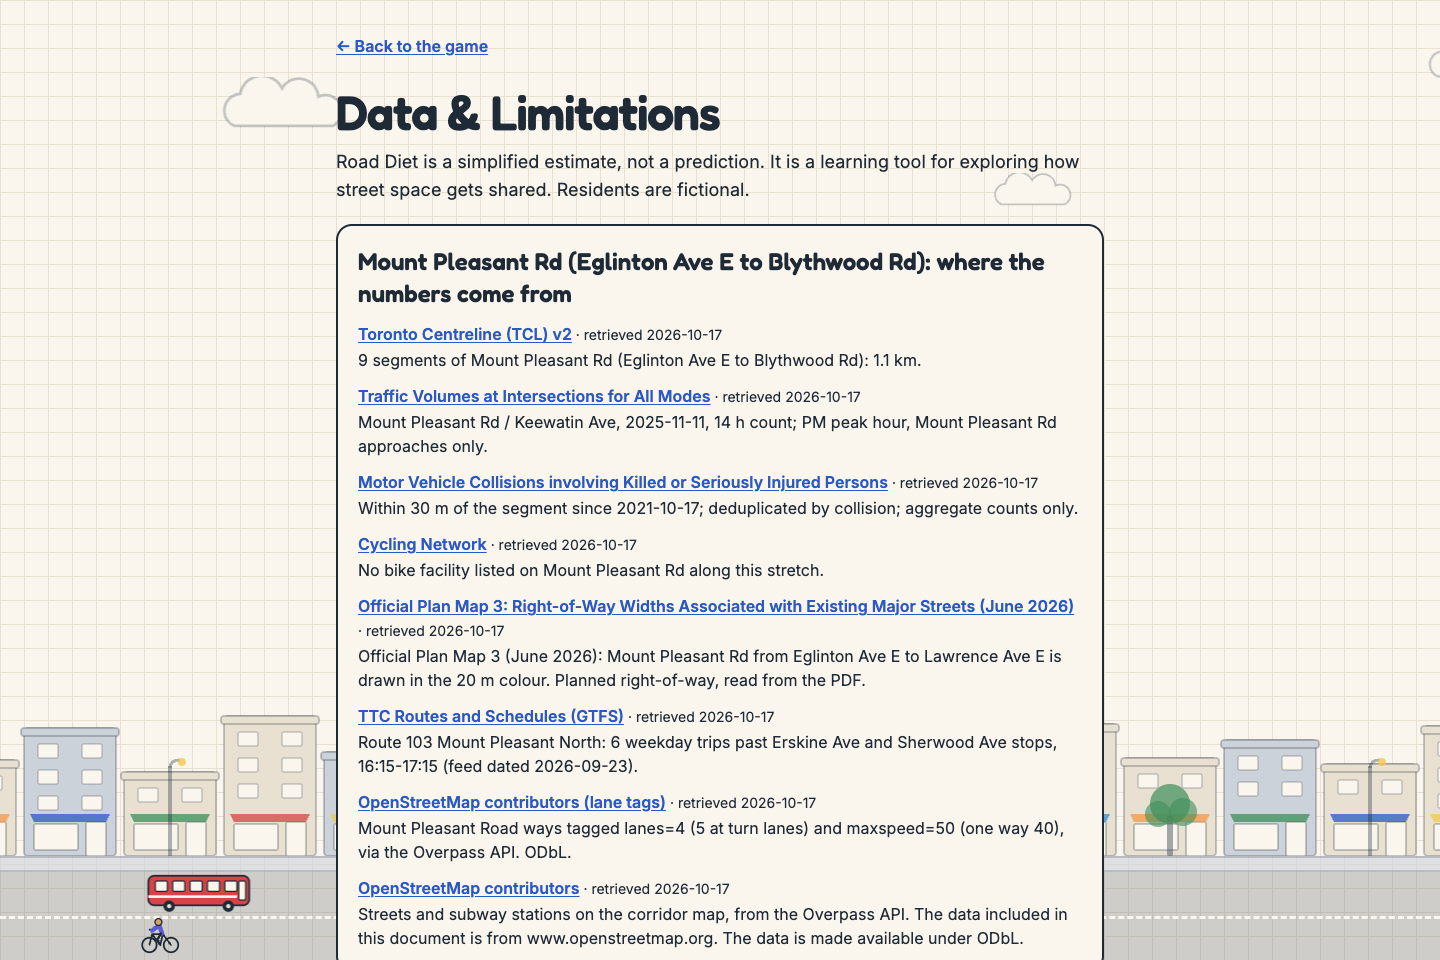
- How can we solve it with the data we have? Each level starts from real City of Toronto data for its corridor:
- length from the Toronto Centreline
- the planned 20 m right-of-way from Official Plan Map 3
- peak-hour car, bike and pedestrian volumes from a City intersection count (Mount Pleasant Rd / Keewatin Ave, 2025-11-11; Bloor St W / Shaw St, 2025-06-25)
- collisions where someone was killed or seriously injured (KSI) within 30 m in the last five years, as aggregate counts
- existing bike facilities from the Cycling Network
- bus service from TTC GTFS (route 103 on Mount Pleasant: 6 buses in the PM peak hour)
- streets, lanes and subway stations from OpenStreetMap
The briefing opens with a map of the corridor drawn from this data. Lane widths follow the City's Lane Widths Guideline, lane capacities NACTO, and emission factors UK DESNZ. Every source and every estimate is listed in the app at https://roaddiet.design/data.
- How does it benefit the user? It makes trade-offs concrete and personal. Players see the effect of a design through residents' eyes, not only as totals, and each result is explained in plain language. The game always says what the model cannot know, and it is neutral by design: stars and badges reward meeting the goal, fairness and balance, never adding or removing a particular kind of lane.
Prize sections
Best Climate Action & Sustainability.
- Every scorecard shows estimated peak-hour emissions in kg CO₂e and the % change against today's street.
- Level 1's goal is an emissions cut, so every win there is a climate result. The Low-Carbon Street badge needs a 10% cut with nobody left below 40/100 happy.
- The game teaches the cause, not just the number. Emissions change only through mode shift. Pip's "Why?" on the emissions meter says how many fewer people drive and why. The quick check can ask whether emissions fell because of cleaner engines, fewer trips or people switching (only the last is how the model works).
- Emission factors: UK DESNZ 2024, "average car" 0.16691 kg CO₂e/km and "average local bus" 0.10846 kg CO₂e/passenger-km.
MLH Best Use of Gemini API. Gemini (gemini-3.5-flash, REST generateContent in JSON mode) gives the game its voice in four places:
- Reactions and debrief. Each resident's reaction to your design, and a short debrief that always names one model limitation.
- Design name and residents' days. A playful name for your street, and a three-panel story of each resident's day on it.
- Pip's "Why?" A two-sentence answer to "why did this change?" on any meter or resident.
- Quick check. Gemini picks the most useful question for your design from a set the model built, and words it.
- A fifth use, a generated postcard illustration, is wired up, but image-model quota wasn't available, so the game draws its own postcard instead.
How it stays grounded:
- Gemini never decides a result. Our tested TypeScript model computes every number and builds a list of true facts about the design. Gemini only gets those facts.
- Any number in a "Why?" or quick-check reply must appear in the facts, or the reply is thrown out.
- Quiz answers come from the model, never from Gemini, so the right answer is always right.
- Replies are schema-checked, length-capped and filtered for political words.
- Every failure (a timeout, a rate limit, a bad reply) falls back to built-in text, so the game never breaks. A "Powered by Gemini" label shows only when the text really came from Gemini.
- The key stays on the server.
MLH Best Use of Tiger Data.
- Every run is stored in a TimescaleDB hypertable (
runs, partitioned oncreated_at). - A continuous aggregate (
runs_hourly, refreshed every 30 minutes, with real-time aggregation so new runs show at once) stores hourly plays, star counts and emission sums per level. It feeds the scorecard chart "How others solved this street" and the average emissions cut. - Compression is enabled on
runs, segmented by level, with a 30-day policy. - A percentile query on the raw hypertable powers "your least happy resident is happier than in N% of earlier runs".
- Seeded demo runs are flagged with a
democolumn and labelled in the chart. - Live: https://roaddiet.design/api/stats/mount-pleasant-eglinton-blythwood returns real plays from the database.
MLH Best Use of Vultr.
- The production game, its API and the Caddy reverse proxy with automatic HTTPS run on a Vultr instance, deployed by
deploy/setup.sh. - The info panel on every page says "Hosted on Vultr."
MLH Best Domain Name from GoDaddy Registry.
- Domain: https://roaddiet.design. A road diet is a design choice, and the game is about designing a street.
Best Solo Hack.
- Built solo; the Devpost team has one member.
- Everything in the repo was built during the event, from the first commit on 2026-10-16 at 22:32 (UTC−4).
- Built with an AI coding assistant (Claude Code).
Responsible interpretation
- Every page says "A learning tool, not a forecast. Residents are fictional." (in the footer, or the info button when the footer is hidden).
- The Limitations panel sits on the scorecard itself. It lists the cap on how many trips switch mode, that safety is a layout index and not a collision forecast, every value still waiting for a source, and every game-design parameter.
- Estimates in the corridor data are flagged in the app: today's lane layout, the speed limit, car occupancy, and 40 riders per bus on Mount Pleasant (assumed, not sourced).
- No neighbourhood rankings. The only comparison is with other runs of the same street.
- Three-star designs exist with one car lane and with two on Mount Pleasant, and a test checks that.
- An automated test fails the build if game copy uses the words vote, election, party or candidate. Every Gemini prompt forbids political topics, and a filter replaces any reply that mentions them.
How we built it
- Client: React 19, Vite, Tailwind CSS v4, Motion, and Three.js for the editable 3D street (procedural models, no asset files), and Web Audio for short synthesized sounds.
- Server: Express 5 and zod, plus
pgfor Tiger Data / TimescaleDB. - Model: pure TypeScript functions shared by the client and server, with vitest tests. Every constant is tagged with its source or marked as a design choice. The same code builds the facts that ground Gemini.
- Data prep: a Python script (
data/prep/prep.py) that pulls only corridor-sized extracts from Toronto Open Data, TTC GTFS and OpenStreetMap, and draws each briefing's corridor map as a static SVG (no map tiles or API keys at play time). - Accessibility: keyboard-complete 2D editor, screen-reader labels, reduced-motion support, and axe checks at phone and desktop widths.
Data sources
These are the sources used in the game, also listed in the app at https://roaddiet.design/data.
- Toronto Centreline (TCL) v2: https://open.toronto.ca/dataset/toronto-centreline-tcl/
- Traffic Volumes at Intersections for All Modes: https://open.toronto.ca/dataset/traffic-volumes-at-intersections-for-all-modes/
- Motor Vehicle Collisions involving Killed or Seriously Injured Persons: https://open.toronto.ca/dataset/motor-vehicle-collisions-involving-killed-or-seriously-injured-persons/
- Cycling Network: https://open.toronto.ca/dataset/cycling-network/
- TTC Routes and Schedules (GTFS): https://open.toronto.ca/dataset/ttc-routes-and-schedules/
- Official Plan Map 3, Right-of-Way Widths (June 2026): https://www.toronto.ca/wp-content/uploads/2026/06/98b4-CityPlanning-Map-3-ROW-Widths-Associated-with-Existing-Major-Streets.pdf
- City of Toronto Lane Widths Guideline v3.0 (2025): https://www.toronto.ca/wp-content/uploads/2025/11/96f7-Lane-Widths-Guideline-Version-3.0.pdf
- NACTO Transit Street Design Guide, "Designing to Move People" (read through this excerpt): https://archive.strongtowns.org/journal/2016/5/23/excerpt-from-nacto-transit-street-design-guide
- UK DESNZ Greenhouse gas reporting conversion factors 2024: https://www.gov.uk/government/publications/greenhouse-gas-reporting-conversion-factors-2024
- OpenStreetMap contributors (lane and speed tags on Mount Pleasant Rd; streets and subway stations on the corridor maps; ODbL): https://www.openstreetmap.org/copyright
Challenges
- Lane widths aren't in any open dataset, so today's layout on both streets is an estimate, flagged in the app.
- Bus riders per bus on Mount Pleasant isn't in an open dataset either. The game uses 40, labelled as an assumption.
- Bloor St W has the subway underneath and no daytime surface bus, so an emissions goal there made dropping a car lane the only way to win. Its goal became a safety goal, which several designs can meet.
- Keeping the scoring neutral: badges are gated on meeting the goal and keeping residents happy, because the unchanged street already scored as "fair".
- Keeping Gemini honest: the numbers check on every explanation, and building quiz answers in the model rather than asking Gemini for them.
What's next
- More Toronto streets, built by the same corridor pipeline.
- Use the collision data to scale the safety index, not only show it as context.
- Source the remaining constants listed on
/data, starting with bus riders per bus. - A teacher's guide with one lesson per street.
Built With
- caddy
- express.js
- gemini
- node.js
- postgresql
- react
- tailwindcss
- three.js
- tiger-data
- timescaledb
- typescript
- vite
- vultr


Log in or sign up for Devpost to join the conversation.