-
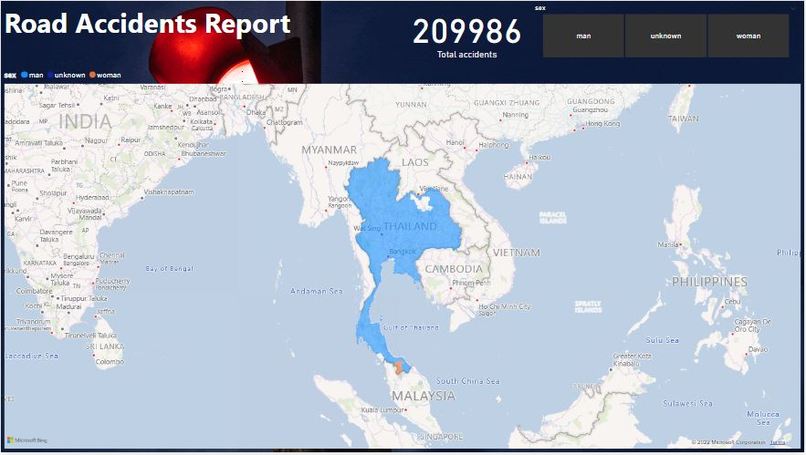
population of accidents happen by location
-
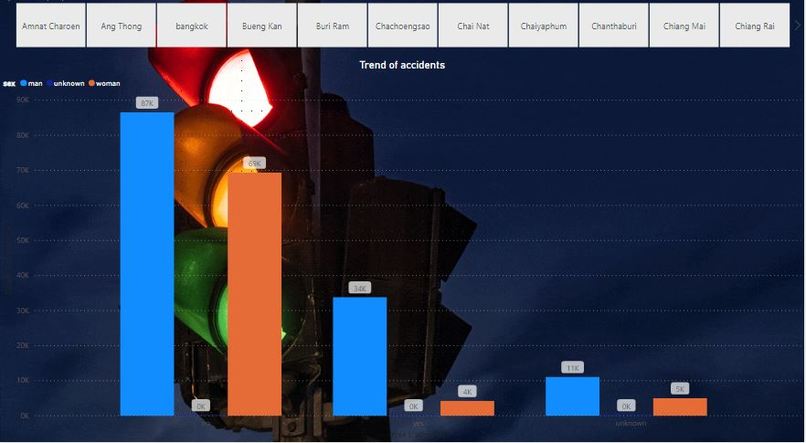
trend of accidents by gender
-

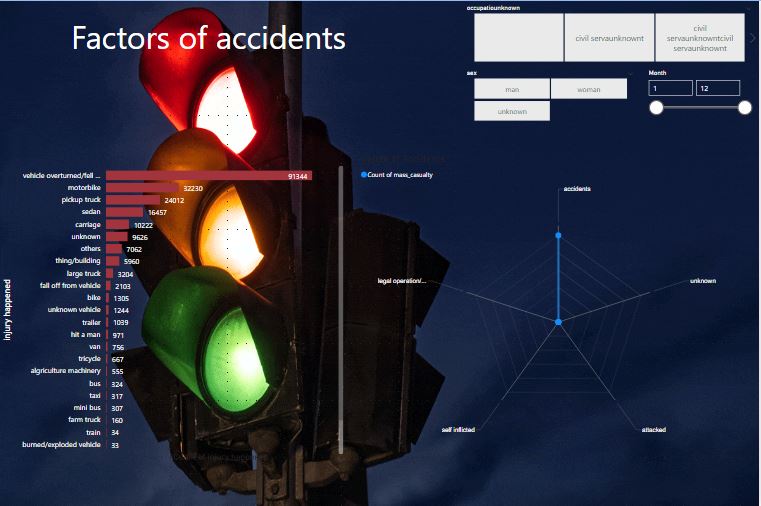
factors of accidents


Inspiration
Building an interactive report at one glance.
What it does
Provide info and summary of accidents report.
How we built it
Using Microsoft Power BI.
Challenges we ran into
To predicts future accidents.
What we learned
You won't realize what the values the data hold until you start to explore more depth.
Current status project
Dashboard to display data population of accidents by location, trends and factors of accidents.
What's next for Road Accidents Report - GDBi
-To display more impact and factors from other perspectives such as vehicle types impact, age affect or not, environment affect etc. -Prediction for future accidents, and which month and location should be wary using azure machine learning (still in building progress)
Built With
- powerbi


Log in or sign up for Devpost to join the conversation.