-
-
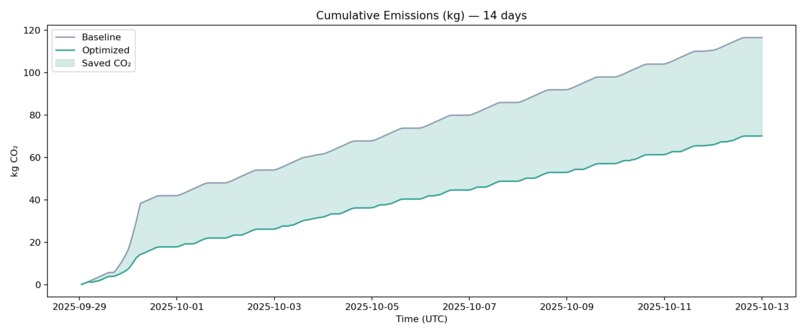
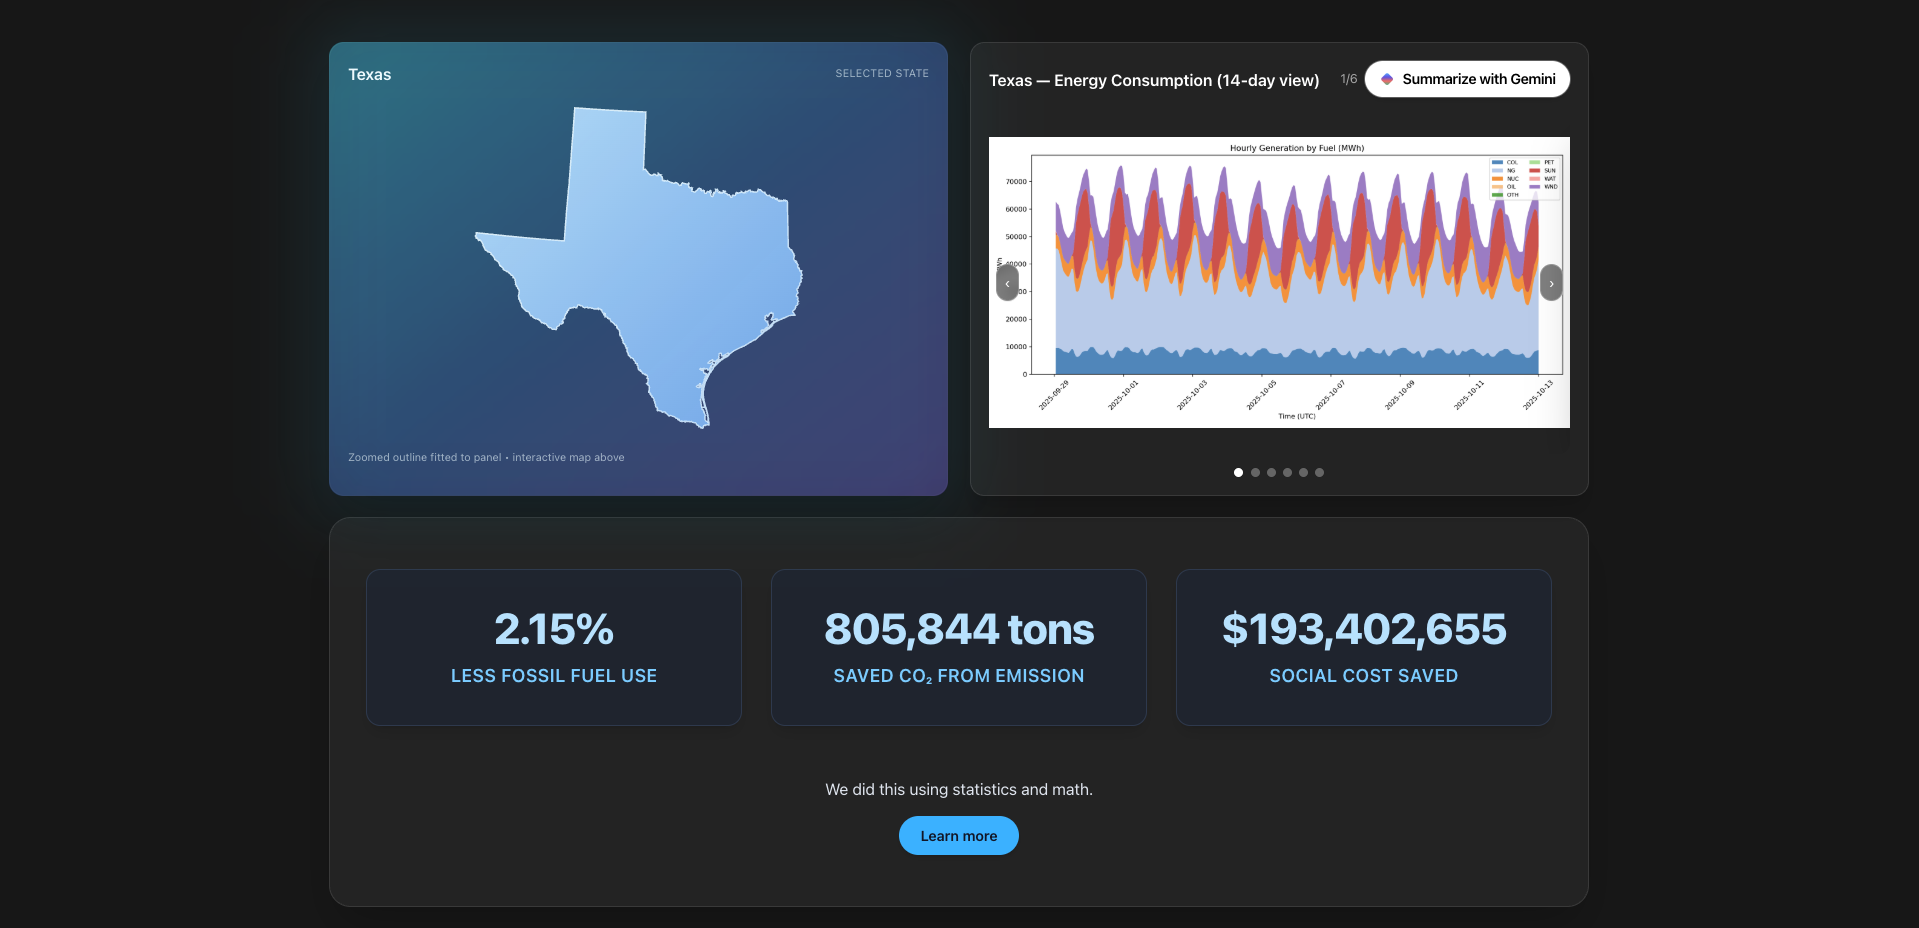
Tons of CO2 saved
-
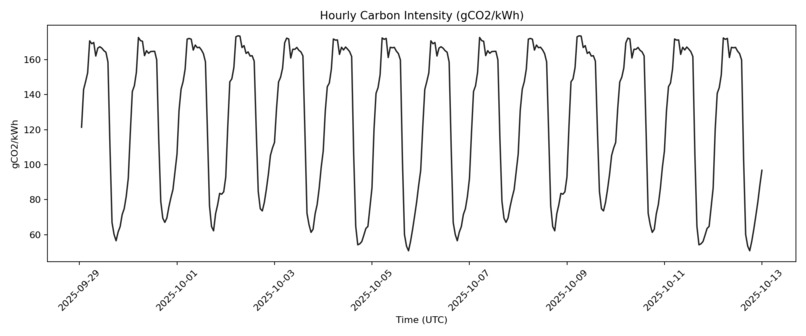
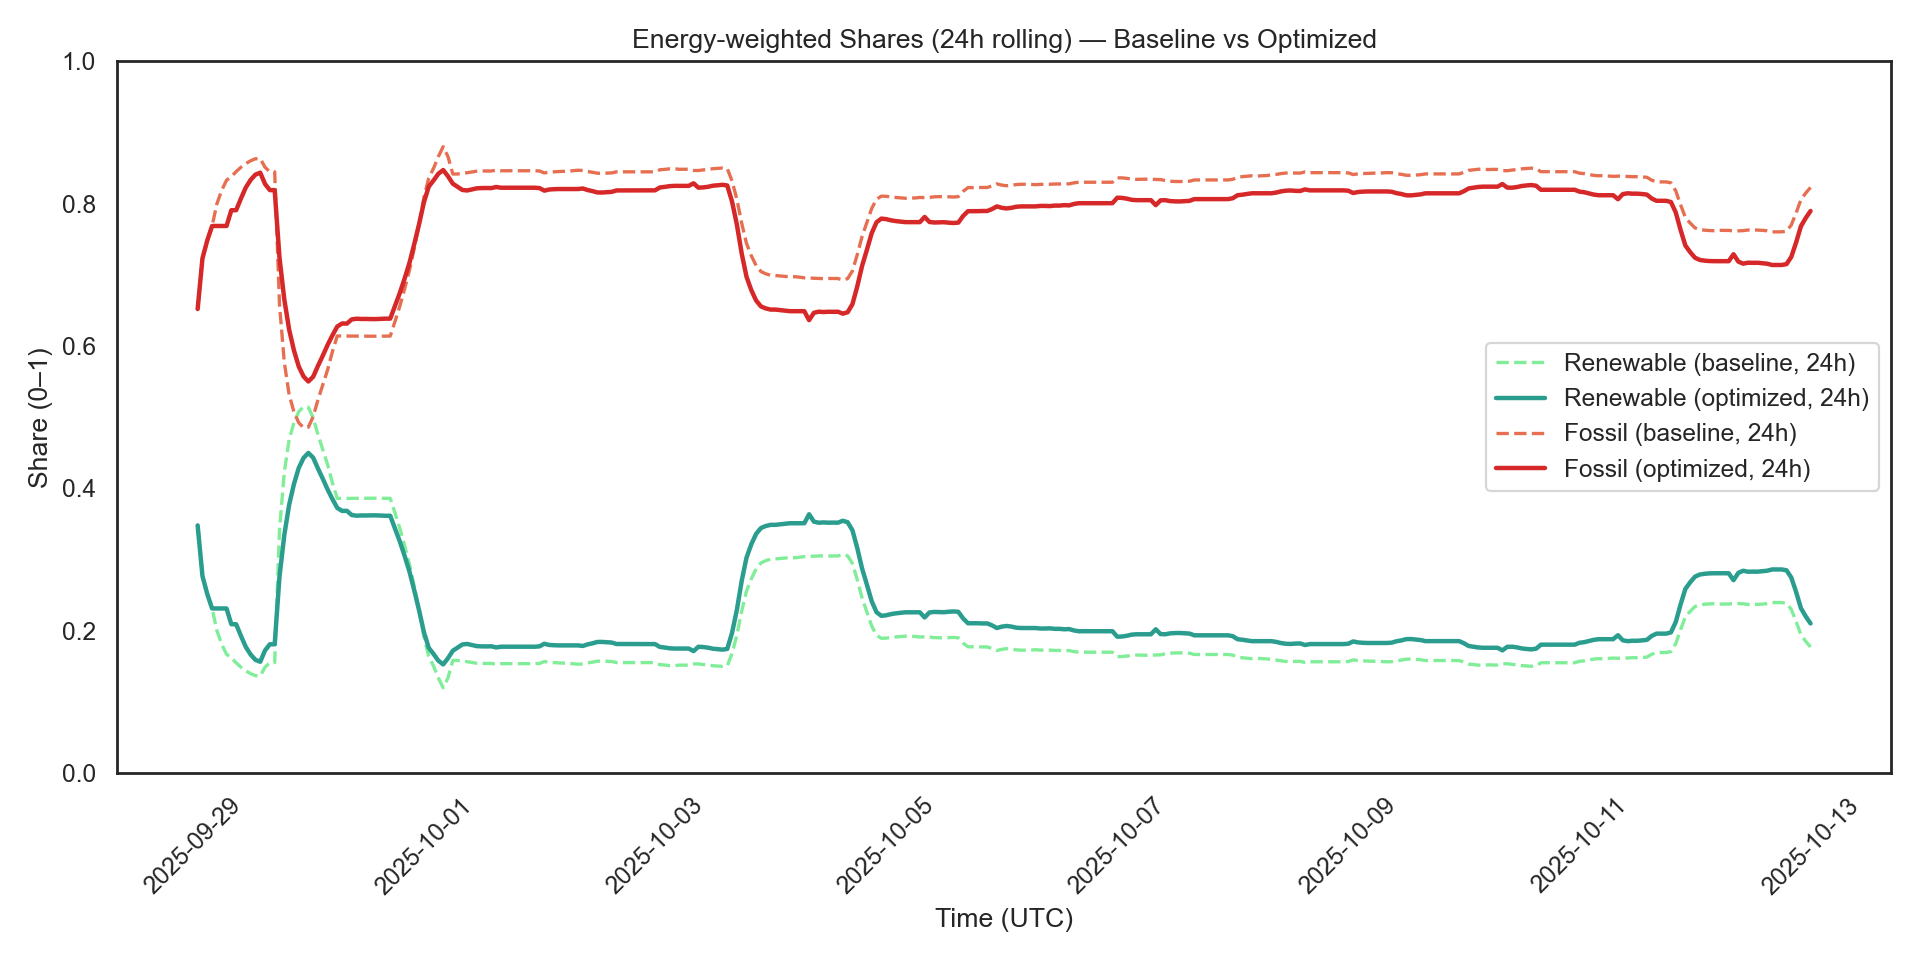
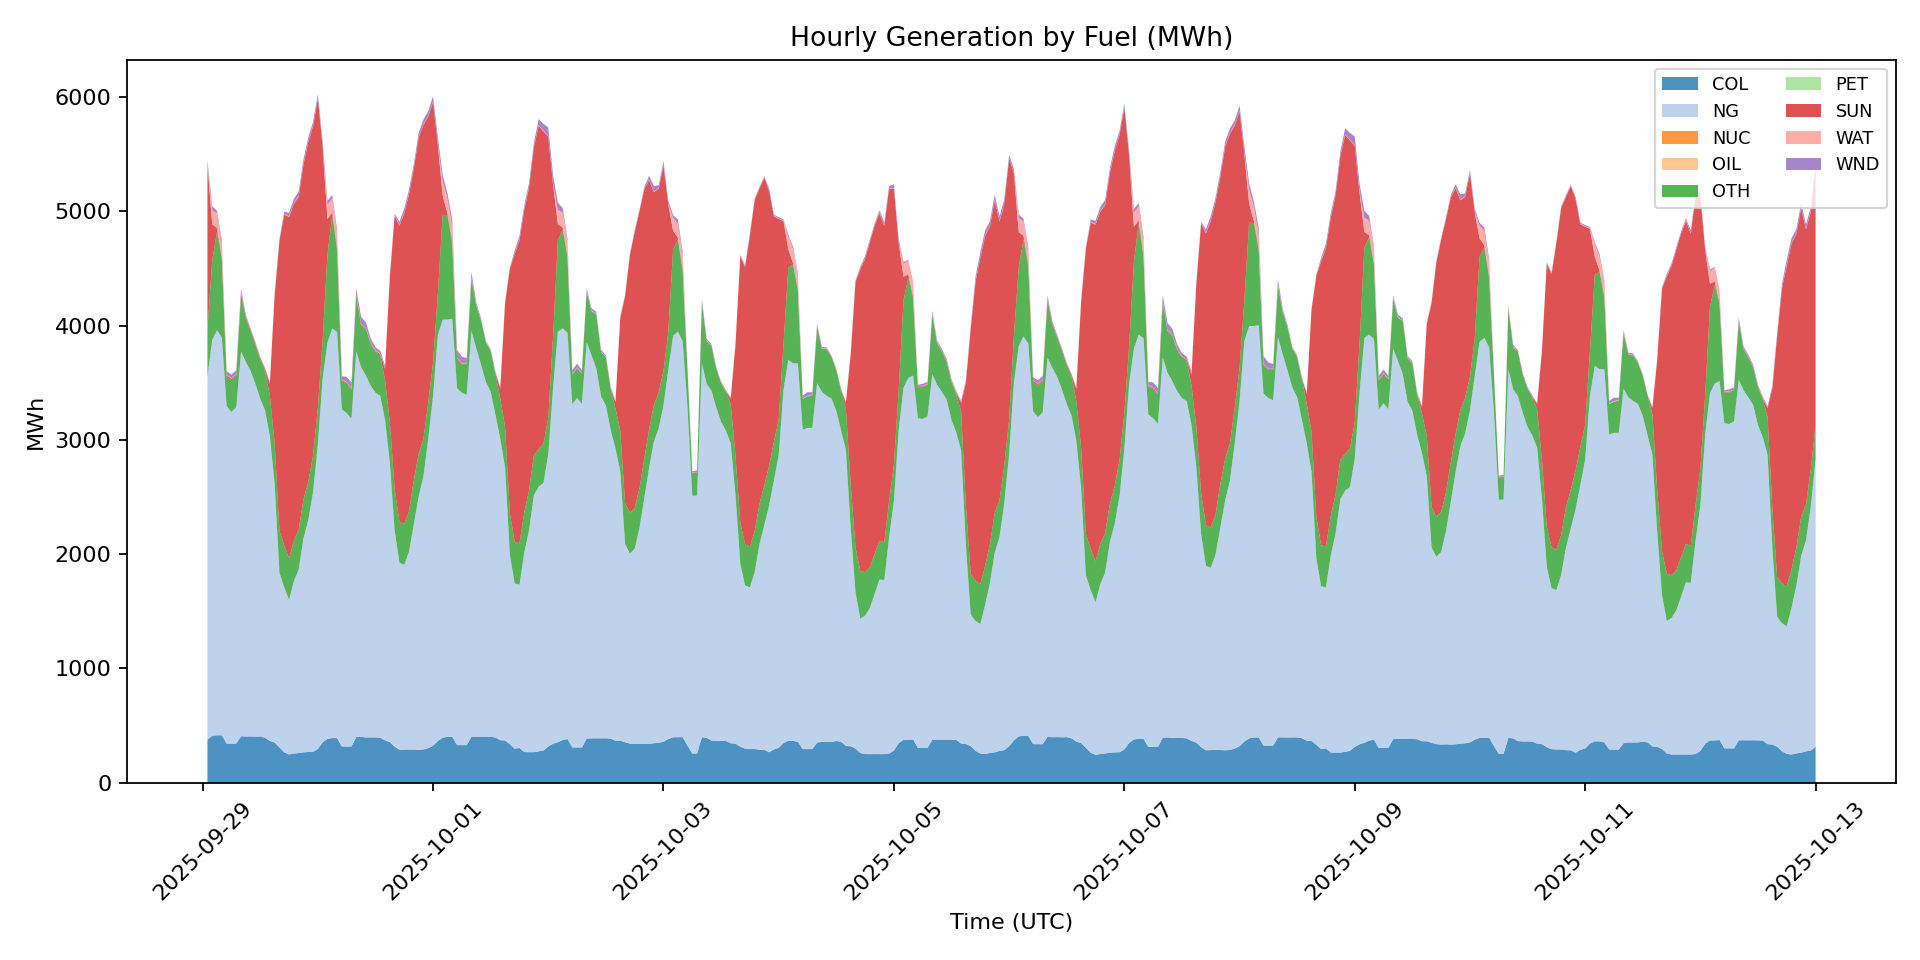
Analytical + Prediction Graph 2
-
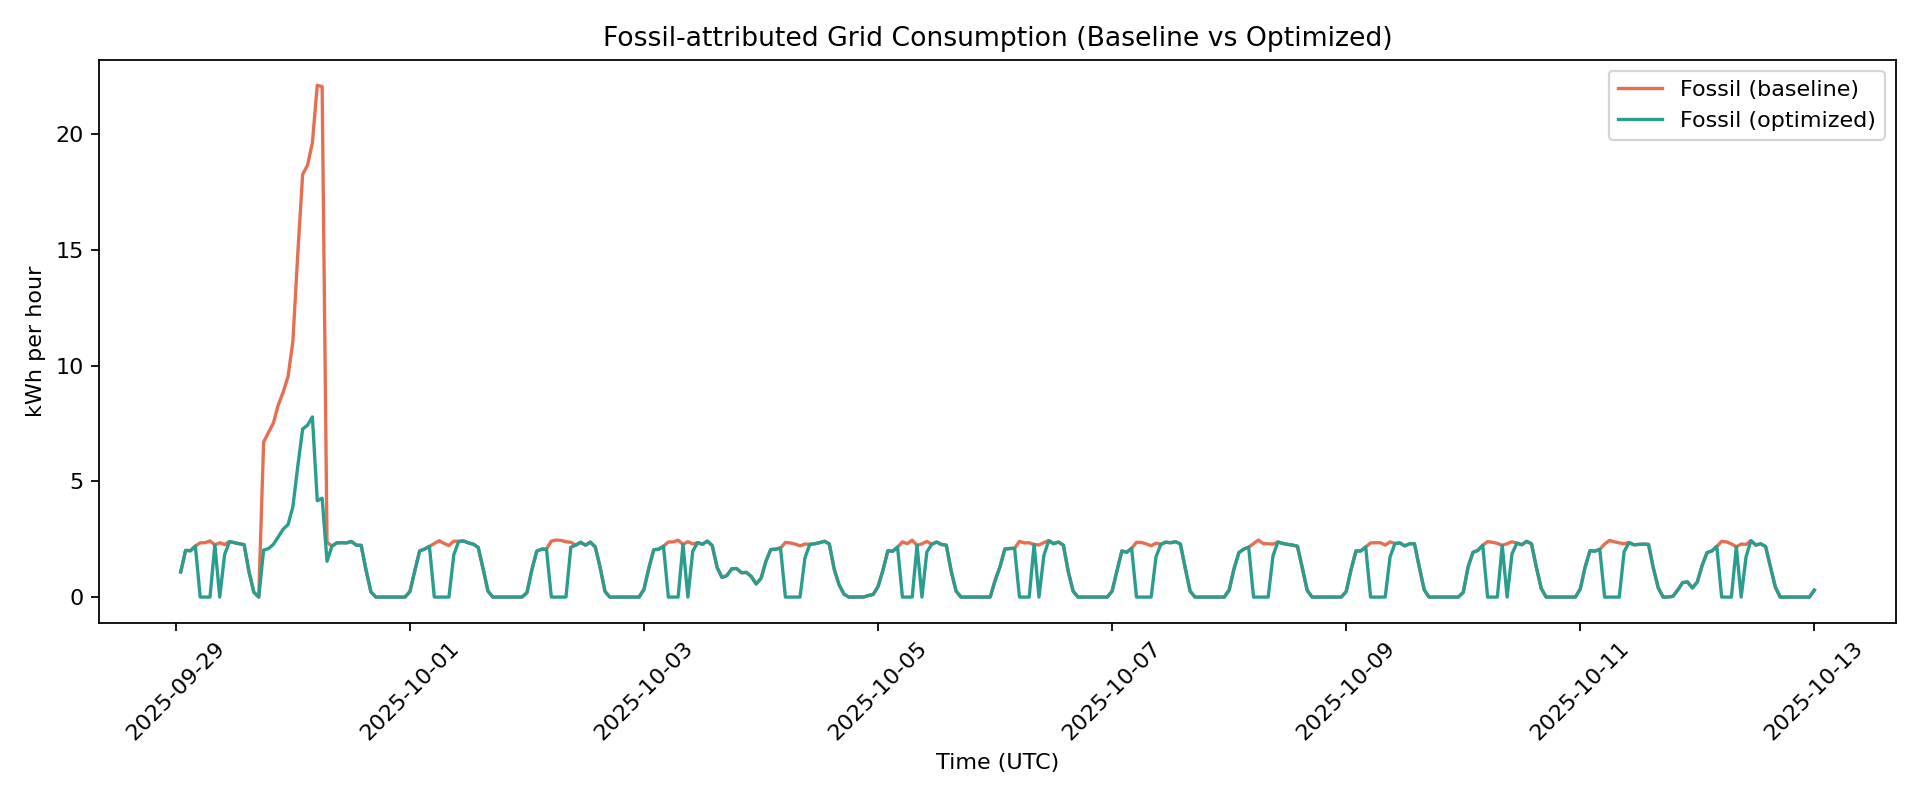
Analytical + Prediction Graph
-
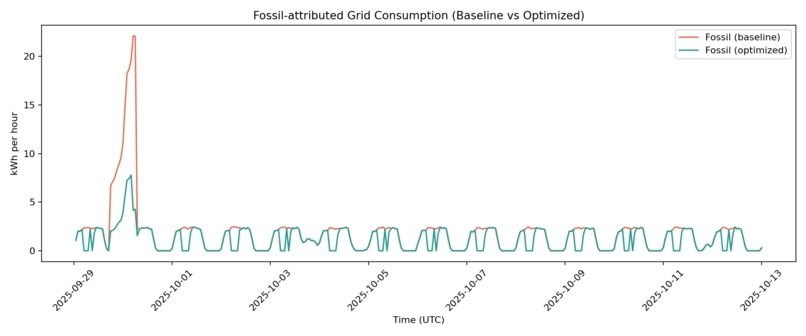
Descriptive + Prediction Graph 1
-
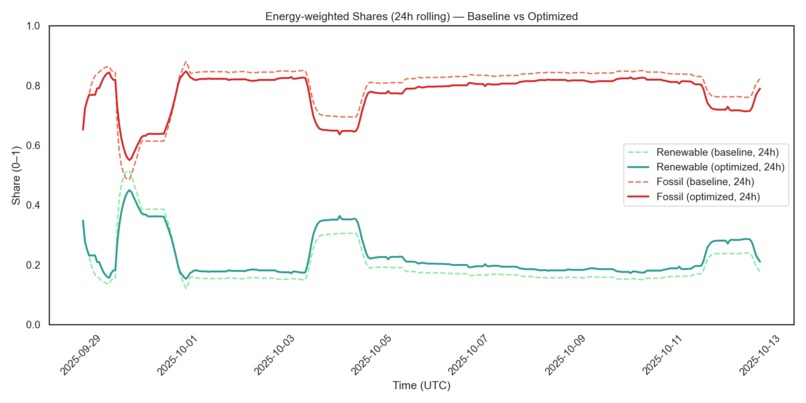
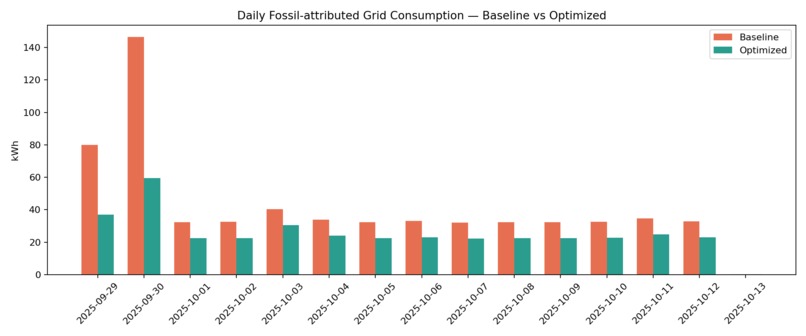
Base model v/s Optimized model
-
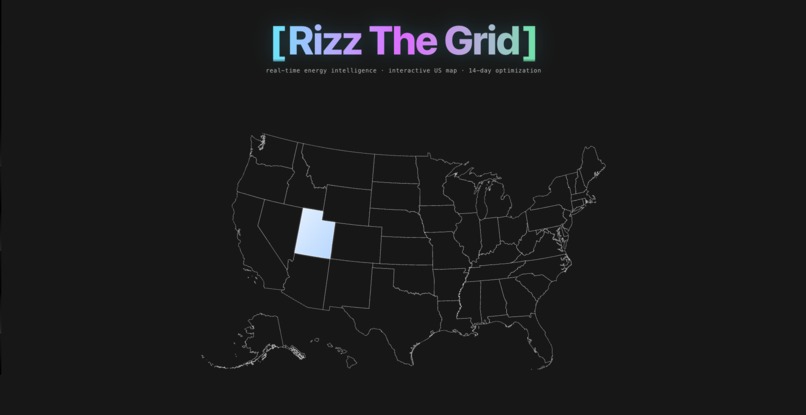
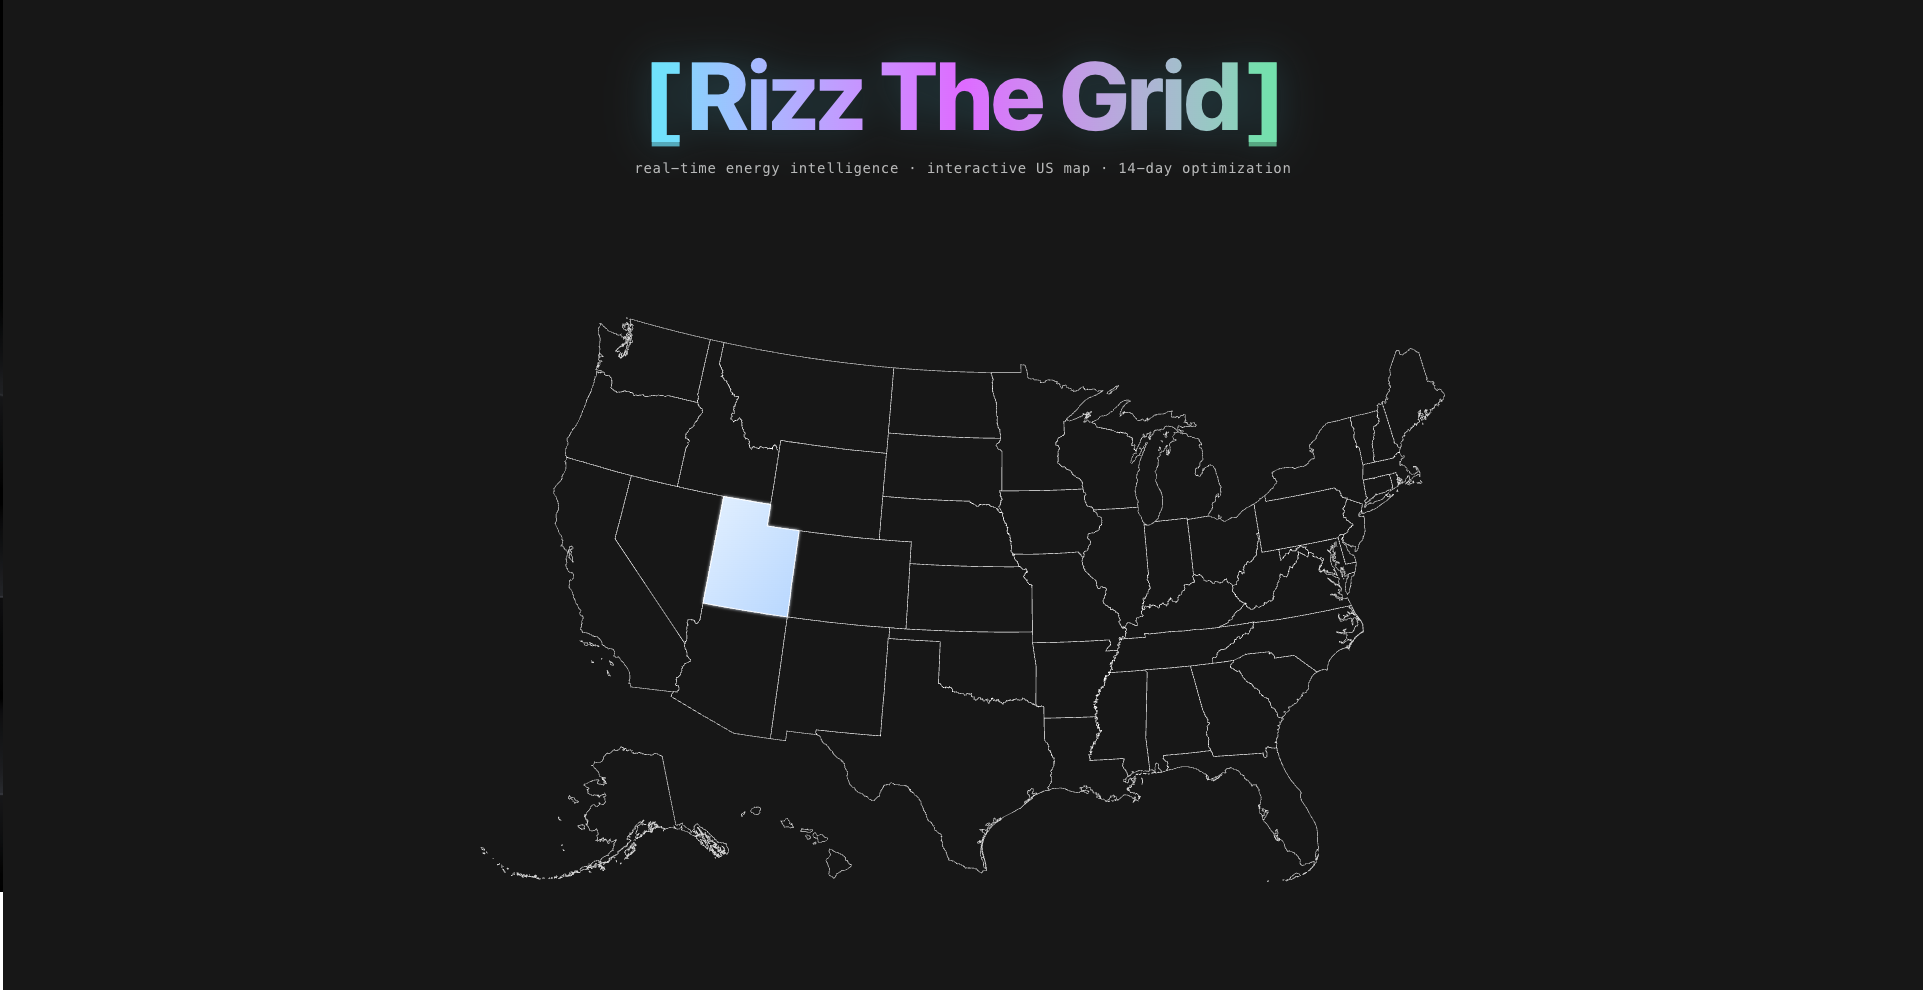
Home screen for project
-
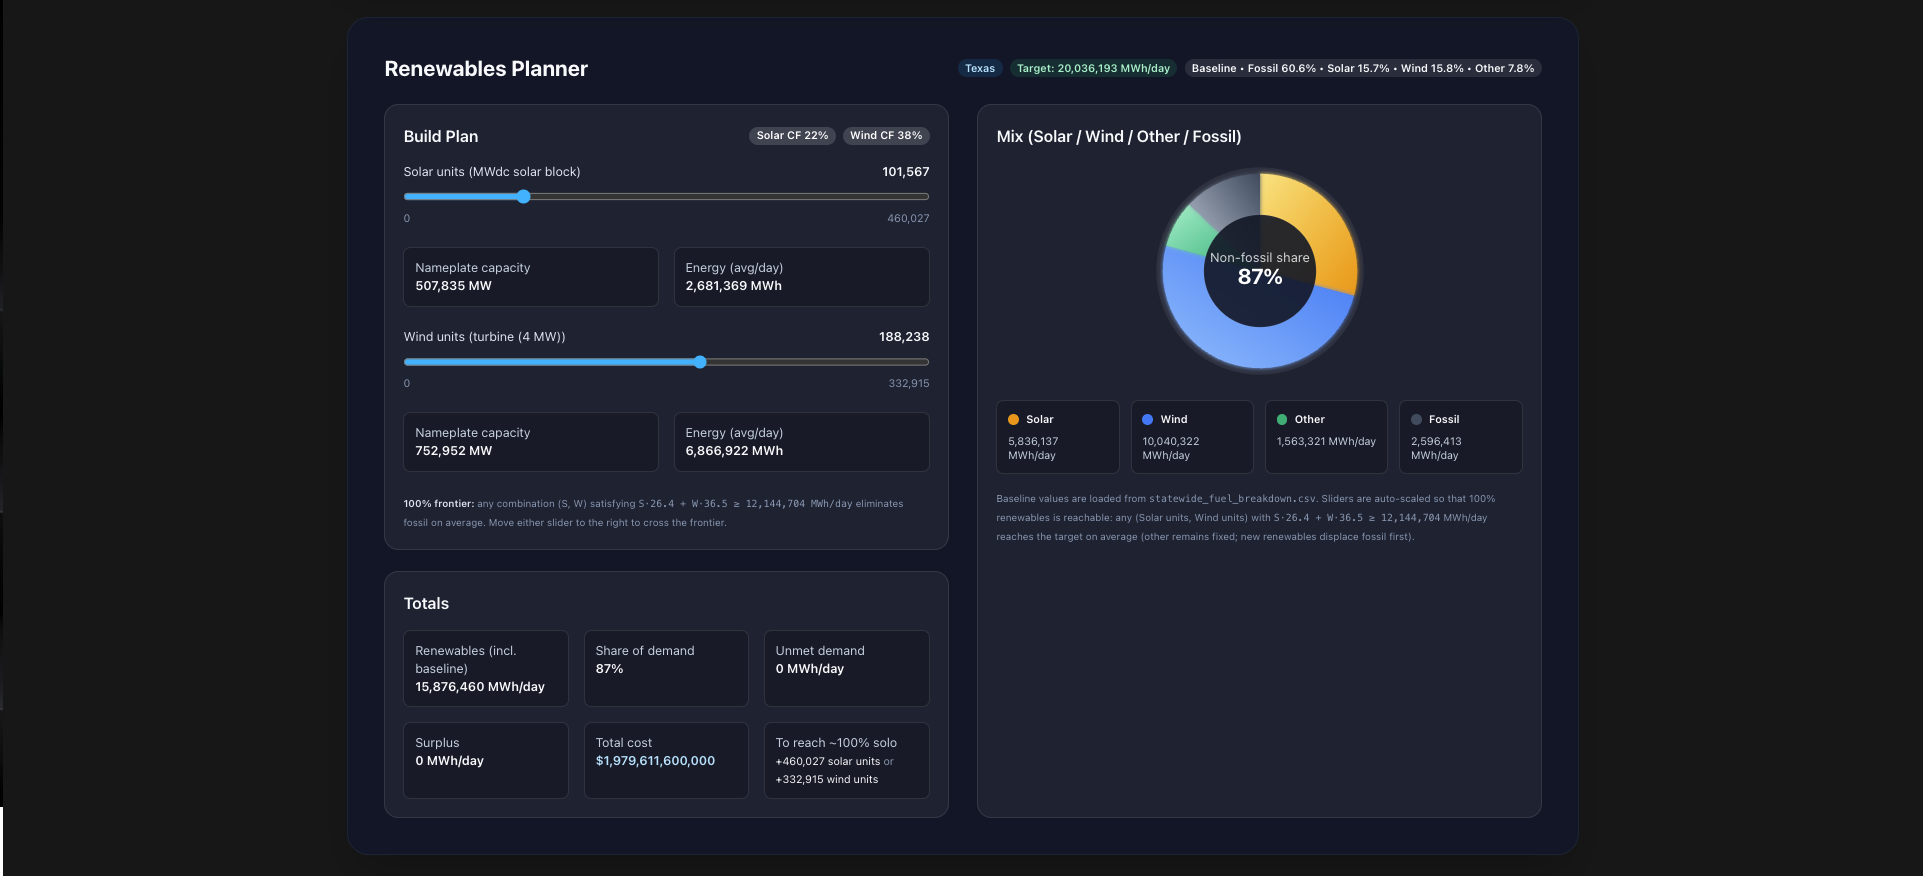
The Clean Renewable Dashboard
-
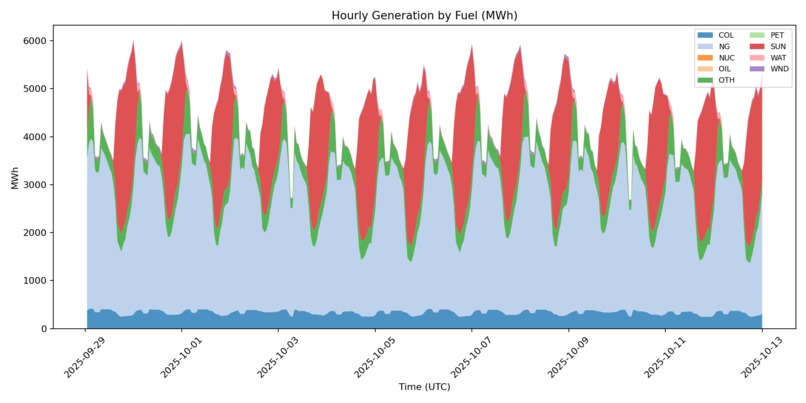
Descriptive + Prediction Graph
-

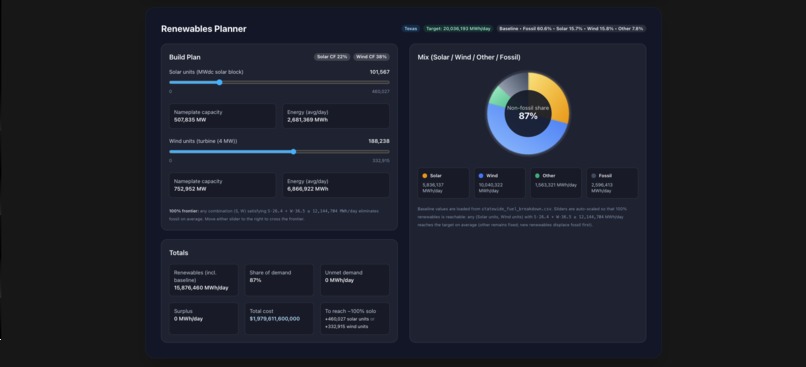
Overview of Texas


Inspiration 💡
Climate change is accelerating, but infrastructure change is slow. Instead of waiting for billion-dollar power plants, we asked: Can smarter math and data make the existing grid cleaner today?
We were inspired by the idea that decarbonization doesn’t always require new steel or silicon - sometimes it just takes intelligence and coordination. Our goal: forecast, optimize, and visualize how smarter energy scheduling can cut emissions, save money, and build a sustainable future now.
What it does 🌍
Rizz The Grid is a nationwide forecasting and optimization platform that uses real-time data from the EIA (U.S. Energy Information Administration) API to:
Forecast _ each state’s _ 14-day electricity generation mix.
Optimize charging, discharging, and flexible loads to cut fossil fuel use.
Simulate renewable buildouts with an interactive solar and wind capacity planner.
*Visualize results on an interactive U.S. map *: click any state to see fossil fuel reduction, avoided emissions, and monetary savings.
Our analysis found up to 4% reduction in fossil fuel usage, translating into billions of tons of CO₂ emissions saved and billions of dollars saved in social costs across all 50 states.
How we built it ⚙️
Python backend: connected to the EIA API, processed 7+ years of data, ran forecasting models, and executed optimization algorithms.
Next.js + Recharts frontend: built a responsive dashboard with maps, charts, and renewable capacity sliders for each state.
Analytics engine: aggregated nationwide CO₂ and cost savings into clean visual reports.
Challenges we ran into 🚧
Handling incomplete and inconsistent EIA datasets across states.
Keeping the pipeline fast and reliable under API rate limits.
Achieving accurate nationwide forecasting while balancing local variations.
Rendering high-resolution map and chart visuals efficiently without performance drops.
_ Tackling the challenge of scale: _ Per Person vs State wide.
Accomplishments that we're proud of 🏆
Our models demonstrated that smarter coordination alone - without new infrastructure - can yield massive benefits:
Up to 4% less fossil fuel use → Billions of tons of CO₂ saved → Billions of dollars saved in social costs.
These aren’t just statistics; they represent cleaner air, healthier communities, and measurable climate progress through data-driven innovation.
What we learned 🧠
Data can drive decarbonization: even small efficiency gains can scale to national impact.
Intelligence is as powerful as infrastructure: smarter coordination can save billions without new construction.
Collaboration matters: integrating data science, design, and environmental insight was key to making sustainability visible and actionable.
Clarity amplifies impact: the right visuals make complex energy data understandable to everyone.
What's next for Rizz The Grid 🚀
Integrate real-time tariffs and battery economics for cost-aware optimization.
Expand to dynamic load shifting for industries and smart homes.
Offer an open API so utilities, researchers, and cities can plug Rizz The Grid into their systems.
Deliver automated daily reports that track CO₂, the costs, and renewable performance over time.


Log in or sign up for Devpost to join the conversation.