-
-
Riyex Racing Intelligence Platform
-
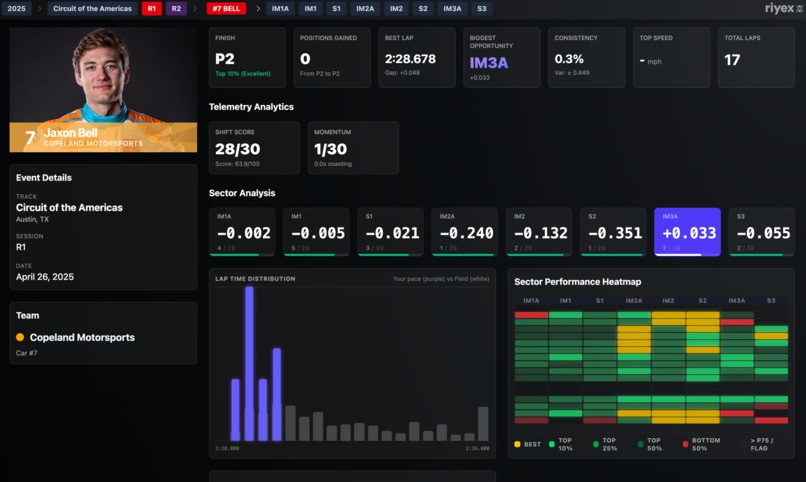
Driver Performance Overview
-
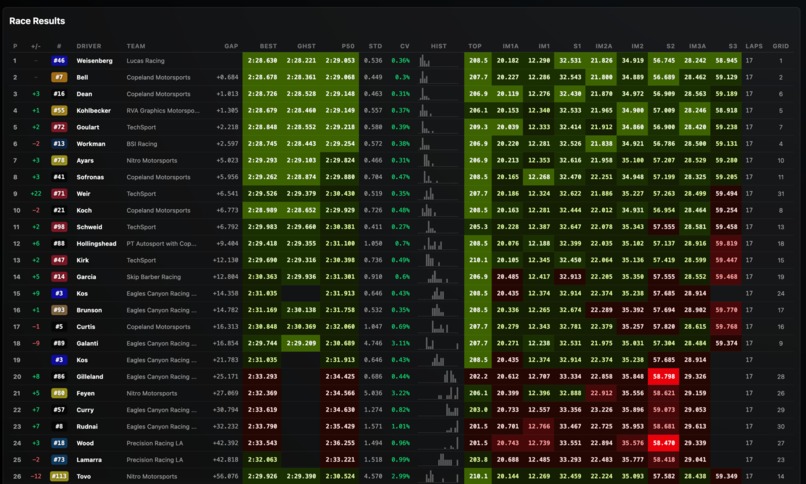
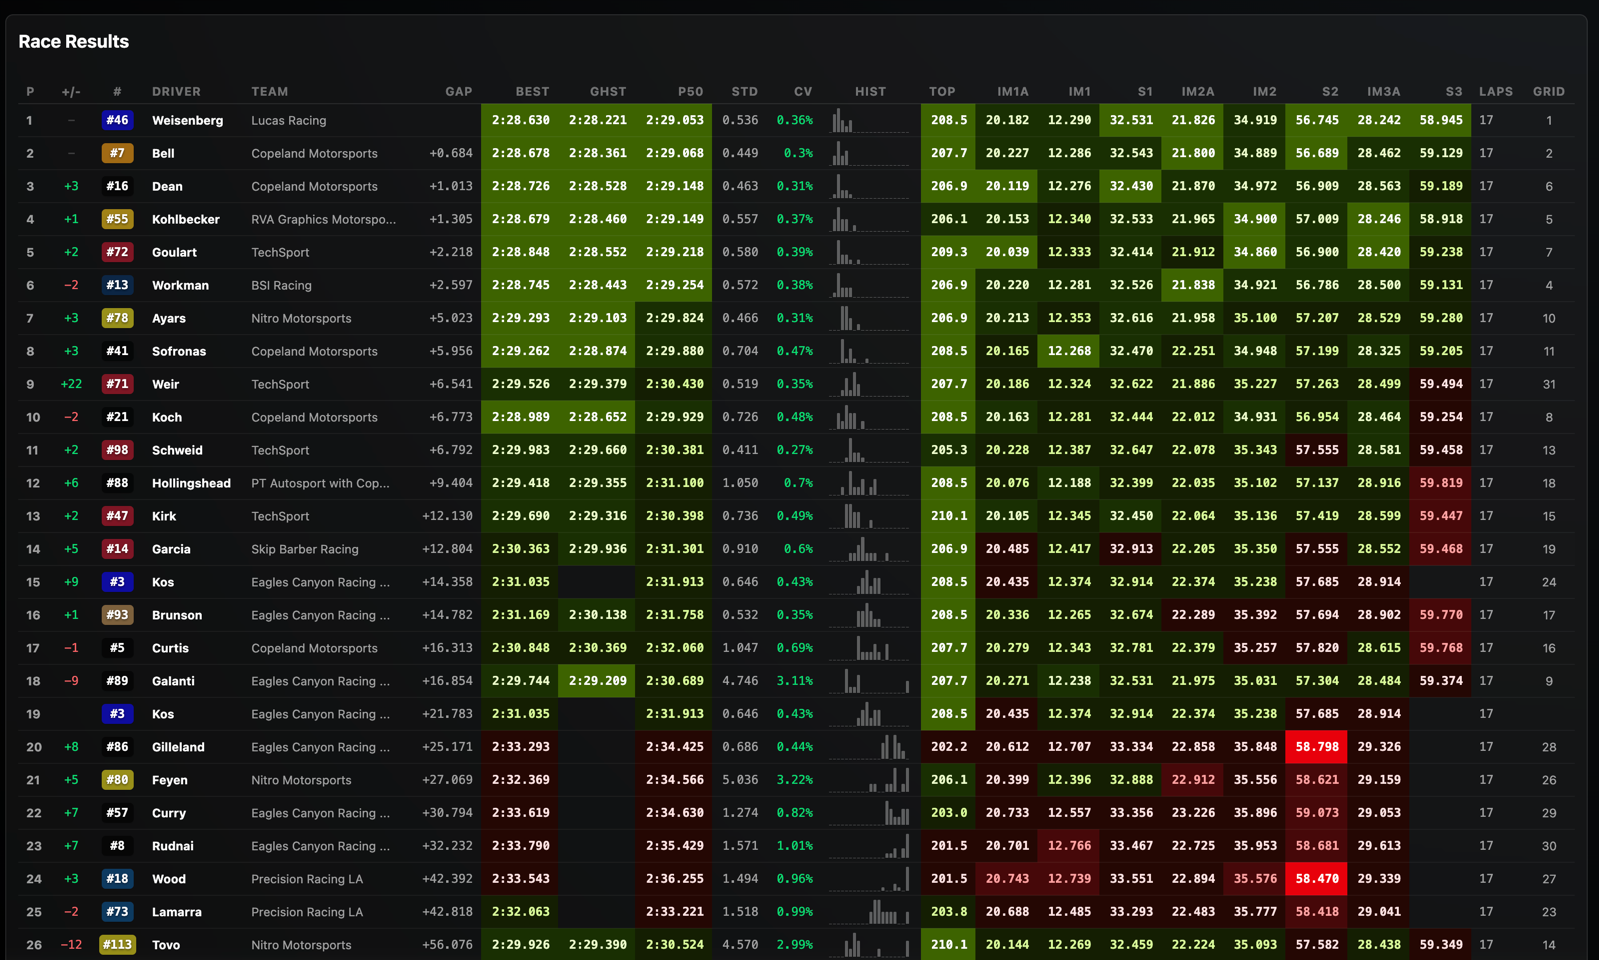
Race Results and Field Analytics
-
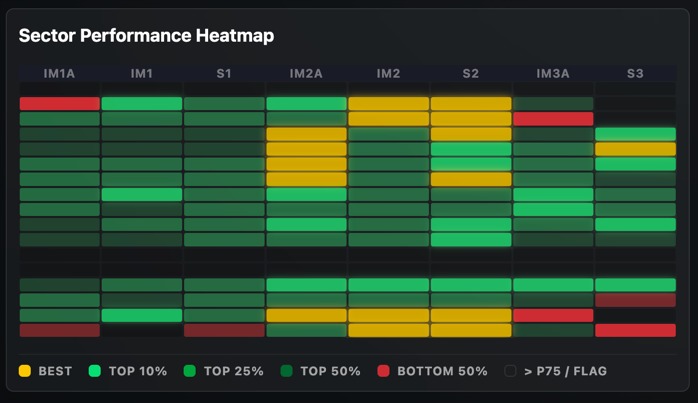
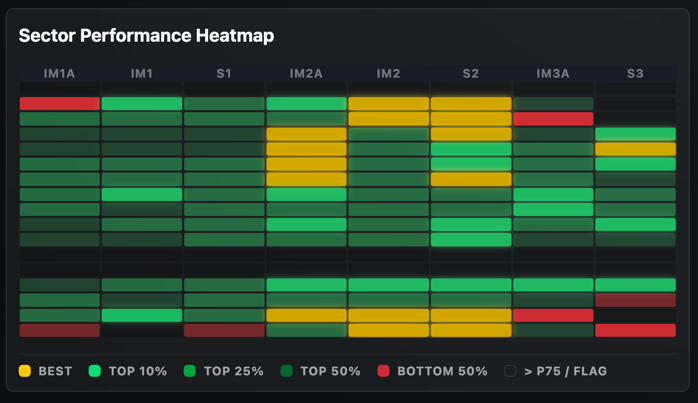
Driver Sector Performance Heatmap
-
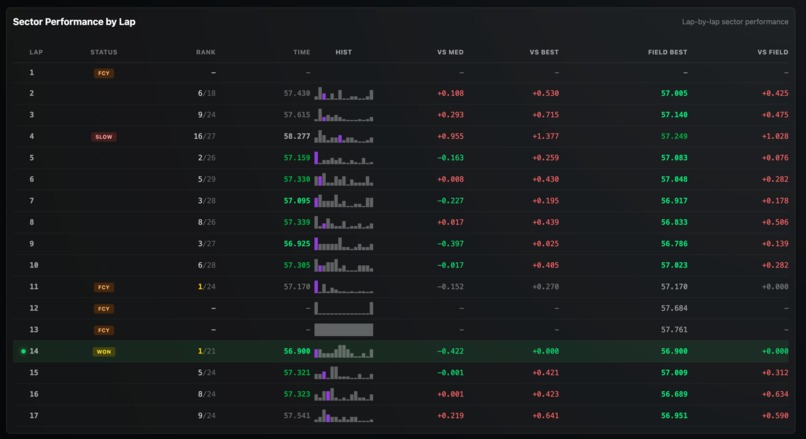
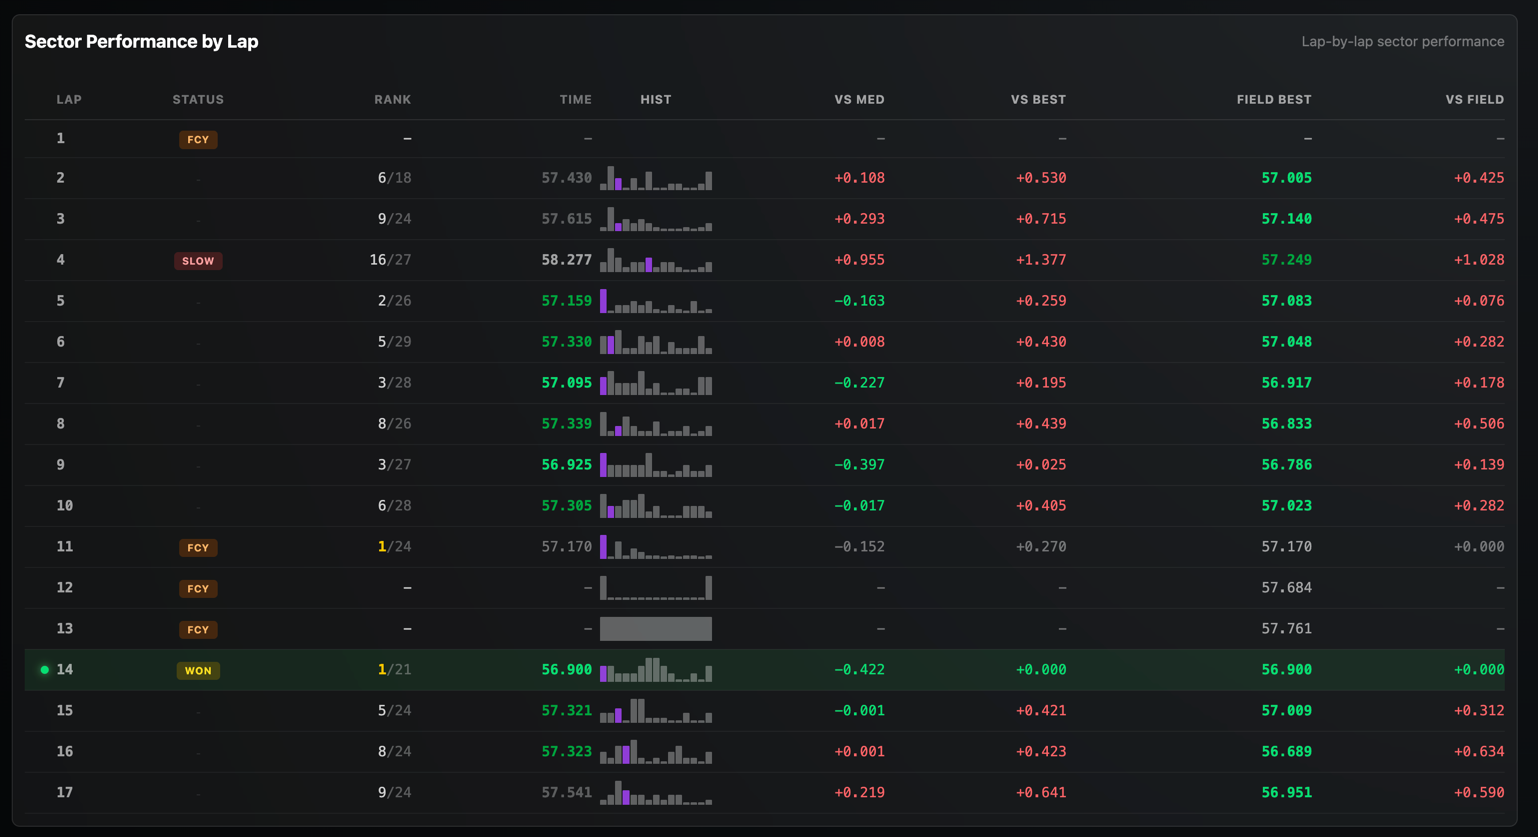
Driver Sector Performance Lap Breakdown
-

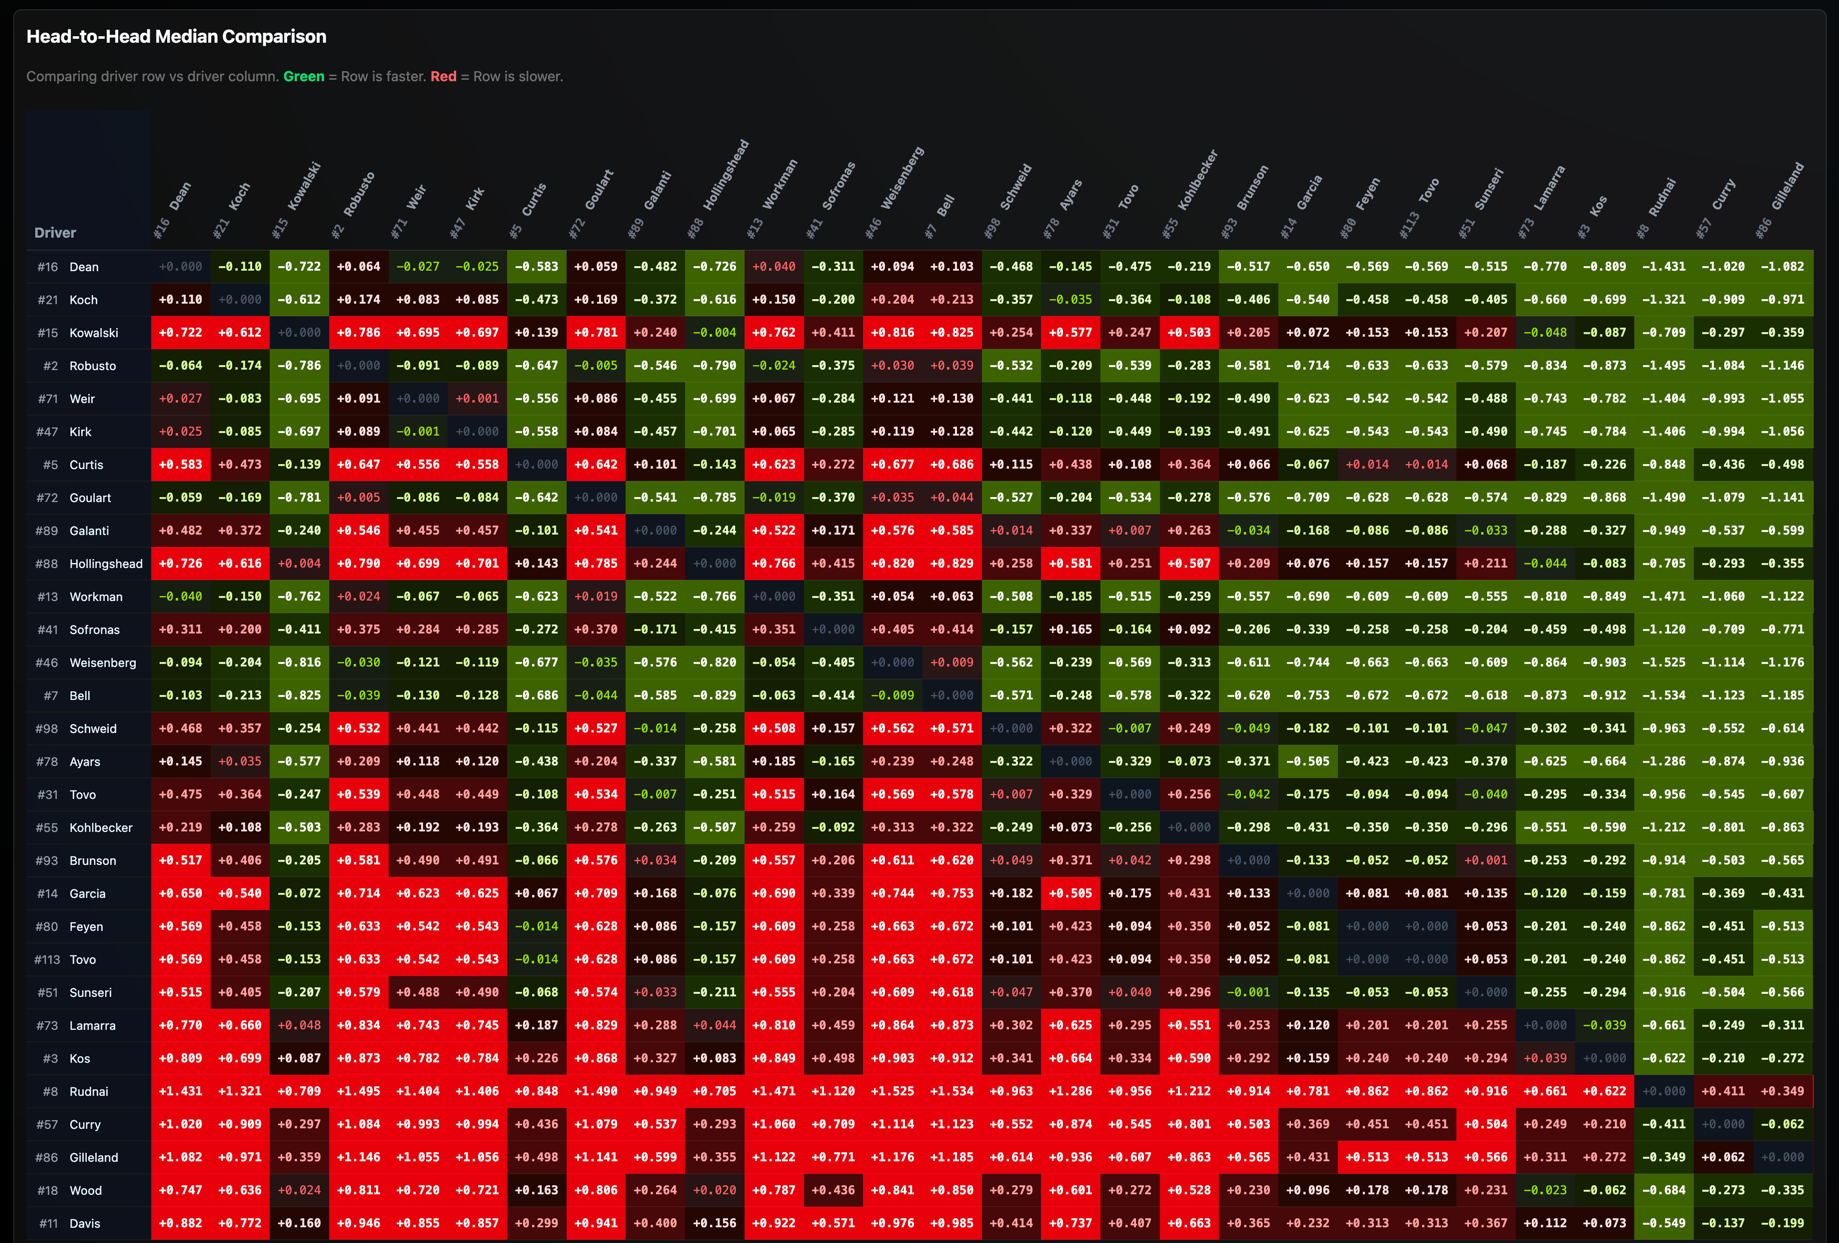
Driver Sector Comparison Matric
-
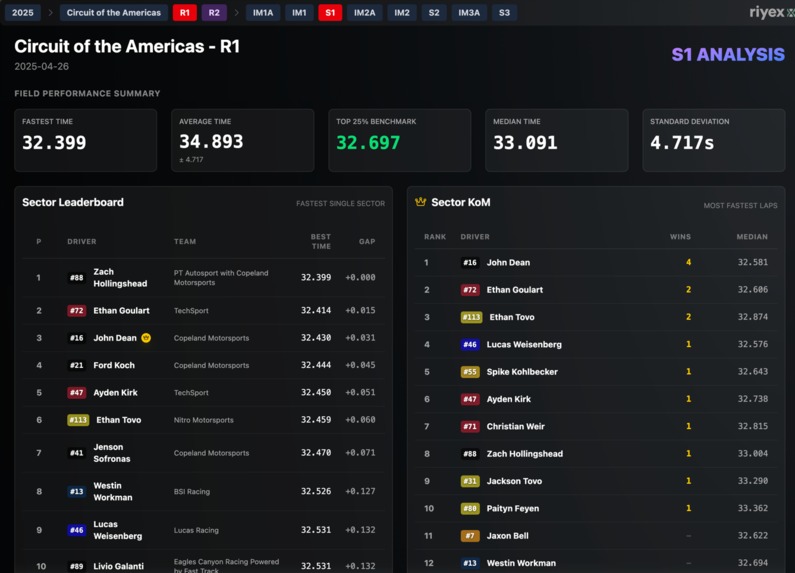
Race Sector Leaderboard and KoMs
-
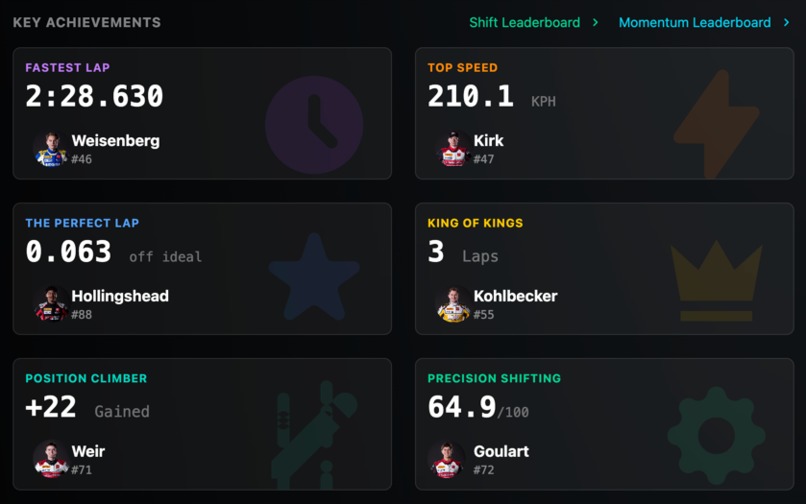
Race Achievements


Inspiration
The project began with a simple question: How can we turn the massive amount of GR Cup telemetry into real insight for drivers? TRD's dataset is incredibly rich, but the tools to interpret it are often too technical or too fragmented to help drivers understand where they can improve.
We drew inspiration from data-dense applications that transform complexity into clarity: data.golf's performance analytics that help golfers identify strokes gained opportunities, Bloomberg Terminal's ability to surface actionable market insights from vast financial data streams, and crypto trading platforms that distill volatile market conditions into confident decision-making tools. These platforms prove that dense, high-frequency data doesn't have to be overwhelming—when structured thoughtfully, it becomes a competitive advantage.
We wanted to bring that same philosophy to motorsport—bridging the gap between raw telemetry and driver improvement by combining our engineering experience with our motorsport passion to create a platform that delivers clarity, strategy, and confidence to every driver on the grid.
What it does
The Racing Intelligence Platform transforms raw TRD telemetry into driver-focused insights. It builds a theoretical "perfect lap," scores consistency under pressure, tracks pace fade throughout a race, and flags mistakes or outlier laps so drivers see exactly what happened and how much time it cost. It condenses thousands of data points per lap into a clean story: Where am I strong? Where am I vulnerable? And where can I find real time?
How we built it
We deliberately kept the architecture simple and practical. Instead of building complex distributed data pipelines with orchestration layers, we chose a straightforward Taskfile-driven Python scripting approach that runs entirely on a single machine. This allowed us to prioritize speed, maintainability, and deployment simplicity without sacrificing capability.
Our pipeline aggregates data from across the GR Cup ecosystem: TRD’s high-frequency telemetry archives (trddev.com), official GR Cup Series driver and entry information (grcupseries.com), USAC timing and scoring (usac.alkamelna.com), and OpenStreetMap-based track geometry. Each Python task ingests, normalizes, and processes these inputs into a clean, unified Gold Layer—a set of reliable, analysis-ready datasets that power the rest of the platform.
Once the Gold Layer is generated, we import it into the Rails application using custom rake tasks. The Rails app drives the user-facing experience, applying statistical modeling—variation scoring, perfect-lap sector aggregation, and deviation analysis—to automatically surface meaningful insights. The frontend then presents these findings in a simple, fast, and intuitive interface that drivers can absorb at a glance—on pit lane, in the paddock, or right after a session.
The entire stack runs comfortably on a single server, making it easy to deploy, debug, and iterate while keeping the architecture clean and efficient.
Challenges we ran into
The biggest challenge was handling the inconsistency of data across multiple track data sets. Aligning telemetry streams with lap boundaries, synchronizing weather samples to track evolution, and normalizing sector data that varied in format and structure between tracks required extensive validation and error handling. Data from different providers came in different formats—HTML tables, PDFs, CSV files, and JSON—each requiring custom parsing logic.
Beyond data engineering, we faced the design challenge of visualization: how do you take complex statistical analysis and present it in a way that's instantly intuitive to drivers? We iterated through multiple approaches to find the right balance between information density and clarity. The goal wasn't just to show the data—it was to make insights obvious at a glance, actionable without explanation, and trustworthy enough that drivers would make split-second decisions based on them. Every chart, every metric, every color choice had to earn its place by delivering clarity, not just completeness.
Accomplishments that we're proud of
We're proud that the platform turns dense telemetry into something drivers can use instantly. Our consistency scoring, perfect-lap modeling, and fade analysis work seamlessly across sessions, tracks, and drivers. We also built a system that can scale across an entire championship—processing every lap of every car with speed and reliability. Most importantly, we created something that genuinely helps drivers improve, not just engineers.
What we learned
We learned that basic statistical lap analysis—sector times, consistency scores, lap rankings—provides the picture, but it doesn't provide actionable insight. Knowing you're 0.3 seconds slower in Turn 3 is interesting, but it doesn't help you improve. For that, you need to go deeper. You need to drill into the statistics and understand why the driver was slower: Was it poor braking technique? Coasting too long before turn-in? Carrying insufficient apex speed? That's where the real value lives.
We also learned just how valuable data becomes when it's presented clearly and thoughtfully. Even the most advanced telemetry is only useful if drivers can understand and act on it. Motorsport analysis doesn't have to be complicated—just well structured, intentional, and laser-focused on answering the question every driver cares about: "What do I do differently next lap?"
What's next for Racing Intelligence Platform – GR CUP 2025 – Riyex
We're expanding the platform with granular, driver-focused insights designed to turn telemetry into actionable improvement strategies. Our roadmap includes:
Corner Entry & Braking Intelligence Brake point optimization tools that identify exactly when and where to delay braking, combined with trail braking analysis to help drivers modulate pressure through corner entry. These features maximize front-end grip, reduce understeer, and carry more speed into turns—critical for momentum cars like the GR86.
Momentum & Speed Preservation Minimum corner speed analysis to identify where drivers are over-slowing or leaving time on the table at apex. Coasting detection highlights hesitation periods where drivers aren't on throttle or brake, revealing opportunities to maintain momentum through transitional sections.
Grip & Traction Utilization Friction circle analysis showing how much of the car's available grip drivers are using under braking, cornering, and combined loads. Understeer detection alerts when excessive steering input isn't translating to cornering force—helping drivers find the limit without overshooting it.
Powertrain Optimization Shift point and gear selection analysis ensuring drivers stay in the optimal RPM band for maximum power delivery. Critical in spec racing where everyone has the same engine—every shift matters.
Performance Attribution & Prioritization Corner-by-corner time delta analysis breaking down exactly which turns cost the most time and deserve focused practice. This helps drivers and coaches prioritize improvement efforts where they'll have the biggest impact.
Our goal for 2025 is clear: make the Racing Intelligence Platform the most trusted source of performance insight in the GR Cup paddock—then bring this technology to grassroots and amateur racing communities worldwide.
Built With
- python
- ruby-on-rails
- taskfile


Log in or sign up for Devpost to join the conversation.