-
-
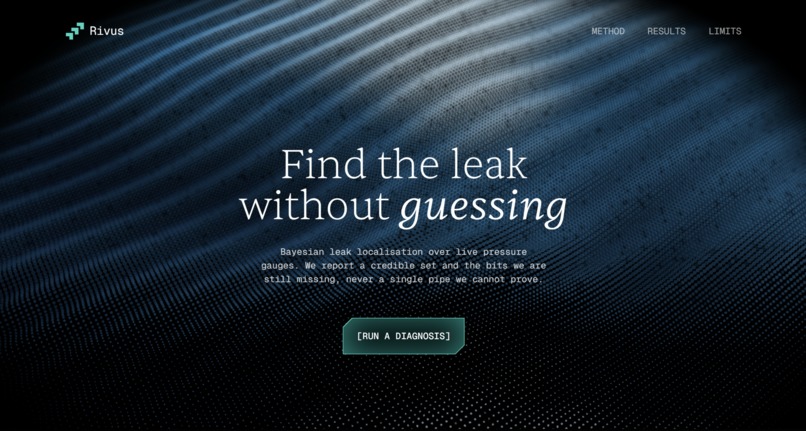
Snapshot of Landing Page
Inspiration A water utility can already tell you that it is losing water. The district meter says more goes in than comes out of taps. What nobody can tell you is where.
That gap is expensive. Checking one junction means two people, a truck and a pressure gauge for about an hour, and opening the wrong street costs roughly twenty thousand dollars. So the question a crew actually faces is not "where is the leak", it is "where should I look next". We could not find anything that answers that, so we built it.
What it does Rivus is twenty questions, for pipes.
It simulates a leak at every candidate junction using the EPA's EPANET engine, thirty six runs in a fifth of a second, and each possible break leaves a different fingerprint of pressure drops. Then it names the single hydrant whose reading will eliminate the most suspects, weighed against the crew hours it costs to drive there. Not a heat map, a specific instruction.
It also says what it cannot know. Junctions on the same run of pipe push pressure around almost identically, and on our test district 179 of 210 surviving pairs differ by less than the 1.22 psi we can actually distinguish. Rivus names those pairs instead of picking a confident winner.
Before anyone digs, it screens the shutdown. On one run, closing the obvious two valves drops the hospital from 78.77 psi to zero. Rivus rejects that and finds a plan where the hospital holds 37.64 psi with one customer offline.
How we built it The water network is not modelled as a graph for convenience, it genuinely is one, so we built it in Jac. Junctions are nodes, mains are typed Pipe edges, tanks are Source nodes, and belief about where the leak is lives on Hypothesis nodes that walkers update as readings arrive.
The clearest case for the graph is isolation. Closing a valve is deleting an edge, so "who still has water" becomes a reachability question, and a walker answers it by flooding from the supply through whatever pipes are still open. We then score the same valve configuration with a pressure dependent hydraulic run, so two methods that share no code have to agree.
by llm() runs in exactly one place, turning a crew's radio note into a typed Observation node. It refuses a note rather than inventing a pressure reading. Python appears once, at the EPANET boundary, because EPANET is a C library.
Challenges we ran into Our headline number was wrong and we withdrew it. We had measured our probe selection landing 43 percent closer to the leak than random probing. Then one of us wrote a check asking whether the evidence the crew reads actually departs from the model's own prediction, and it failed. Median divergence was 0.04 psi against a 0.35 psi noise floor, because our observed residual differenced two snapshots taken under the same perturbation, so the perturbation cancelled. We were close to inverting our own simulator. We fixed the physics rather than the threshold, re-measured, and the 43 percent vanished.
EPANET was quietly reporting millions of psi. Chasing a disagreement between our two isolation methods, we found that it does not fail on a disconnected subnetwork, it returns nonsense. Ours came back at 4,721,946 psi, which our screen read as comfortably above the 20 psi service floor. It reported zero customers affected when twelve had been cut off, and the same artifact at the hospital would have approved a plan that stranded it. The graph walker said twelve. That contradiction is the only reason we found it.
Jac had a few traps that each cost us real time. Typed edges need single dash arrows. Backticks break the lexer even inside docstrings. Assigning to a glob inside a scope silently creates a local, which invalidated an entire parameter sweep before we noticed. And Jac persists the graph to disk between runs, so a second run stacks another copy of the network onto root and every count silently doubles.
Accomplishments that we're proud of We deleted our own best number. The 43 percent figure was the most impressive thing we had, a teammate's test proved it was an artifact, and it came out of the README the same afternoon.
Then we asked whether that was the method or the network. Our test district has 35 junctions where almost every candidate pair is hydraulically indistinguishable, which leaves nothing for a probe policy to exploit. We ran the identical measurement on a 92 junction district:
35 junctions 92 junctions finds exact junction 8.6% vs 8.6% by chance 19.6% vs 5.4% top five 37.1% vs 28.6% 46.7% vs 22.8% search distance 4.49 vs 5.14 hops 3.98 vs 6.27 hops statistically resolvable no yes The method works where the network has structure to exploit. That is a narrower claim than the one we withdrew, and unlike that one it survives a random control arm.
Running isolation two independent ways felt like overengineering until it caught a solver returning a million psi and telling us nobody was affected.
What we learned A random control arm is not optional. Without it, "our clever method helps" is unfalsifiable, and we would have shipped a number that was really just an artifact of how we generated our own test data.
More measurement is not automatically better either. As we added probes, top five accuracy and search distance kept improving, but exact accuracy dipped between eight and fifteen probes. With a slightly wrong model, extra readings can sharpen belief onto a confidently wrong junction while the rough answer keeps getting better. That is exactly why the honest "we cannot separate these" report matters.
And a test can pass while the thing it protects is broken. Our original circularity test compared absolute pressures and stayed green the whole time, because the inference never sees absolute pressures. It sees residuals, where the perturbation cancelled.
What's next for Rivus Every number we have is on EPA sample networks, so the real next step is a calibrated model from an actual utility or consultant, with real sensor placement, to find where the advantage begins.
Sensor placement might be the better product. Rivus already computes which single additional gauge would separate candidates it currently cannot, and that is a capital planning question a utility pays for today with no field crew involved.
Pressure alone is degenerate on branched networks, so adding district flow meters should break ties that pressure never can.
And the adaptive stopping rule needs calibrating. At its current threshold it never fires, which means it reduces exactly to maximum information gain. We would rather say that than quote it as a result.
Built With
- byllm
- css
- drei
- epanet
- html
- jac
- jaclang
- jaseci
- javascript
- lucide
- next.js
- python
- radix-ui
- react
- react-three-fiber
- svg
- tailwindcss
- three.js
- typescript
- wntr

Log in or sign up for Devpost to join the conversation.