-
-
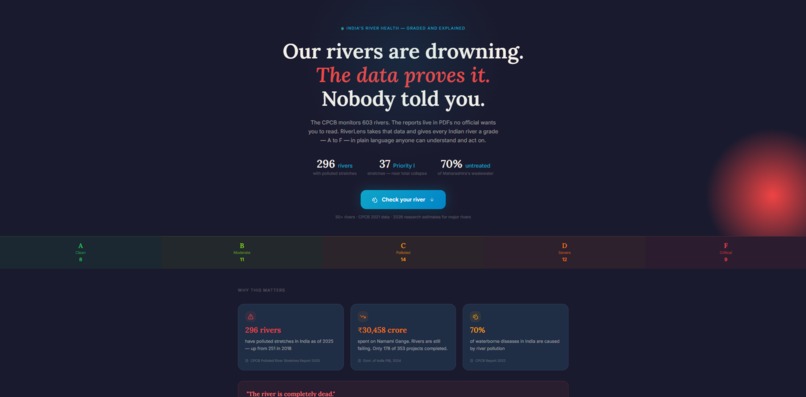
landing page
-
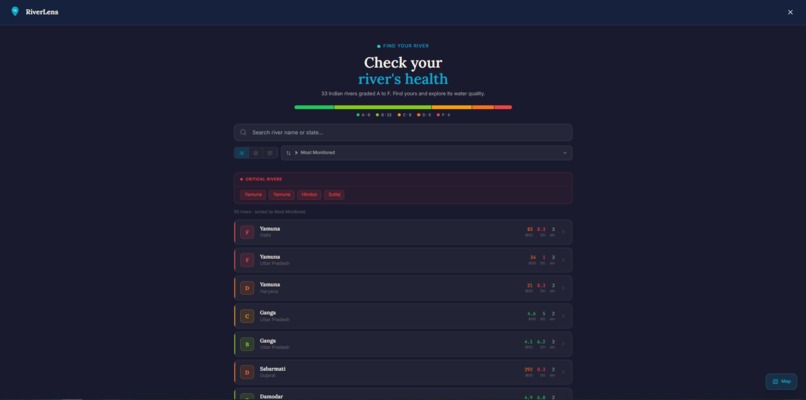
Menu with all the rivers
-

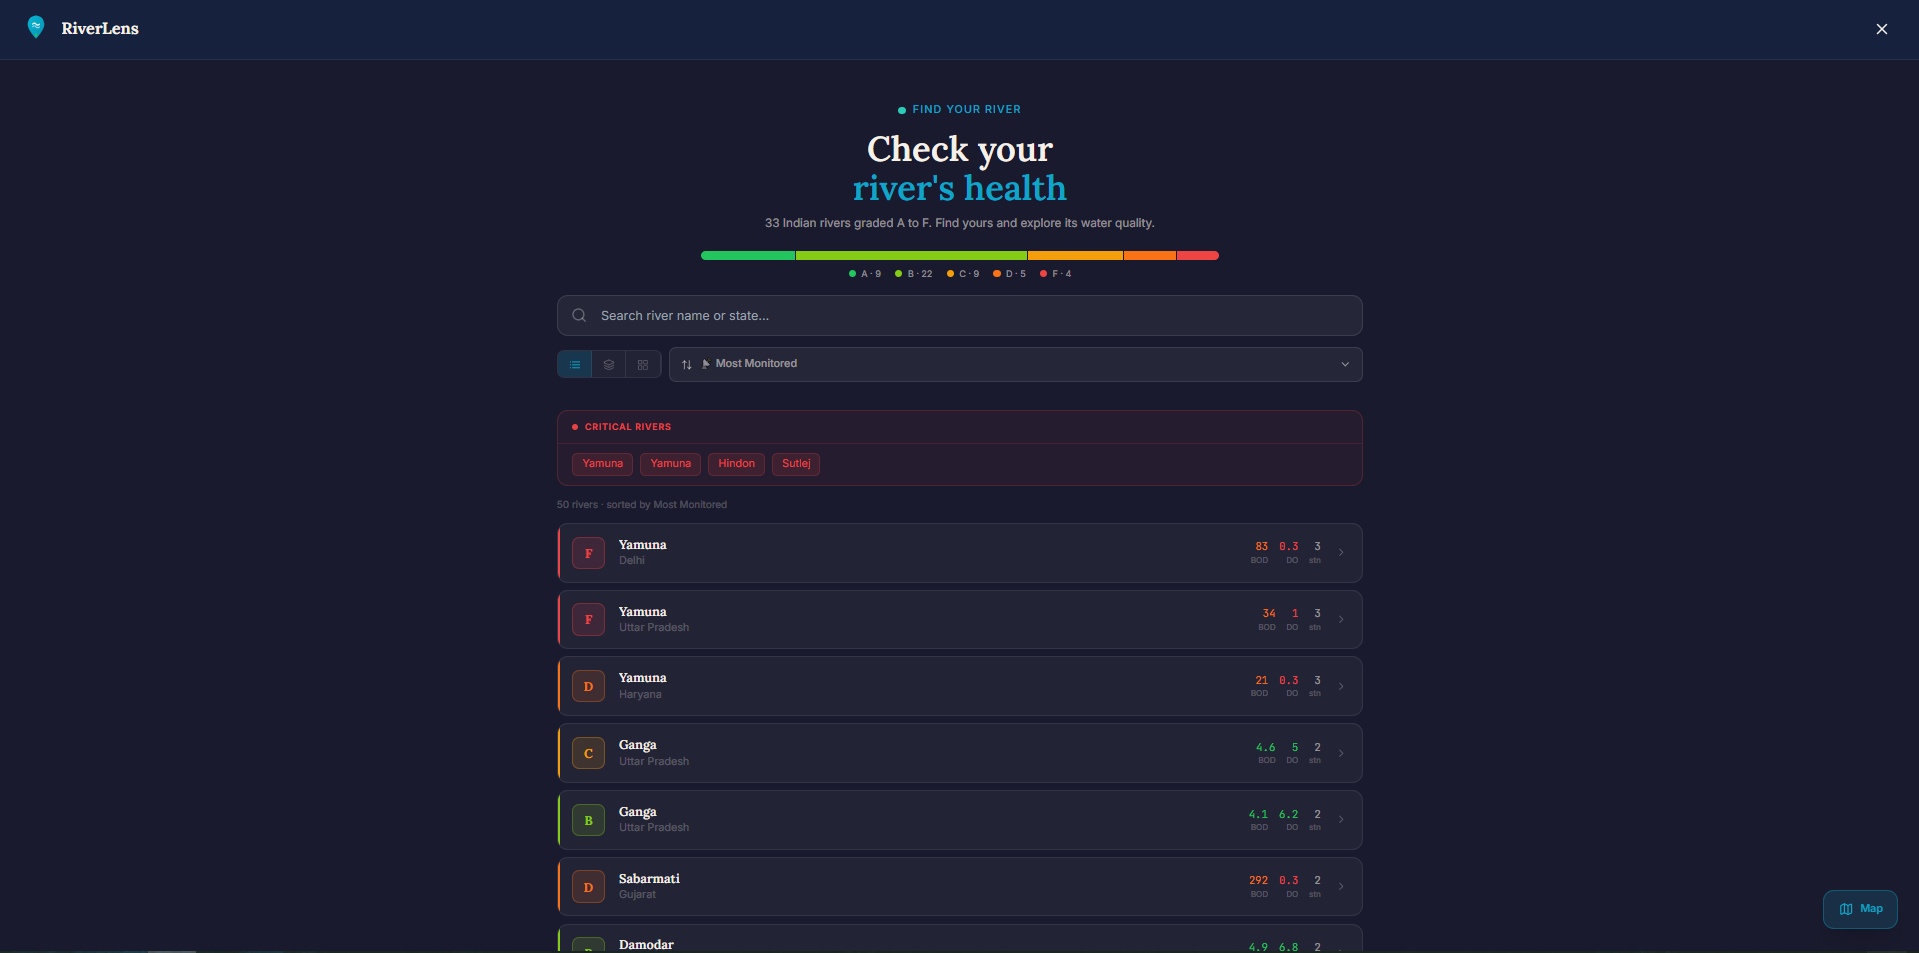
Map with all the rivers
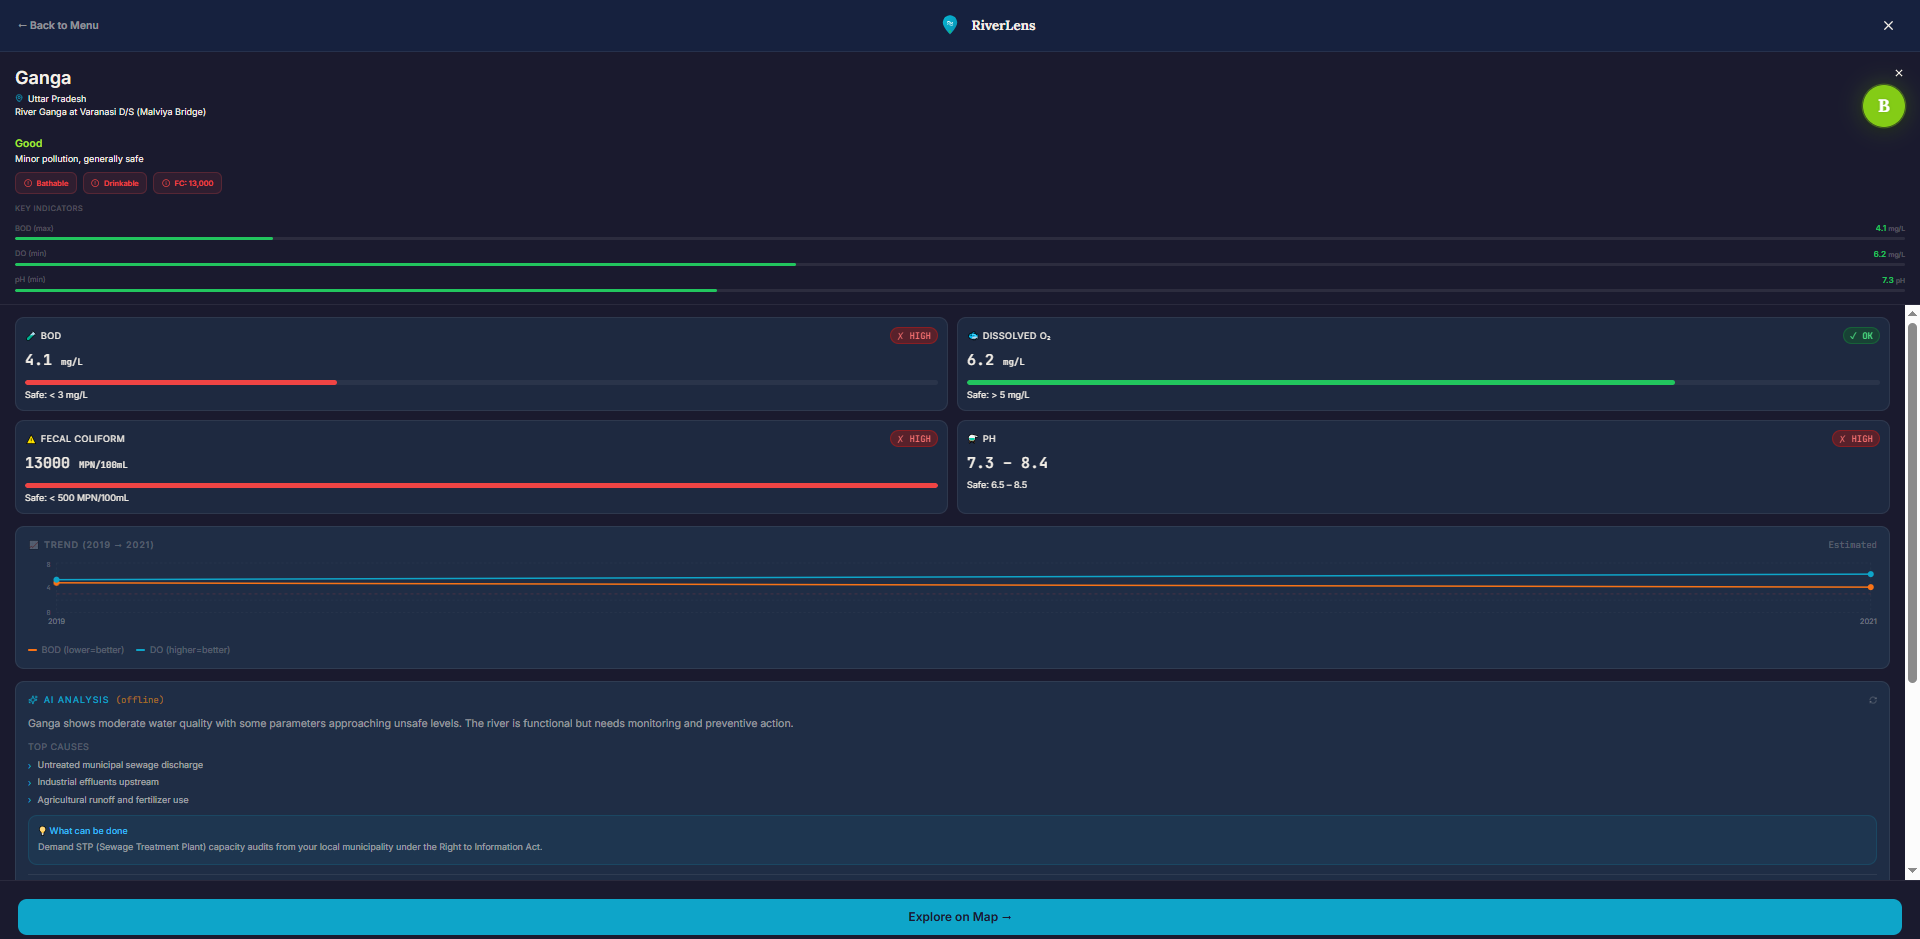
-

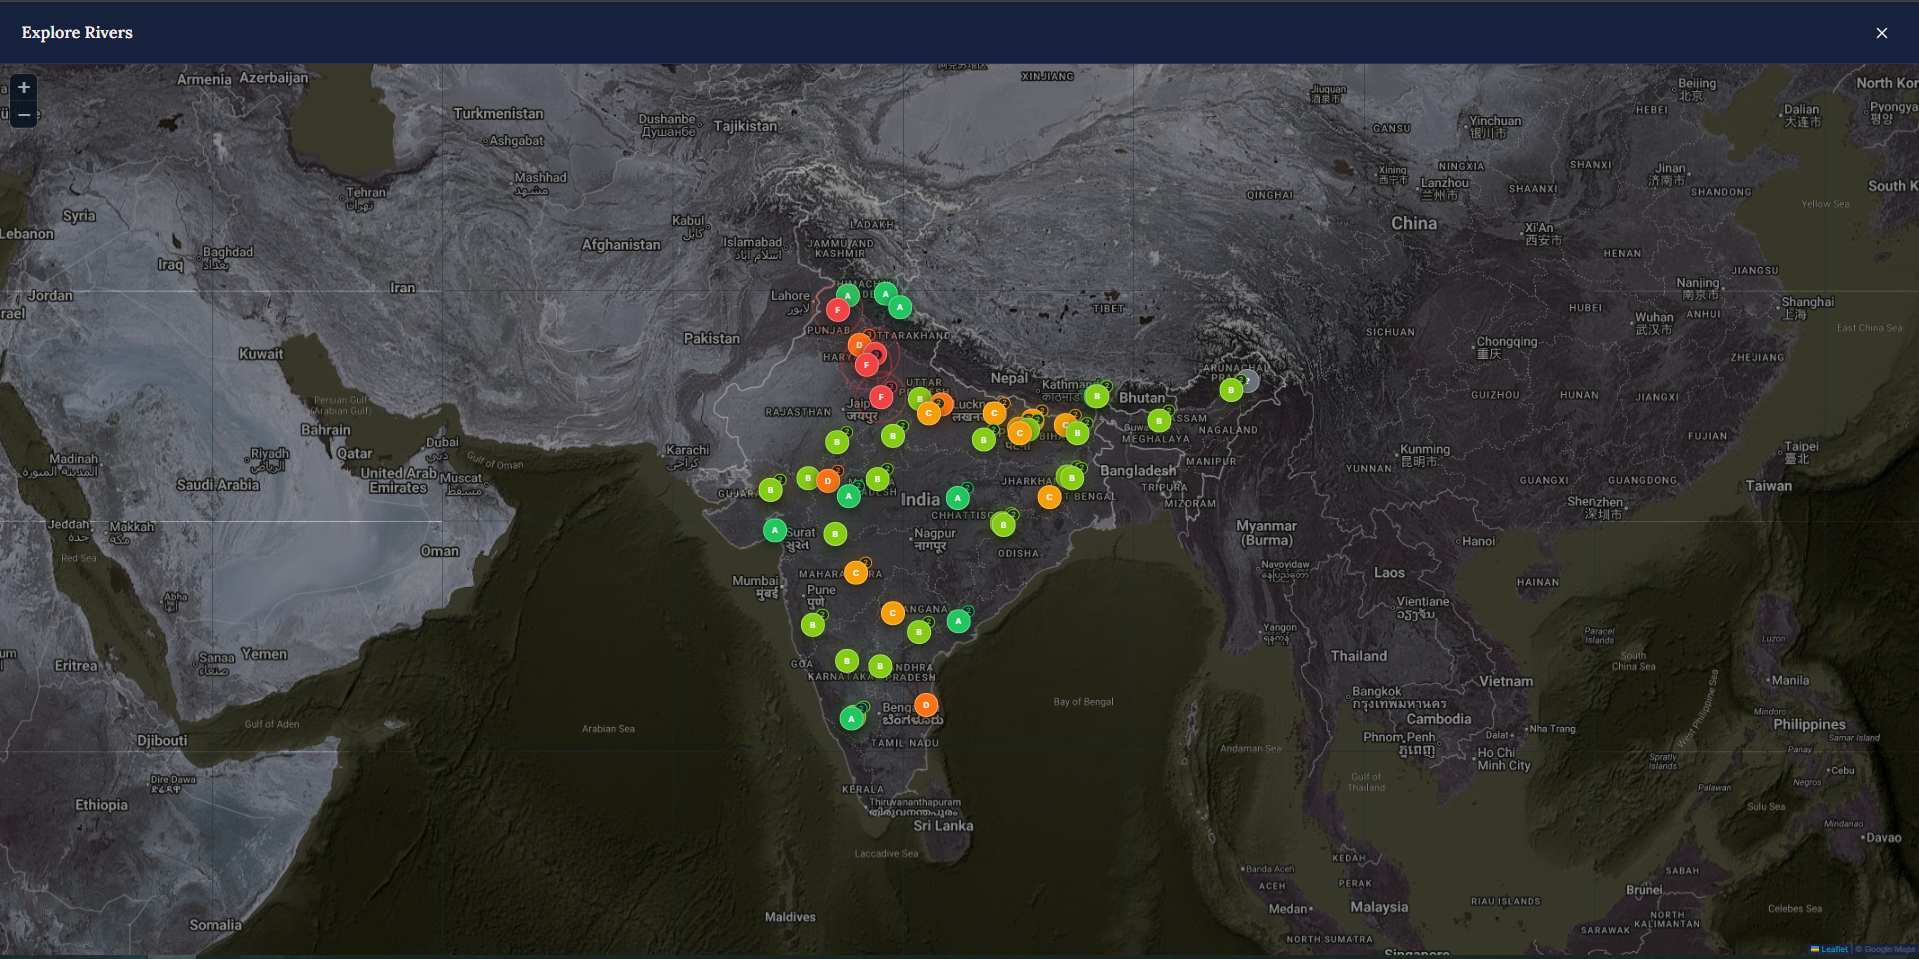
Report of Yamuna

Inspiration
Living in Uttar Pradesh, I witnessed a disconnect between the visible pollution in our rivers and the complex, spreadsheet-heavy data provided by the government. Most citizens know there is a crisis, but they don't have the tools to quantify it. RiverLens was born from a desire to turn "invisible" chemical data into a transparent, visual "Lens" that anyone can use to hold environmental standards accountable.
What it does
RiverLens is a high-fidelity GIS dashboard that monitors the health of India’s major river systems.
Interactive Mapping: Uses a satellite-hybrid interface to track 50+ rivers across the country.
A–F Grading System: Translates complex parameters like BOD (Biochemical Oxygen Demand) and Dissolved Oxygen into simple, color-coded health grades.
AI Insights: Integrates Llama-3 via Groq to provide plain-English explanations of what the data means for local communities, moving beyond raw numbers into real-world impact.
How we built it
The project is built on a modern, high-performance tech stack:
Frontend: React.js with Tailwind CSS for a professional "Official Dashboard" aesthetic.
Mapping: Leaflet.js with custom GeoJSON overlays for legally accurate Indian administrative boundaries.
AI Engine: Groq Cloud (Llama-3-70B) for near-instant inference and data interpretation.
Deployment: Vercel for the live CI/CD pipeline.
Data Logic: A custom JavaScript weighted-algorithm that parses 2021-2025 CPCB datasets to determine environmental health scores.
Challenges we ran into
Data Normalization: Cleaning and standardizing inconsistent government data (e.g., handling "Partial Data" flags) was a major hurdle.
GIS Performance: Managing high-resolution satellite tiles and pulsing markers simultaneously without causing lag on mobile devices.
PowerShell vs. Bash: As a Windows user, I had to overcome environment-specific terminal errors when trying to run global rebranding scripts across the codebase!
Accomplishments that we're proud of
Live Deployment: Successfully shipping a fully functional app to river-lens.vercel.app.
UI/UX Polish: Creating a "Dark Ink" professional theme that feels like a legitimate scientific tool.
The AI Bridge: Successfully using an LLM to act as a "Scientific Translator," making BOD/DO levels understandable for non-scientists.
What we learned
Through this project, I gained a deep understanding of Geospatial coordinates, the physics of water oxygenation, and the nuances of React state management when syncing a sidebar with a map. I also learned that "Good Design" is just as important as "Good Data"—if people can't navigate the map, the data doesn't matter.
What's next for RiverLens
Crowdsourced Verification: A feature allowing users to upload geo-tagged photos of river discharge to verify the data in real-time.
Predictive Analysis: Using historical trends to forecast river health for 2027 and beyond.
Regional Deep-Dives: Creating hyper-local views for specific districts, starting with the rivers of Uttar Pradesh.
Built With
- framer-motion
- leaflet.js
- llama-3-(groq-api)
- lucide-react
- react
- tailwind-css
- vercel

Log in or sign up for Devpost to join the conversation.