-
-
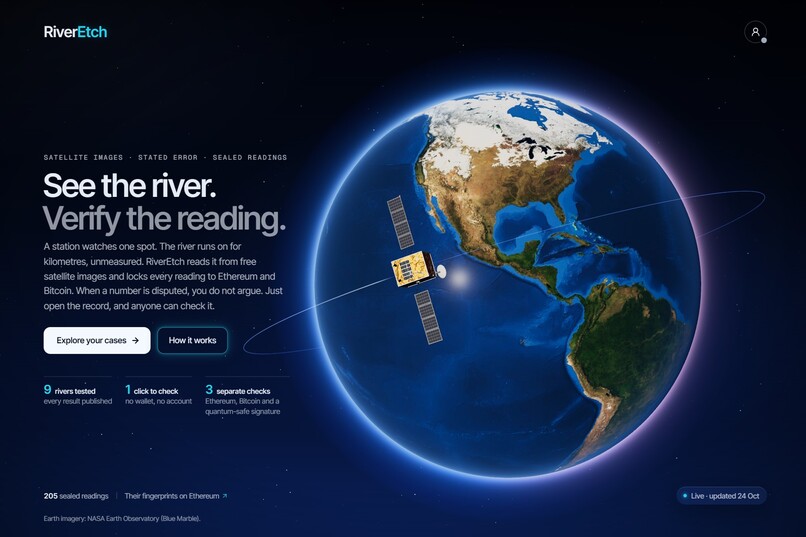
Start page
-
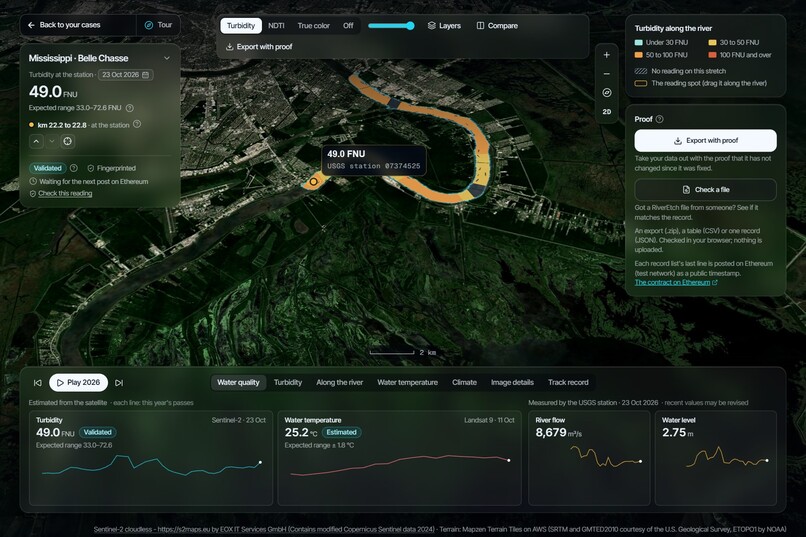
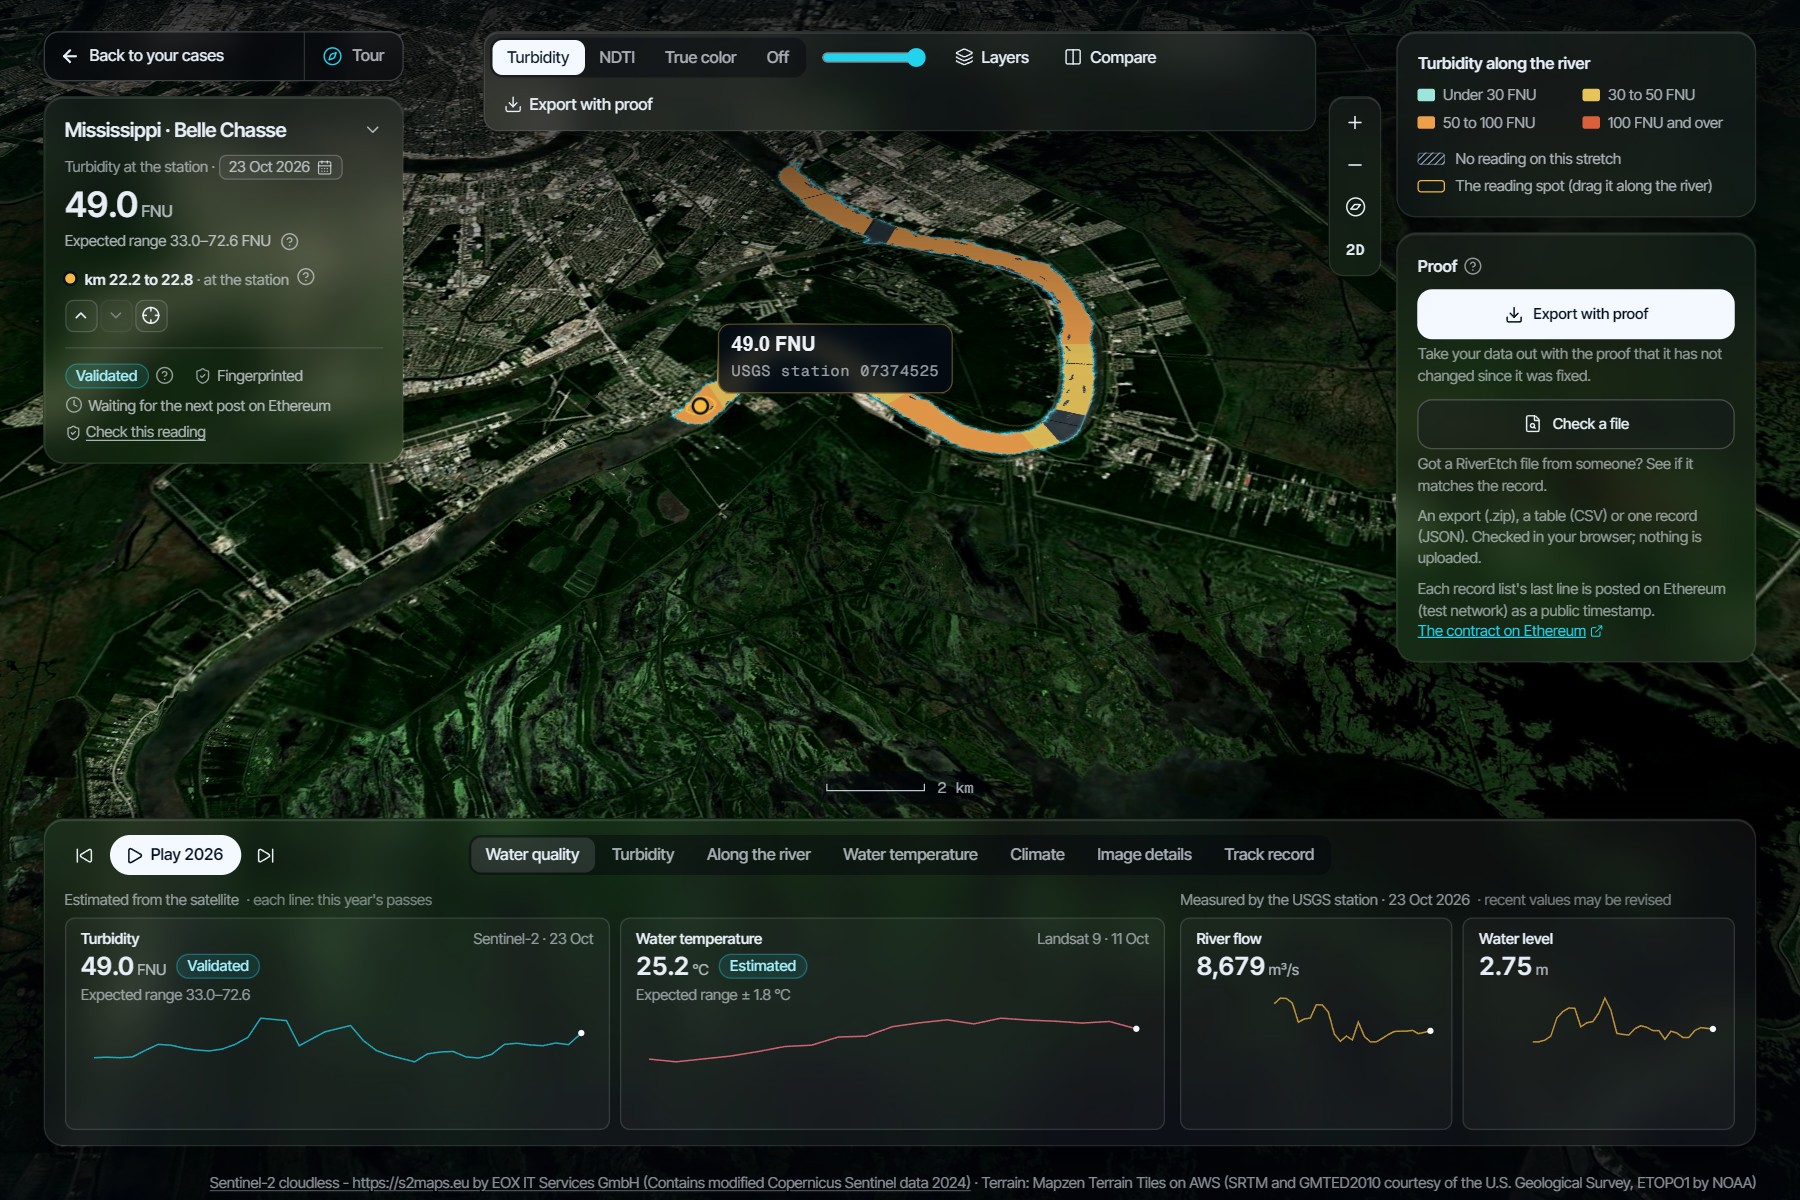
River with station
-
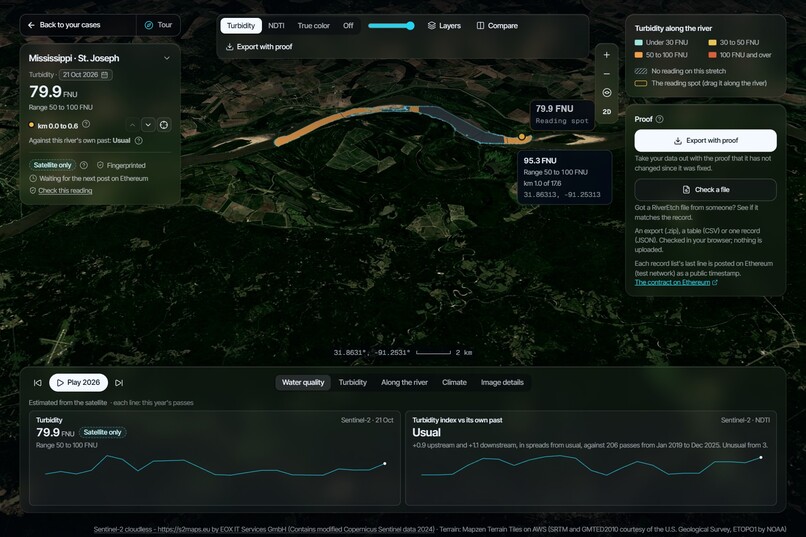
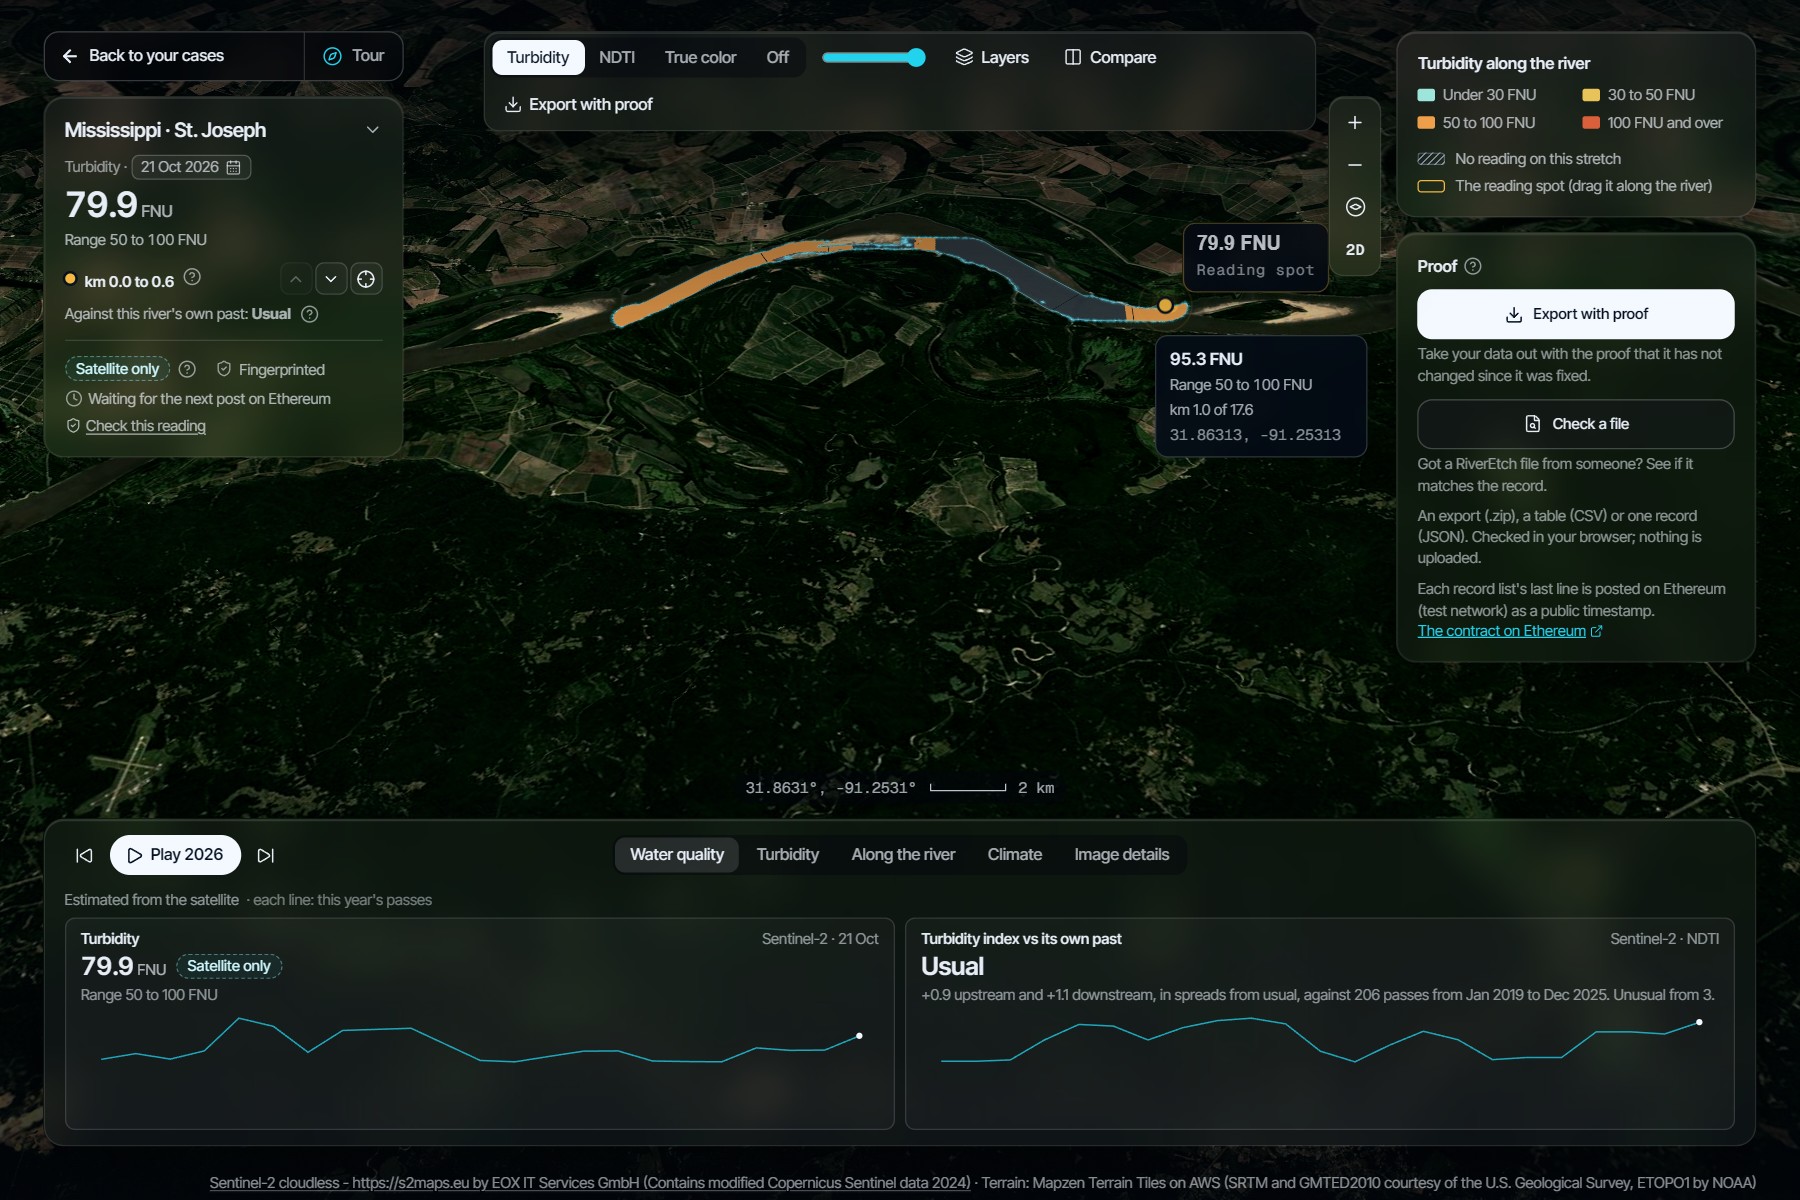
River without station
-
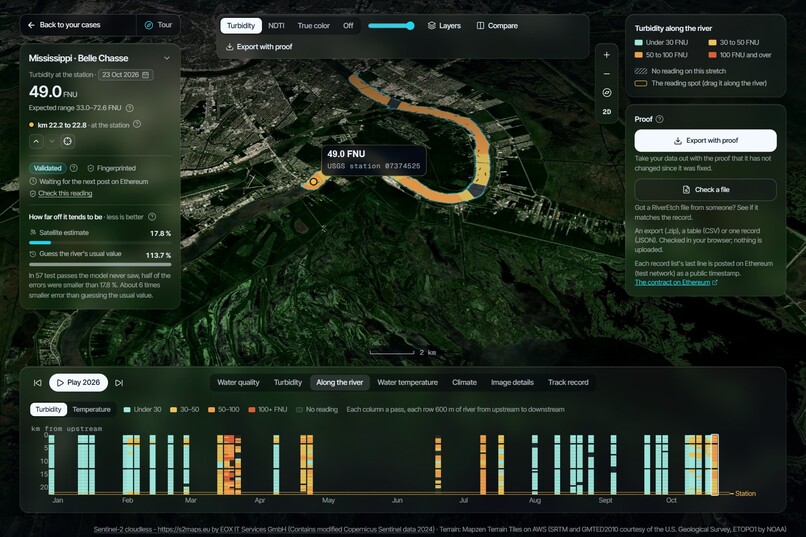
Along the river (feature)
-
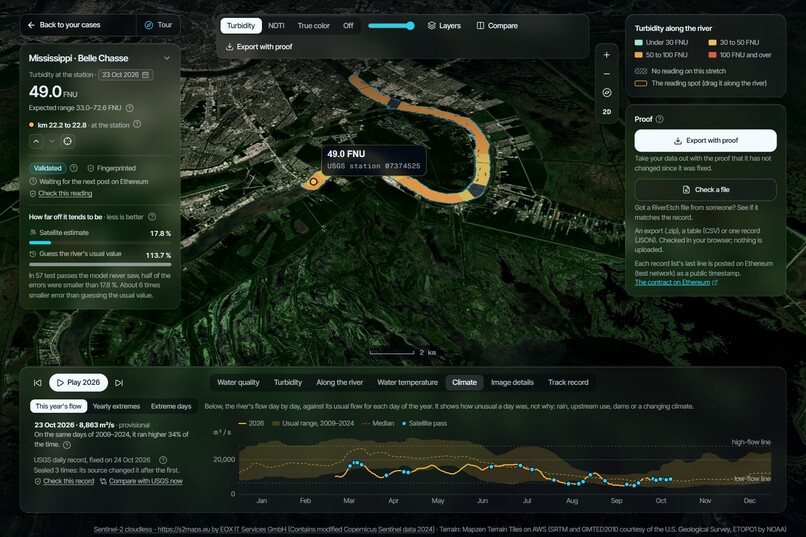
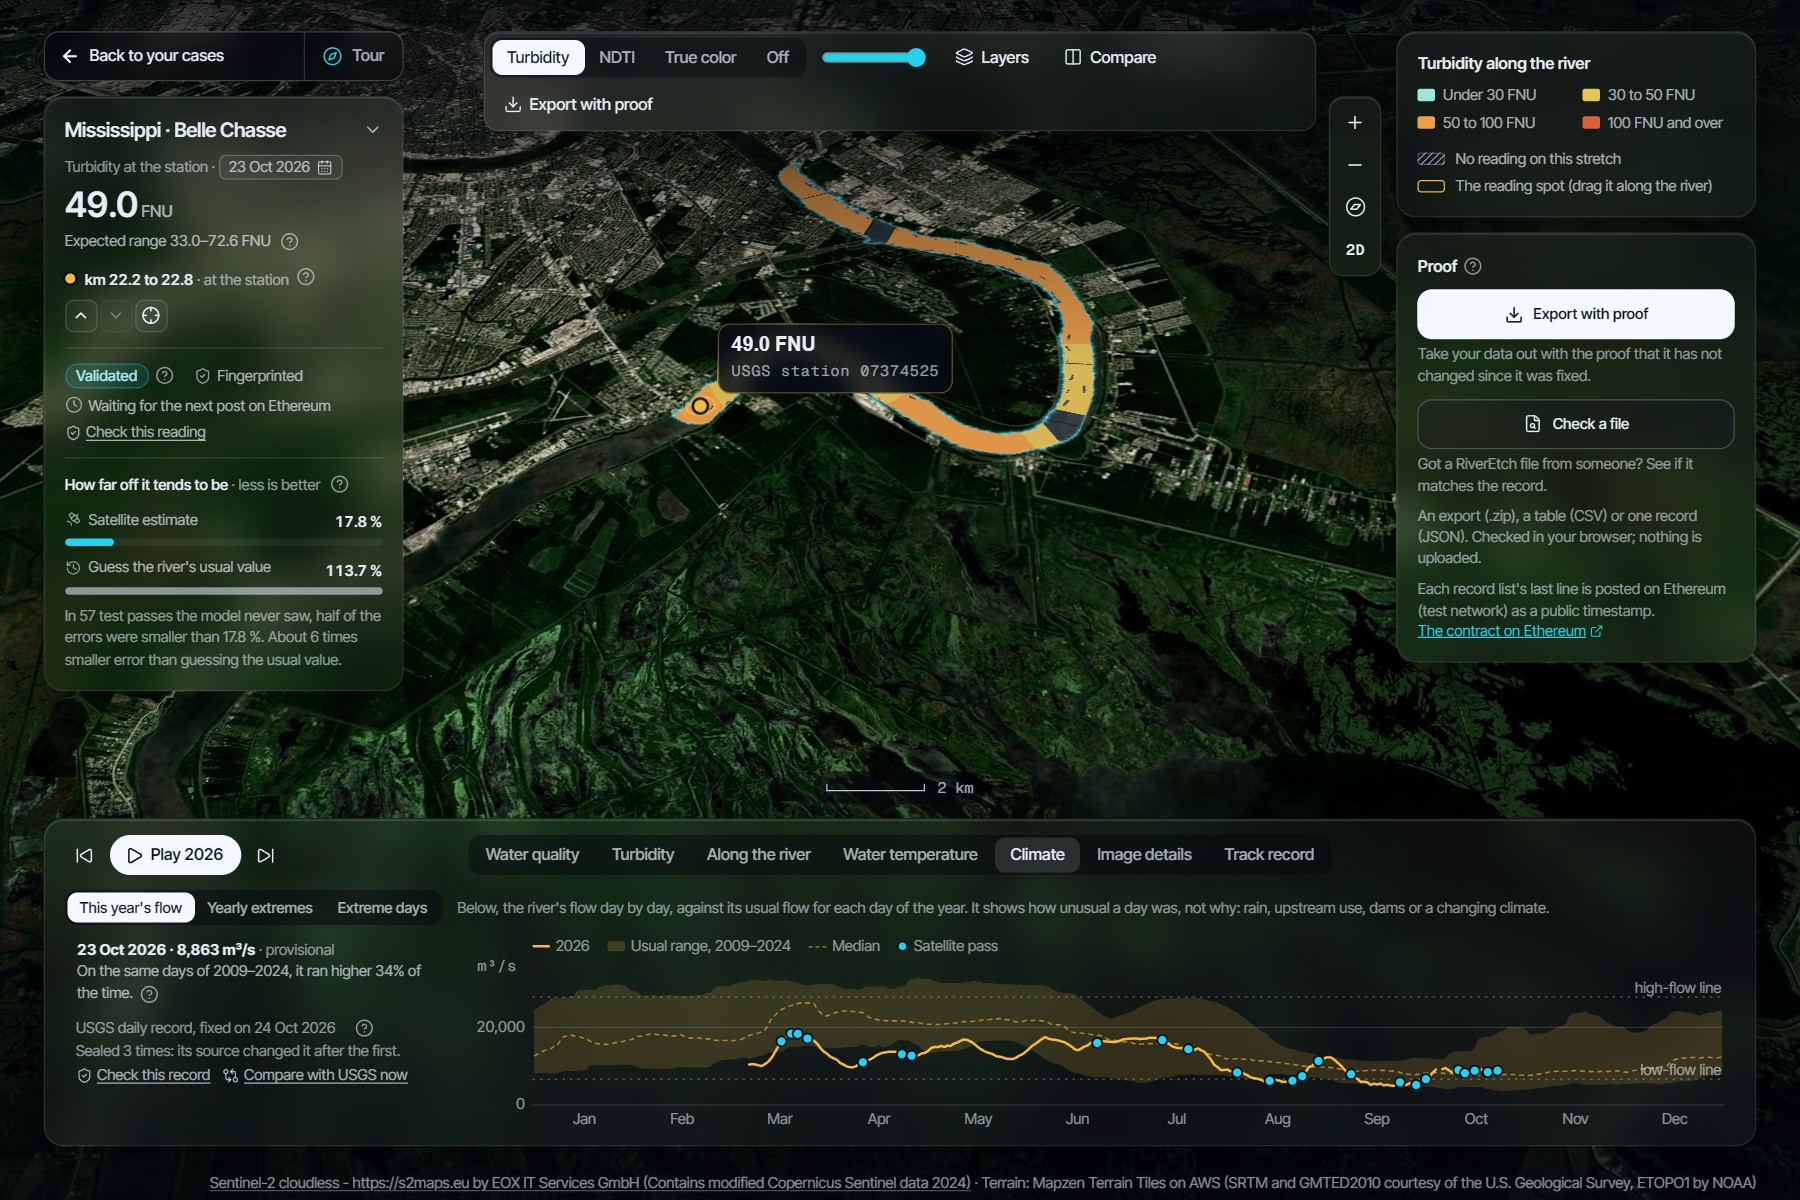
Climate flow
-
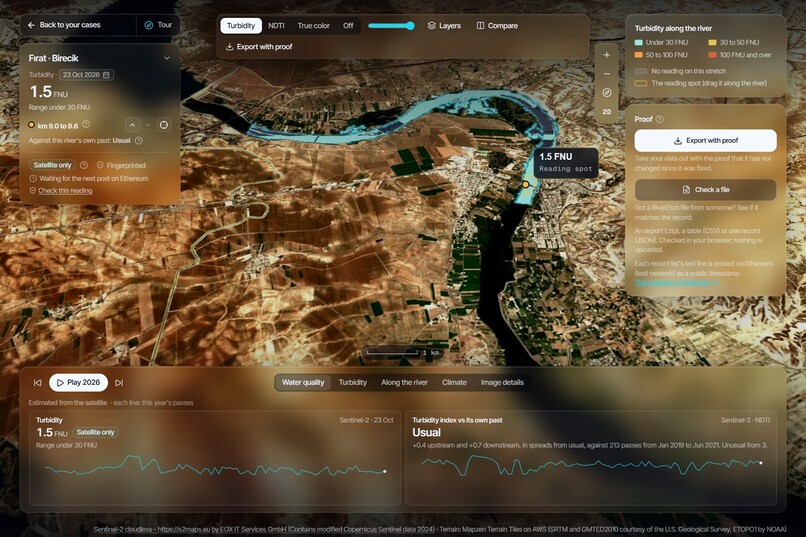
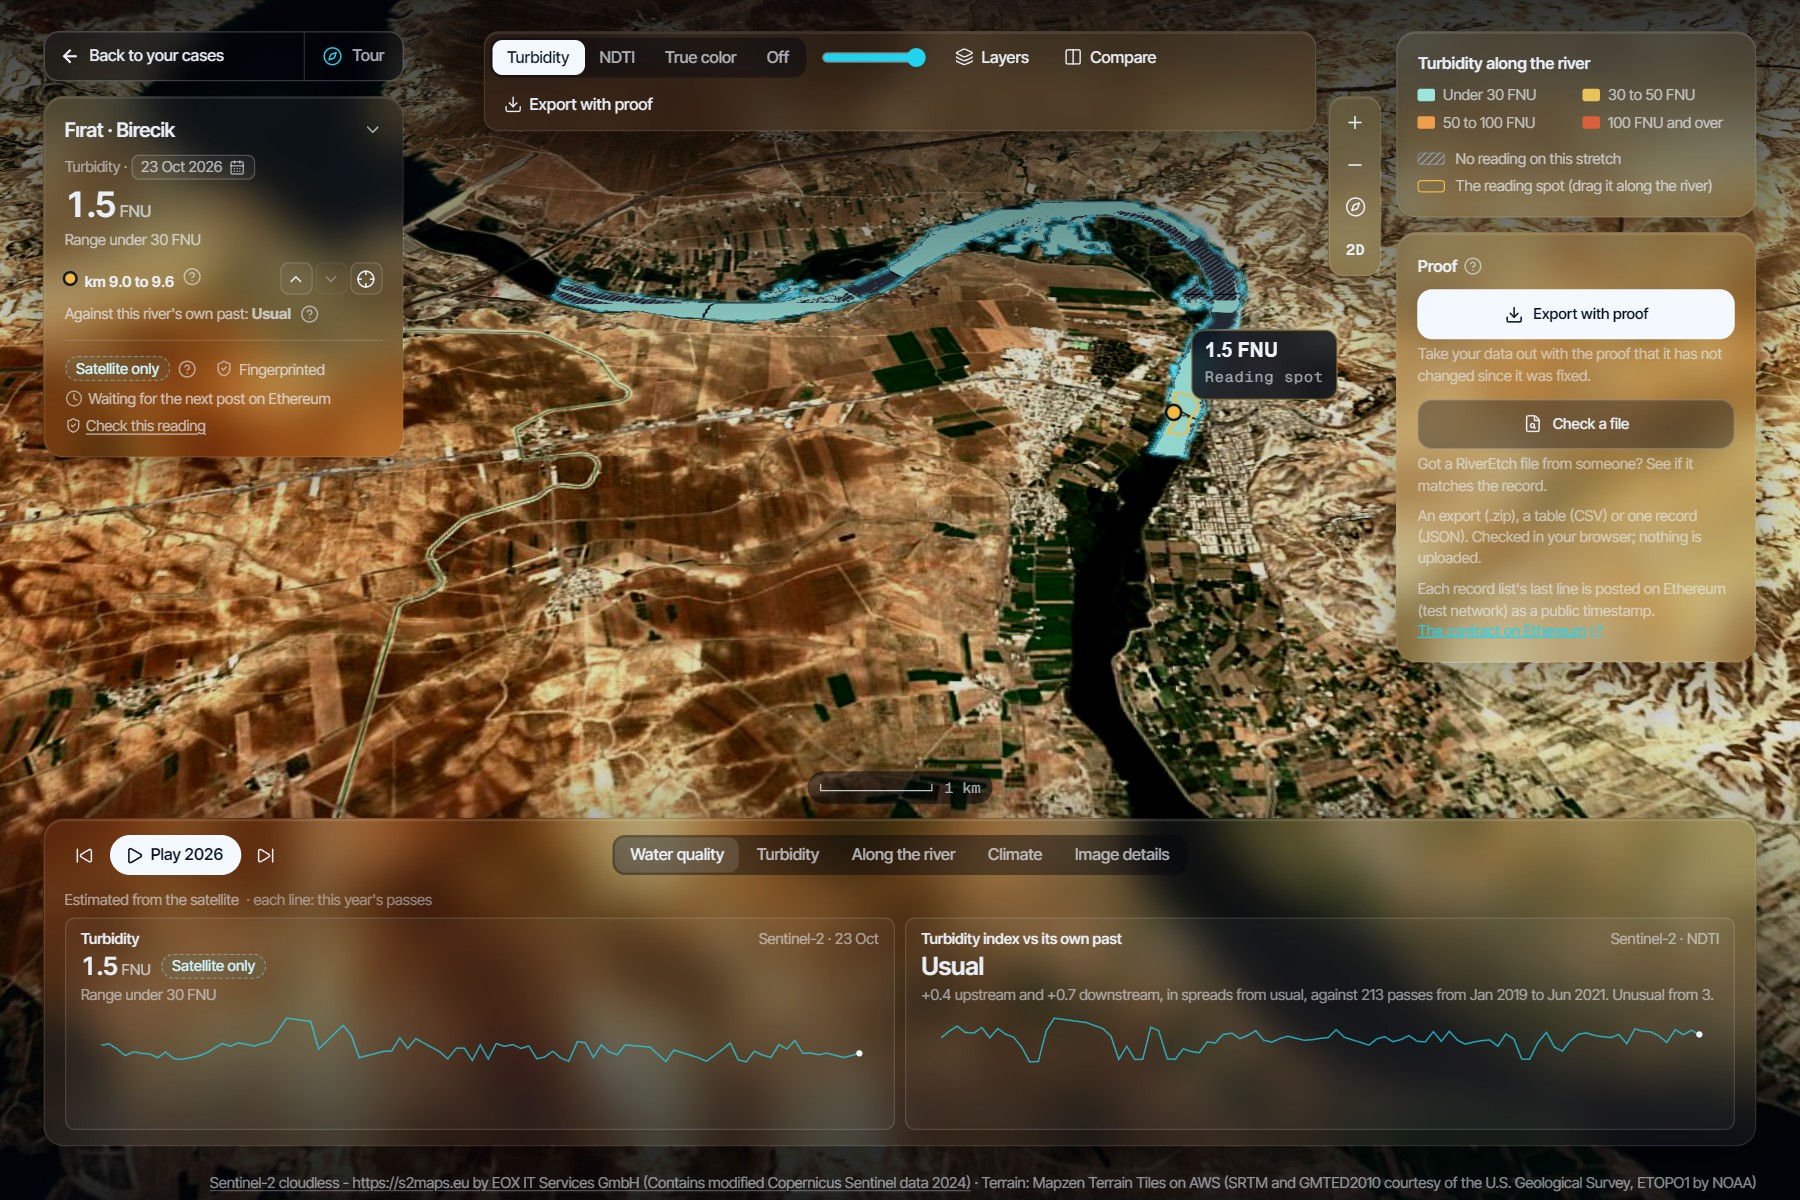
Firat River (Turkey)
-
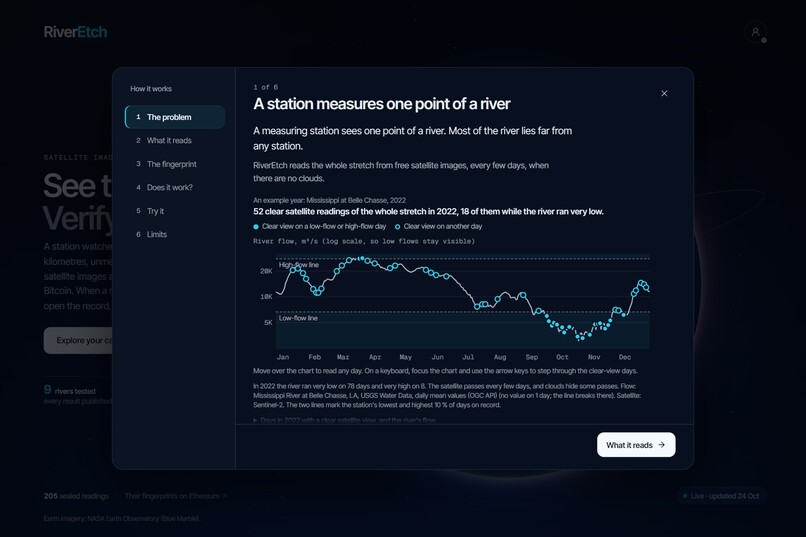
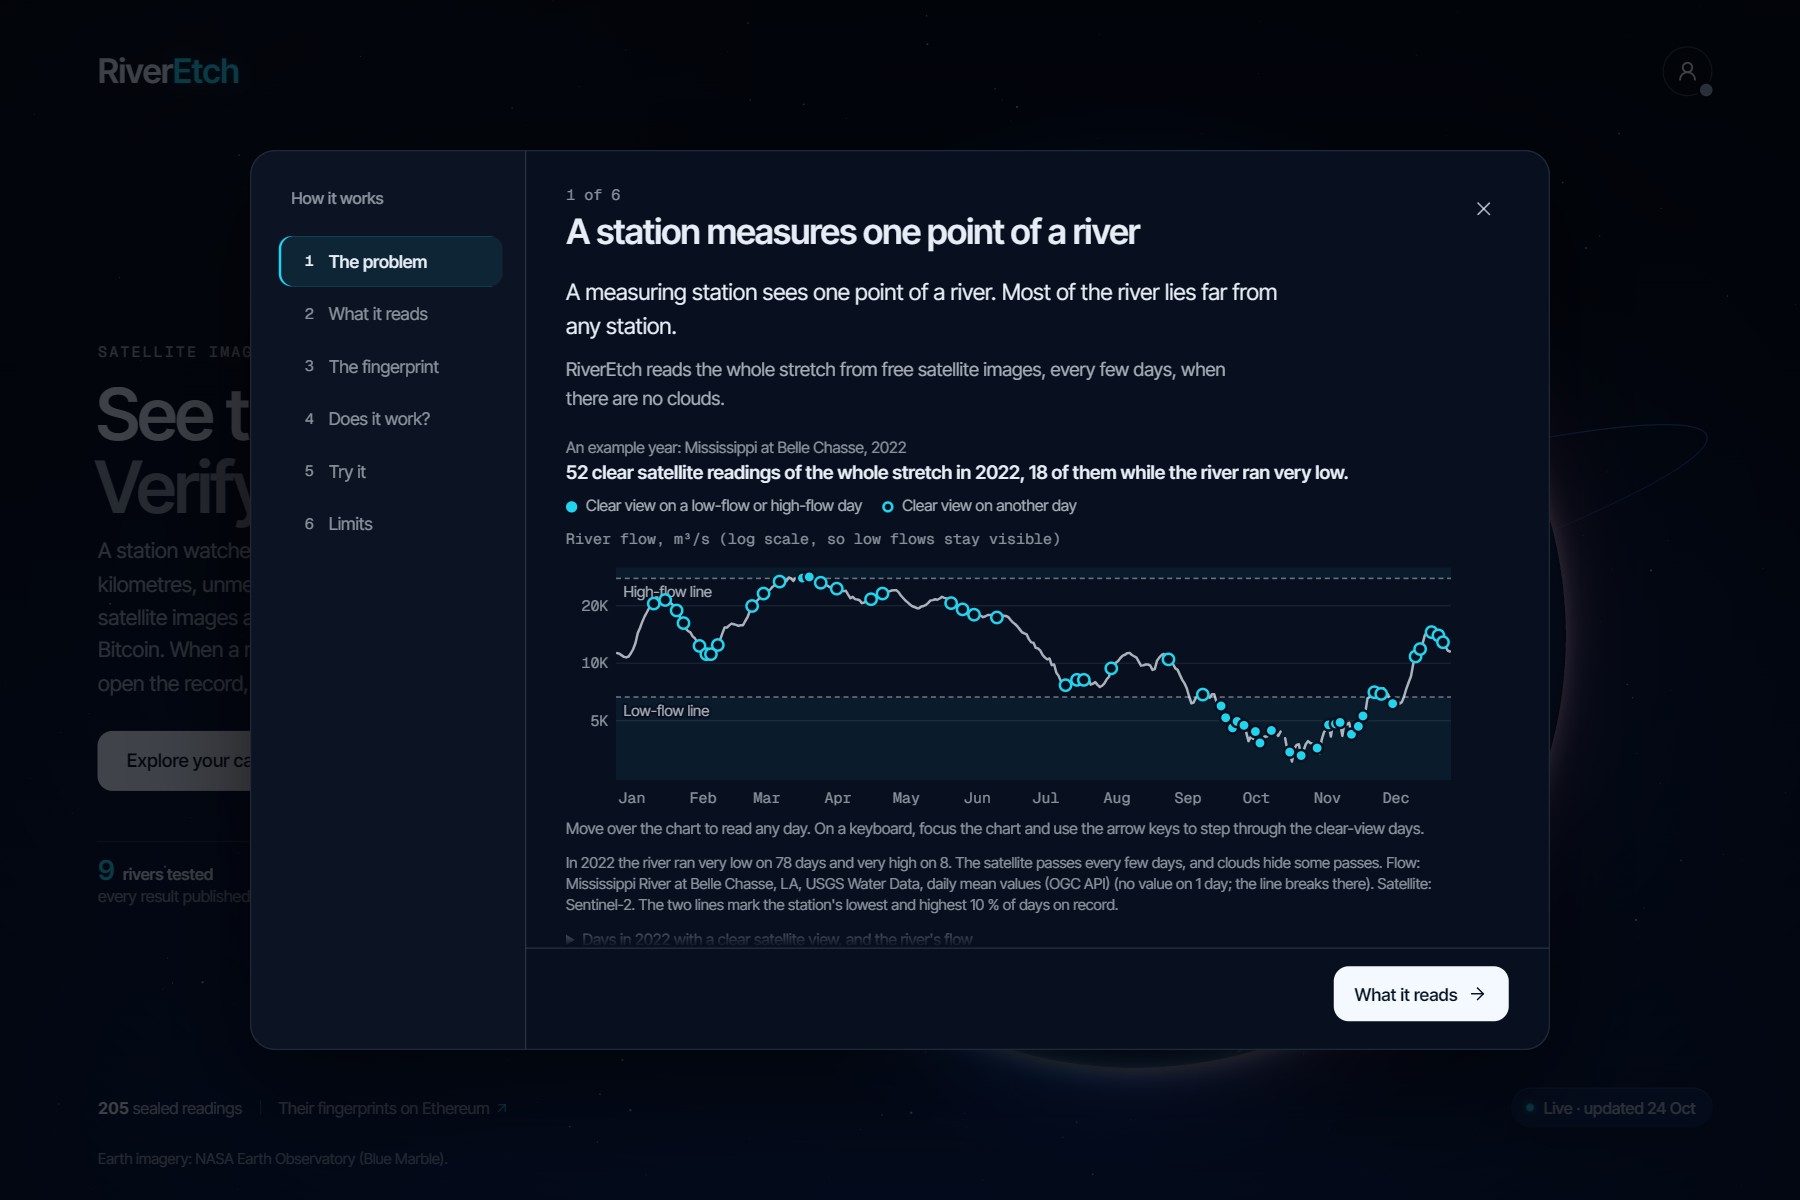
The problem
-
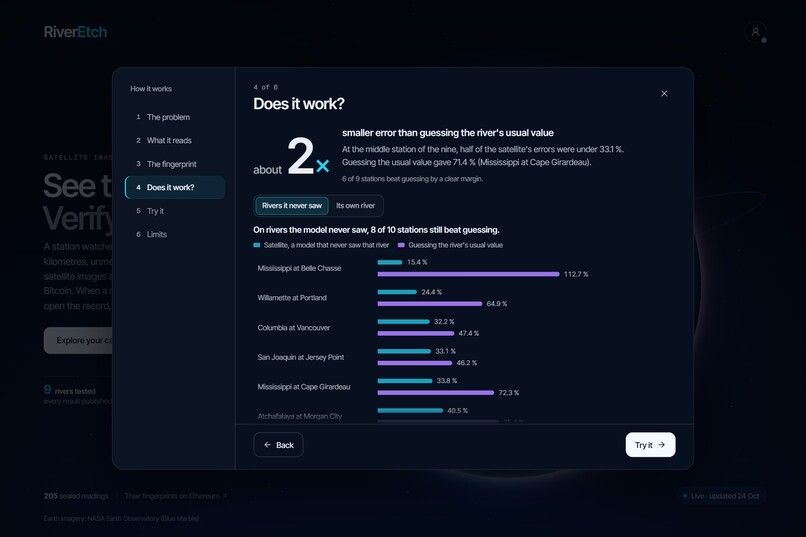
Does it work?
-
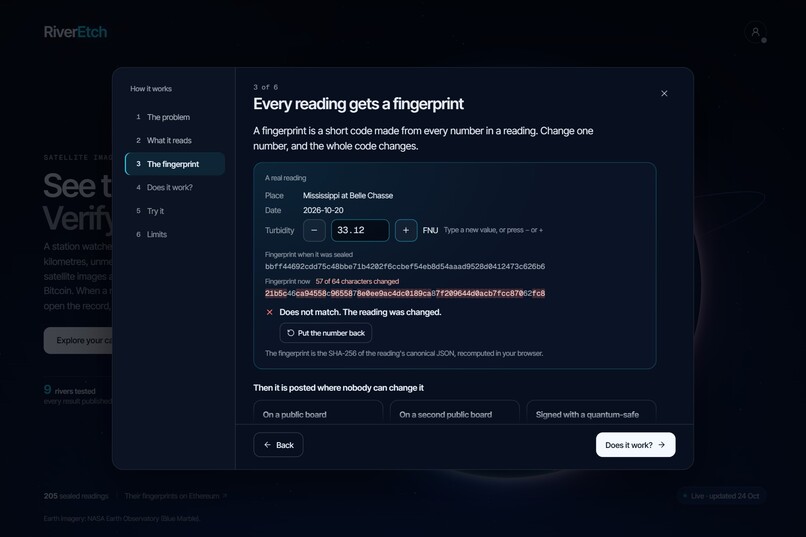
Change one number - blockchain validation
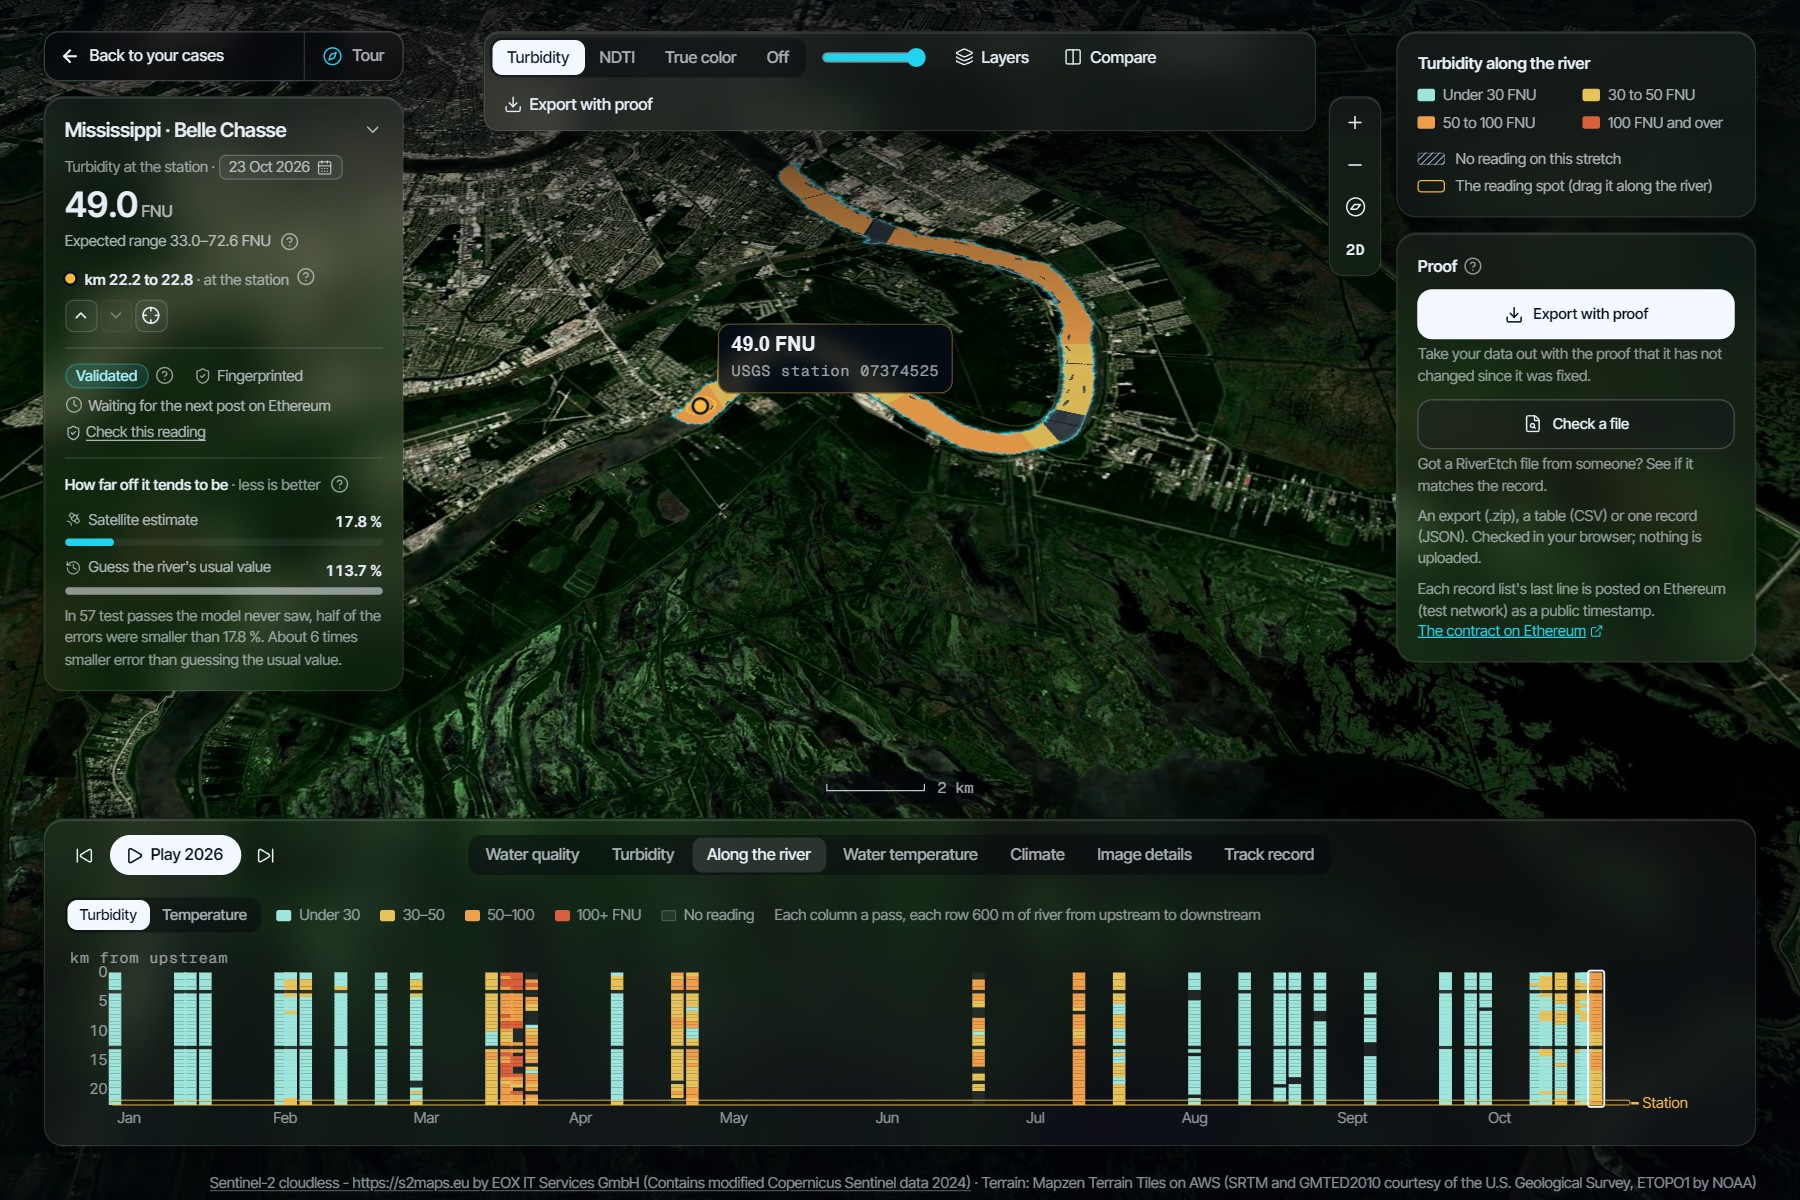
Track alignment: Climate Data & Environmental Monitoring
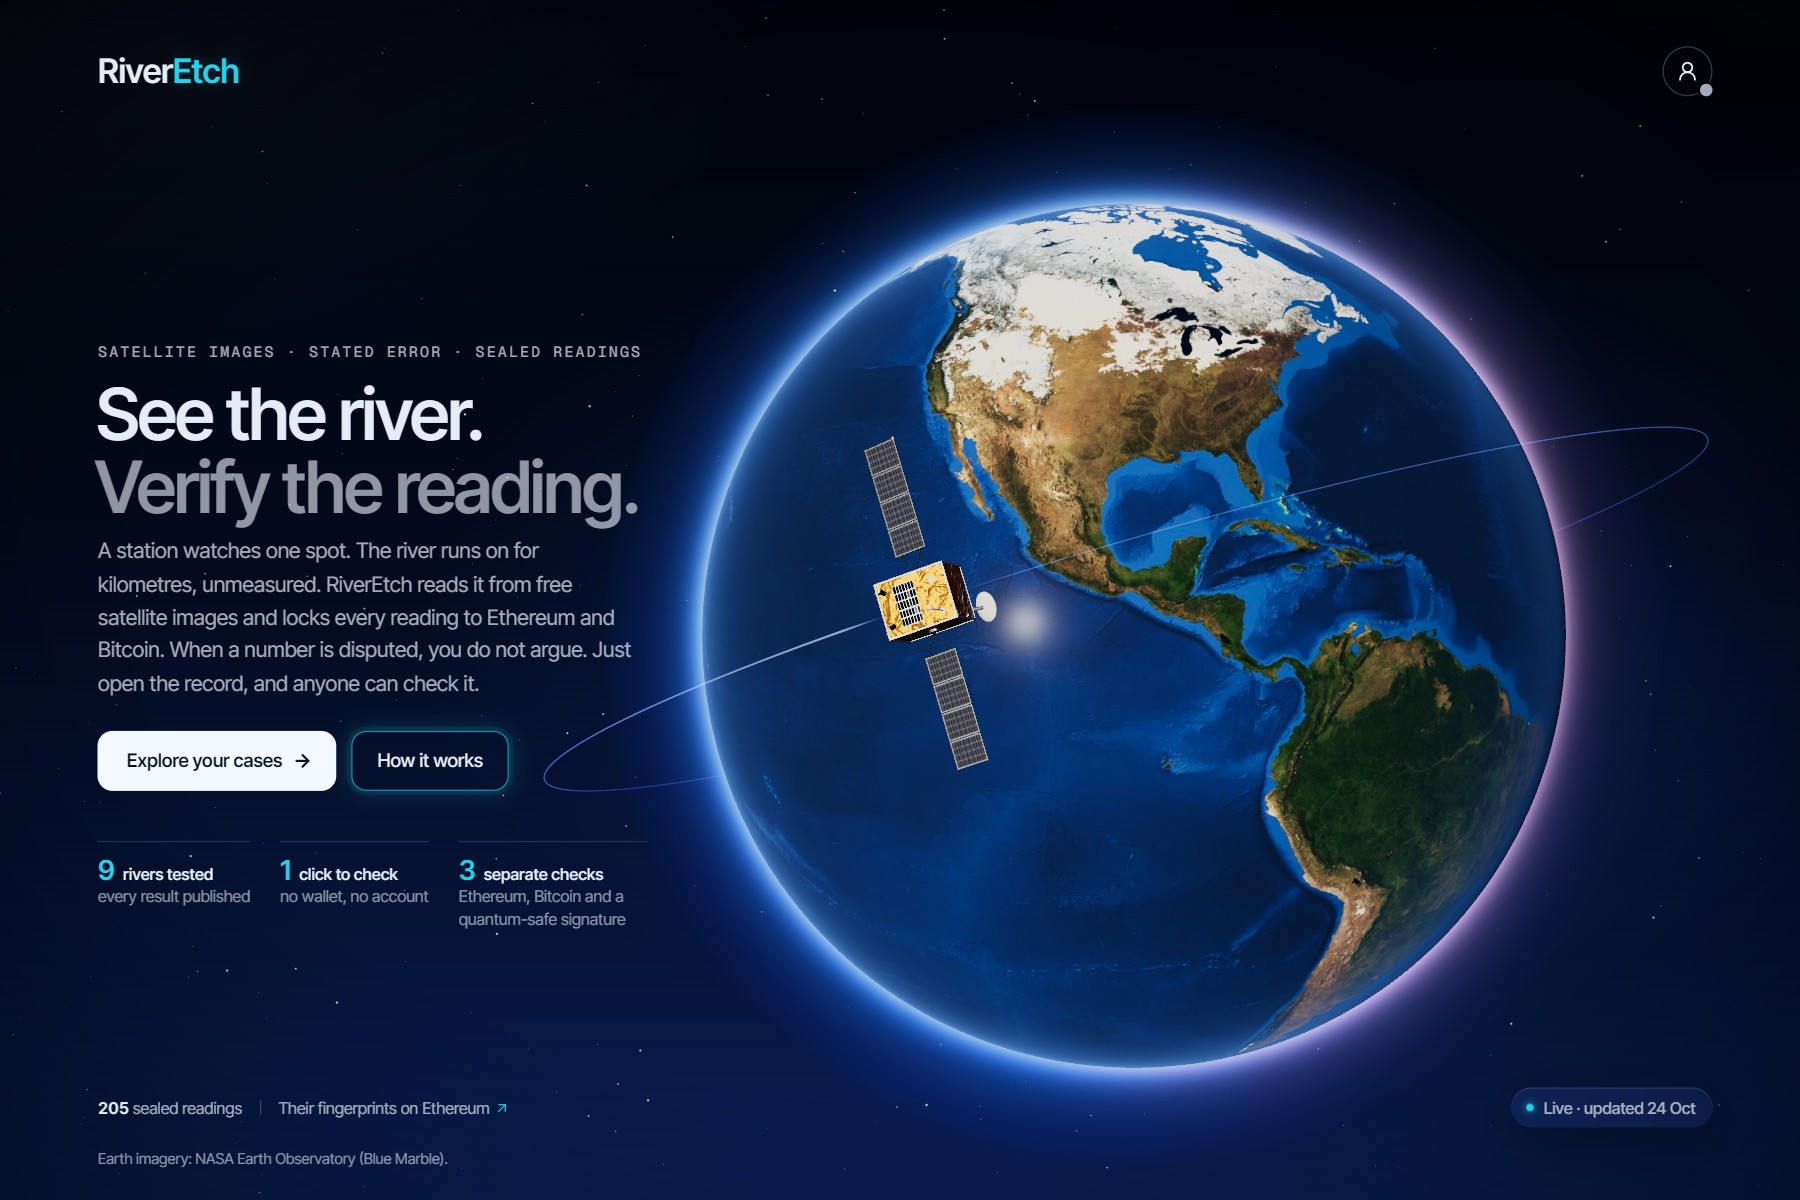
The challenge of this track is that environmental data is fragmented and hard to verify. RiverEtch is a climate data verification platform for river water. It turns Sentinel-2 and Landsat images into readings of turbidity and water temperature for stretches that no station measures, shows how well each model performed, and fixes every reading in a public record.
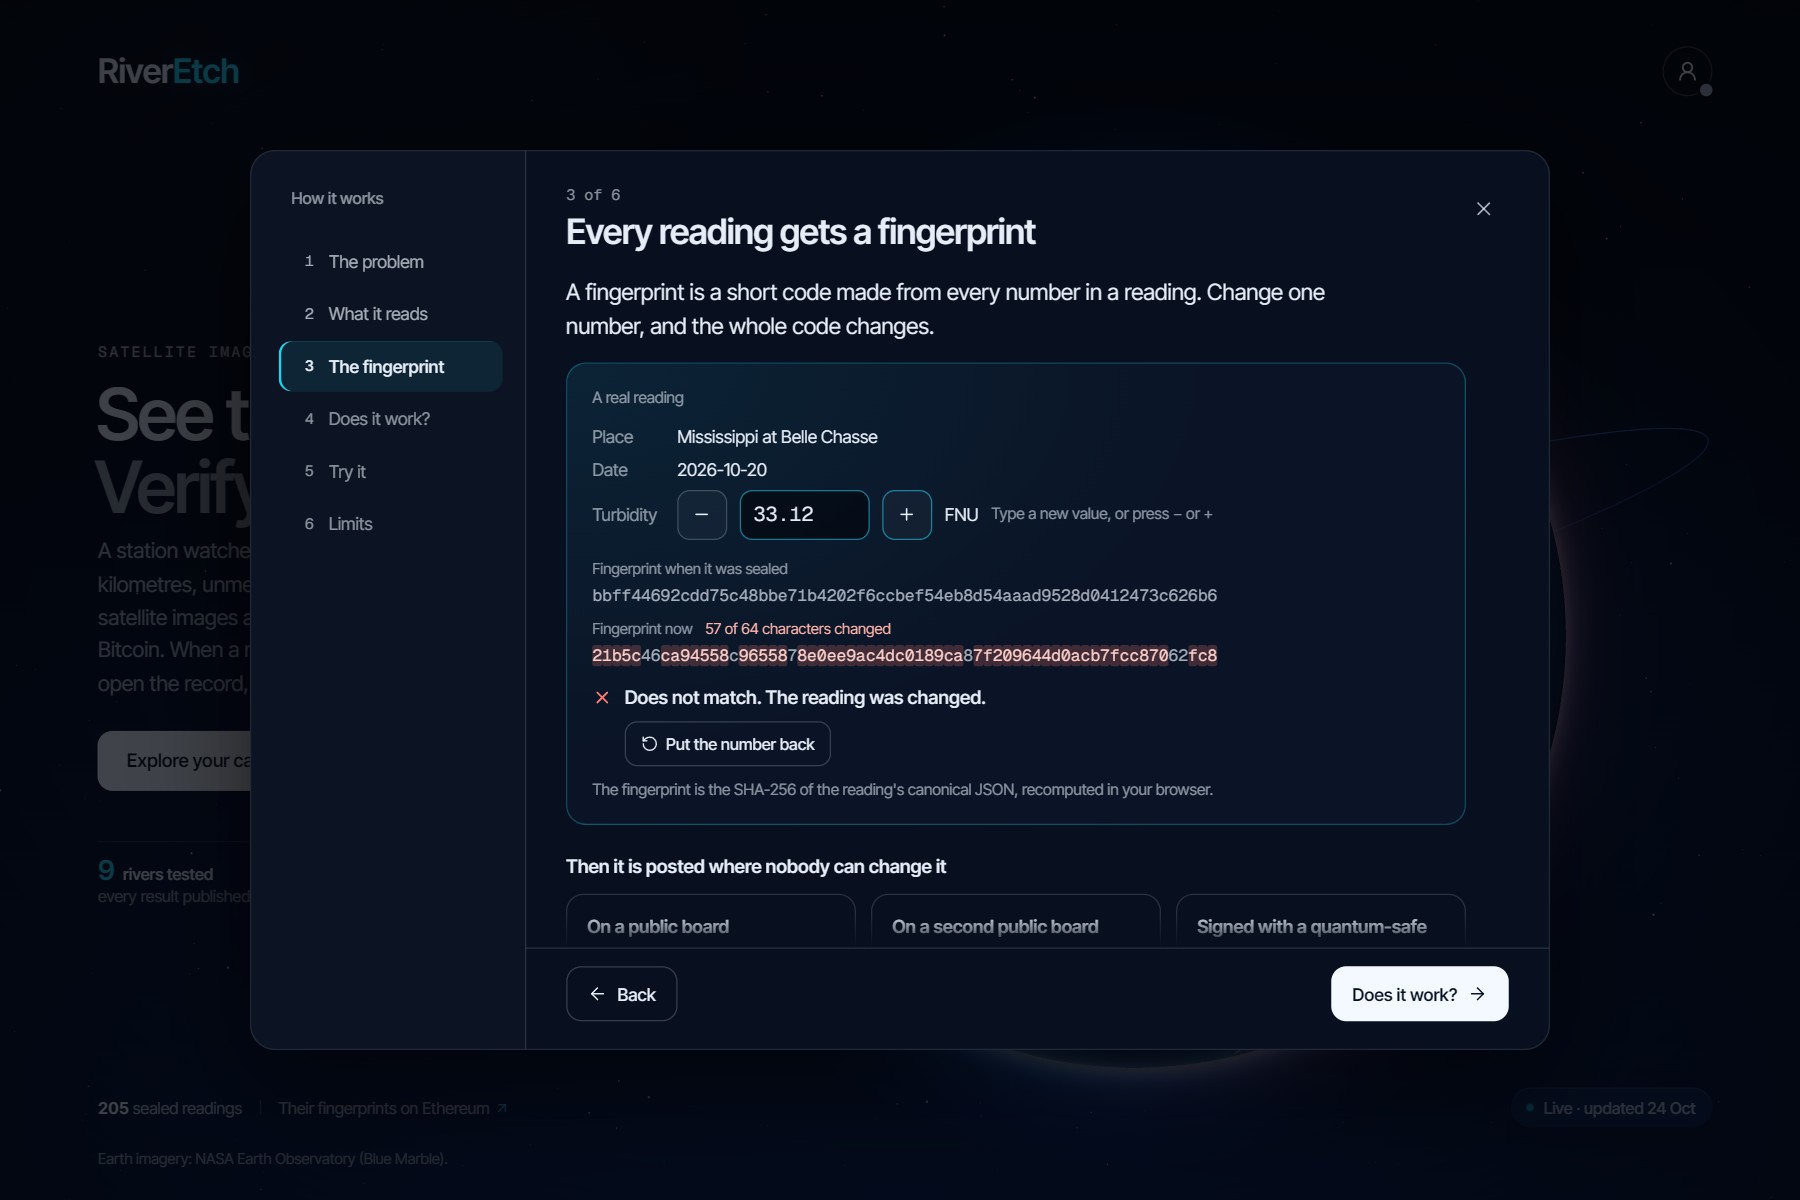
Each model was tested once, on years and on rivers it never saw, against USGS stations. Every test was written, frozen and anchored on Ethereum before it ran, and the failures are reported next to the successes. The images are free, the app needs no account or wallet, the code is MIT and the data are CC BY 4.0. Each reading gets a SHA-256 fingerprint, posted on Ethereum (Sepolia) and timestamped on Bitcoin, plus an ML-DSA-65 quantum-safe signature, and a browser checks all of it.
RiverEtch uses remote sensing, not an in-river sensor network. Satellites already in orbit do the measuring, so there is nothing to install, and RiverEtch makes their data checkable. That fits the hackathon's COP 31 focus on climate data that organisations can verify.
The problem, from a satellite image to a number you can cite
Rivers are monitored at points. A station measures the water at one place, and the stretches between stations are read by nobody. Satellites see the whole river, but a satellite estimate is not yet evidence, and three gaps stand in the way.
The first is coverage. A measurement describes only the place where it was taken, and most of a river lies far from any station, so the water there goes unmeasured.
The second is validation. An estimate deserves trust only if its error was measured on data the model never saw, and only if the test was fixed before the answer was known. Otherwise a model can be tuned until the test passes, and no reader can tell.
The third is integrity. A published number can be revised or quietly corrected, and even station values are often provisional. Without a date that no single party sets, a reader cannot tell what was known when.
This is the problem the track describes, environmental data that is fragmented and hard to verify. It matters for climate because the stretches between stations are where droughts and floods go unmeasured, and continued warming is projected to make wet and dry extremes more severe (IPCC AR6 WGI, SPM B.3.1).
What RiverEtch does
RiverEtch reads turbidity, and the choice is deliberate. Turbidity is how cloudy the water is, caused by suspended clay, silt, algae and organic matter. It rises when storms wash soil into a river and when high flows stir up the bed. It matters for three reasons. Suspended particles cut the light that reaches aquatic plants and can harm fish and other aquatic life. They can shelter microbes from disinfection, which makes turbidity a concern for drinking water treatment. Also, they carry metals, nutrients and bacteria on their surfaces, so a sudden change in turbidity is a reason to look closer. Turbidity does not say by itself that water is good or bad, but it is closely tied to suspended sediment, which the USGS calls an important factor in the quality of water (USGS, EPA).
Turbidity also changes the colour of the water that a satellite sees, which is why RiverEtch can read it from Sentinel-2 images. At every clear pass, each water pixel of the river gets a relative index of how muddy it is, and clouds, glare and river banks are left out. A frozen model then turns the pass into a value in FNU, the unit of turbidity. Where a station can check it, the value comes with its 90% range, tested against that station. Elsewhere it comes with the range of its class. If the image falls outside what the model was trained on, RiverEtch gives no reading and says why.
The same model reads a window every 600 m along the reach, so the map paints the whole river by turbidity class (under 30, 30 to 50, 50 to 100, and 100 FNU and over), and the reading spot can be dragged along it to see the value of each stretch. Point at any stretch and it gives its own value.
Water temperature, read from Landsat's thermal band, is the second variable. It appears on the days Landsat passes over a clear river, as a value in °C with its 90% range at the station, where it was tested against a thermometer, and as a 5 °C band along the river, where no such test exists.
Every reading is fingerprinted so it can be checked later, and the app can export any of them with their proof and check a file someone sends you, all in the browser.
The calendar also opens 2019 to 2025, read again with the same frozen models to show how the river behaved through the Platte's 2019 flood and the Mississippi's low water of 2022 to 2024. These years are labelled "Recomputed, not sealed", because a fingerprint made today would only prove that the number exists today. Anyone can recompute them from the public images and the frozen models. Each case's Climate tab also shows the river's daily flow, from the USGS station or, for the Fırat, the Copernicus GloFAS flood model, sealed year by year exactly as its source published it, and a chart of this year's flow against the river's usual flow for each day.
Why a blockchain, and why AI
A seal shows that a reading was not changed, but it also needs a date that RiverEtch itself cannot move. A signed git tag gives only the signer's own date. A timestamping service gives a date from one company. A public chain gives a date that no single party sets and that nobody can edit.
RiverEtch uses two. A small contract on Ethereum Sepolia stores, for each record list, the fingerprint of its last line, its length and the block's time. Only the owner can add, and a list can only grow. No reading goes on chain. The same fingerprints are timestamped on Bitcoin with OpenTimestamps, which needs no key, and signed with ML-DSA-65, a post-quantum signature that the browser checks with the published key. The chain dates a reading. It does not make it right.
The AI part is supervised machine learning, trained on USGS station data and then frozen. At a station, turbidity comes from a ridge regression on Sentinel-2 reflectances and band ratios, pretrained on other US rivers and adjusted to that station. Where there is no station, and along the river, it comes from a LightGBM model (gradient-boosted trees) trained on nine river groups. Water temperature is a calibration of Landsat's surface temperature, not machine learning. The 90% range comes from split conformal prediction. Every record names the hash of the model that made it, and the model gives no reading when an image falls outside what it learned.
Does it work?
Every figure here comes from a locked test (December 2023 to September 2026) that training and model selection never saw, scored once. Each one sits beside its baseline, the error you would make without the satellite.
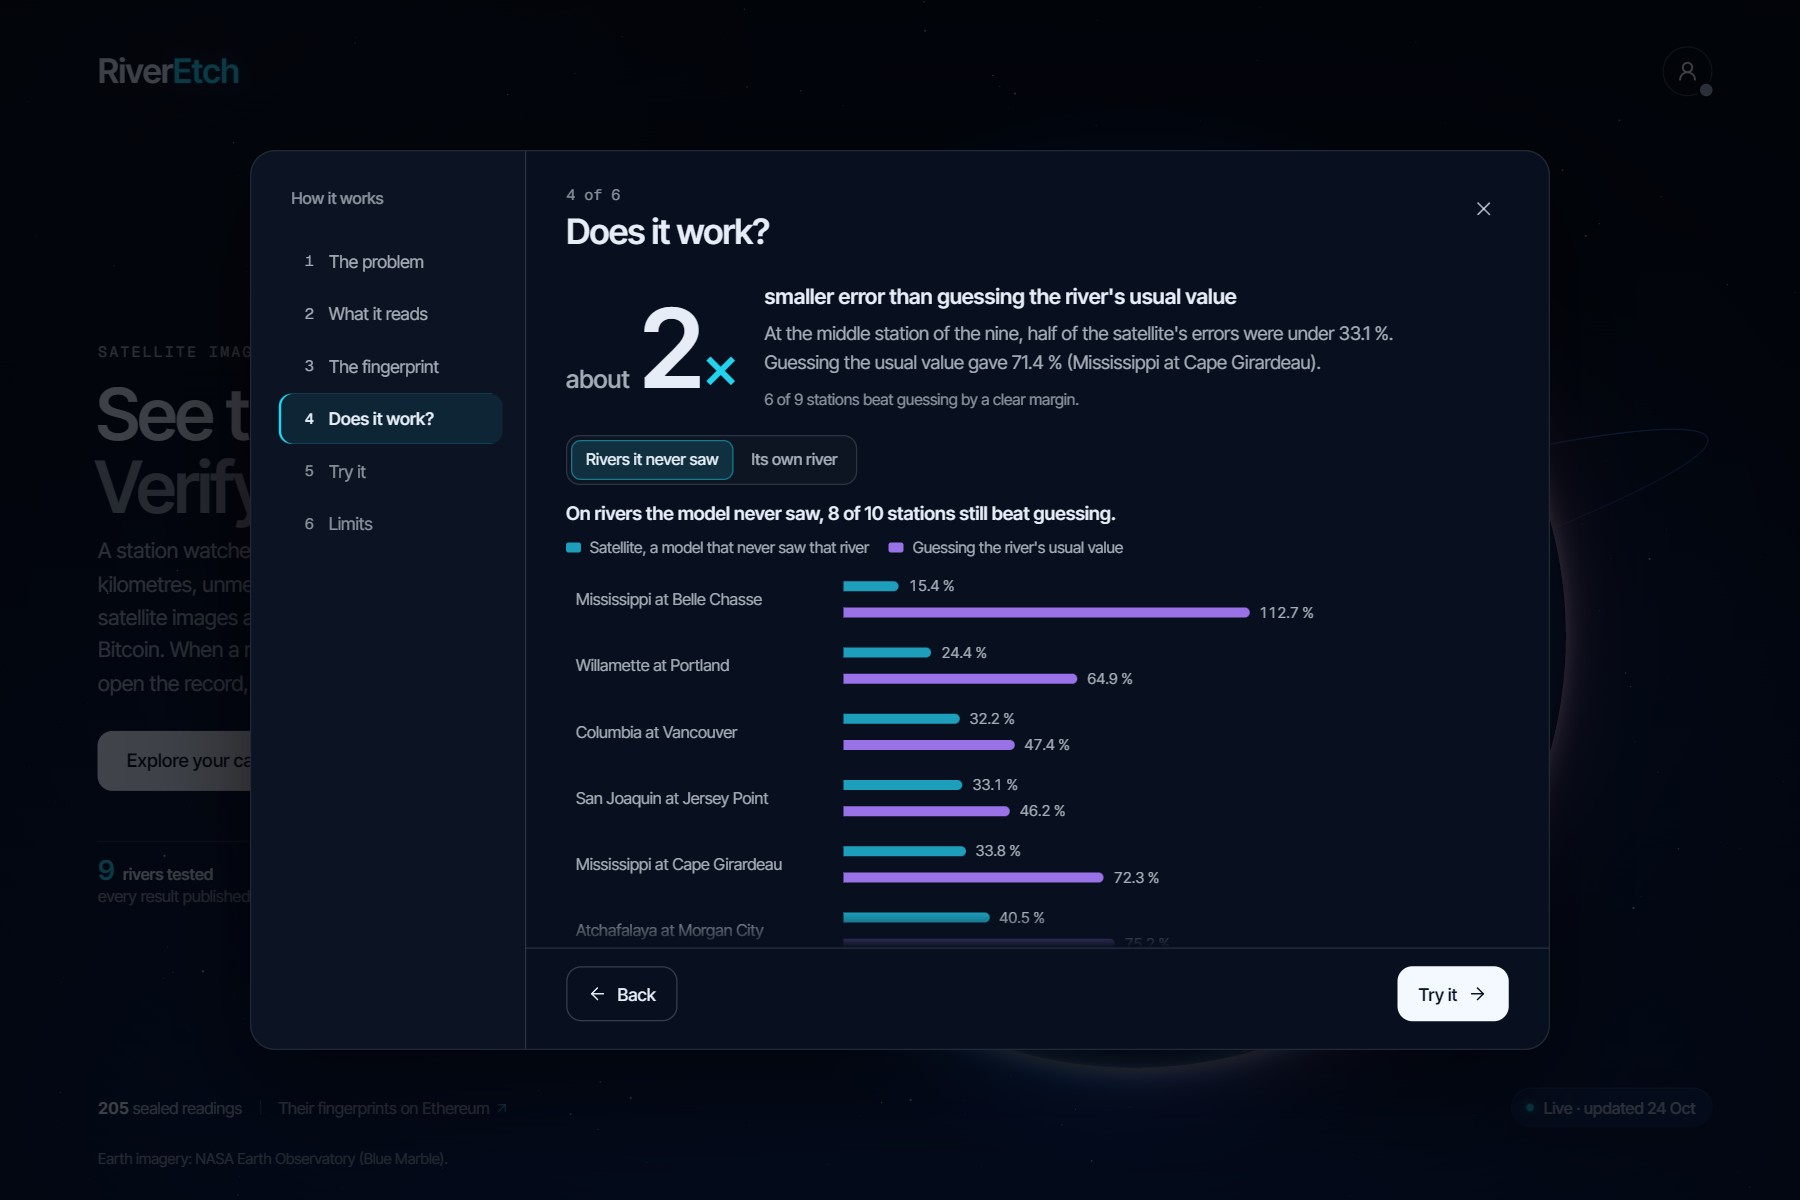
Across the nine rated stations on eight rivers the median error was 33.1%, and at six of the nine the satellite beat the usual value by a clear margin. The best cases were the lower Mississippi at Belle Chasse (17.8% against 113.7%) and the Platte at Louisville (20.3% against 66.9%). It works best on sediment-carrying rivers.
For a river with no station, we held each river out in turn. The model's value had a median error of 37% over 298 passes, it beat guessing at 8 of 10 stations, and its class matched the station in 160 of those passes, against 61 for always naming the most common class. Discharge, dissolved oxygen, specific conductance and suspended sediment were tested the same way and are not shown as satellite readings. The per station table is in the repository, and CI recomputes every figure from committed inputs.
Who it is for, how it scales and how easy it is to adopt
It is for people who have to answer for a river: water utilities, environmental and water agencies, river basin authorities, and the researchers and journalists who check their numbers. A utility can see how muddy the water is upstream of its intake, an agency can follow a stretch with no station during a flood or a drought, and a basin authority can share one record that every party can verify. A colleague or a reviewer can check any file they receive.
It scales through images, not hardware. Sentinel-2 and Landsat are free and cover rivers worldwide, so a new reach needs a window plan, not a sensor. Today the app follows four reaches on three rivers. Outside the United States, at the Fırat (Euphrates) at Birecik, Türkiye, it gives a value with its class's range and no error figure, because no station there can measure one. A daily job on GitHub Actions needs no secrets, the app needs no account or wallet, and any reading can be exported with its proof.
How we built it
The pipeline is Python 3.12 managed with uv. It reads Sentinel-2 and Landsat scenes, builds the records and runs the tests. The contract is Solidity, built and tested with Hardhat, and deployed on Sepolia. Bitcoin timestamps use OpenTimestamps. Signatures are ML-DSA-65, checked in Python and in the browser. The web app is Vite and React, with MapLibre for the map and Three.js for the globe. GitHub Actions reads, seals and timestamps the new passes twice a day on public data, with no secrets, and publishes them to a data branch. The owner then signs the new heads and posts them on Ethereum. RiverEtch was built by one person.
Limits
- A seal shows that a reading was not changed; the tests above show how close it is.
- Away from a station, the value comes with its class's range, which marks the class's edges, not a margin of error; the error measured on rivers the model never saw is in the report.
- Clouds hide some passes, and a cloudy pass simply has no reading.
- The prospective count is still small, so the app shows counts, not percentages, until there are 20 passes.
- Anchors are on Sepolia, a test network that suits a prototype; the Bitcoin timestamps and the signatures do not depend on it.
What's next for RiverEtch
These are plans, not features. Turn the "Request a study reach" form, a preview today, into a real intake so anyone can propose a river. Move the anchors from a test network to a main network. Keep a second copy of the records outside GitHub, so they do not depend on one repository. And test more rivers outside the United States, so a value there can come with a measured error.

Log in or sign up for Devpost to join the conversation.