
Challange Riski is a product of the Goldman Sachs Challenge which was to "build a risk analysis tool that someone would use when considering how to manage and invest their money."
What it does
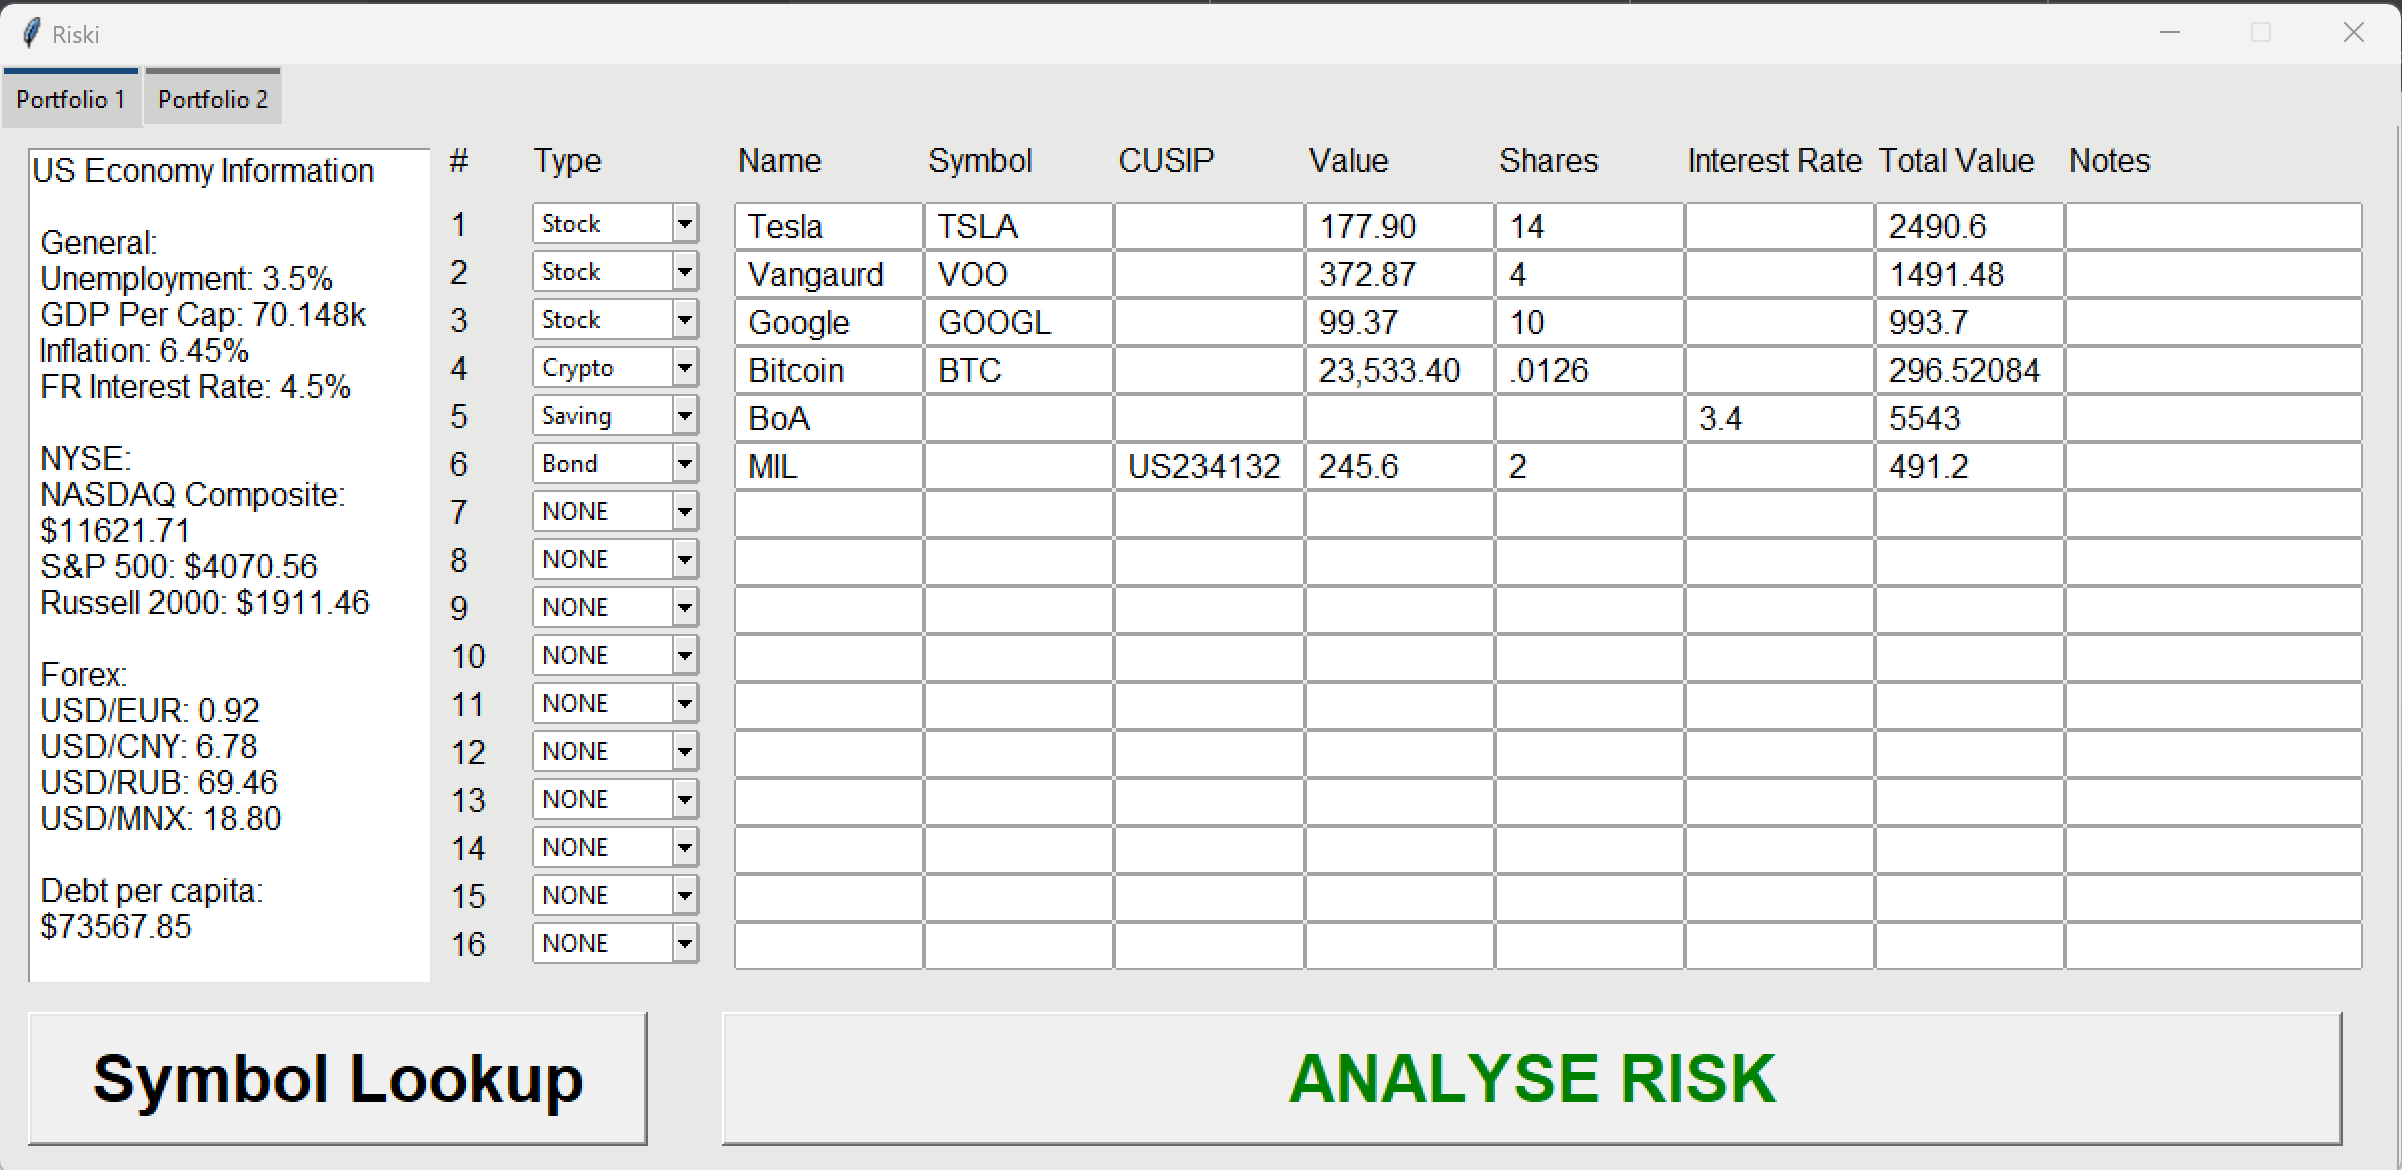
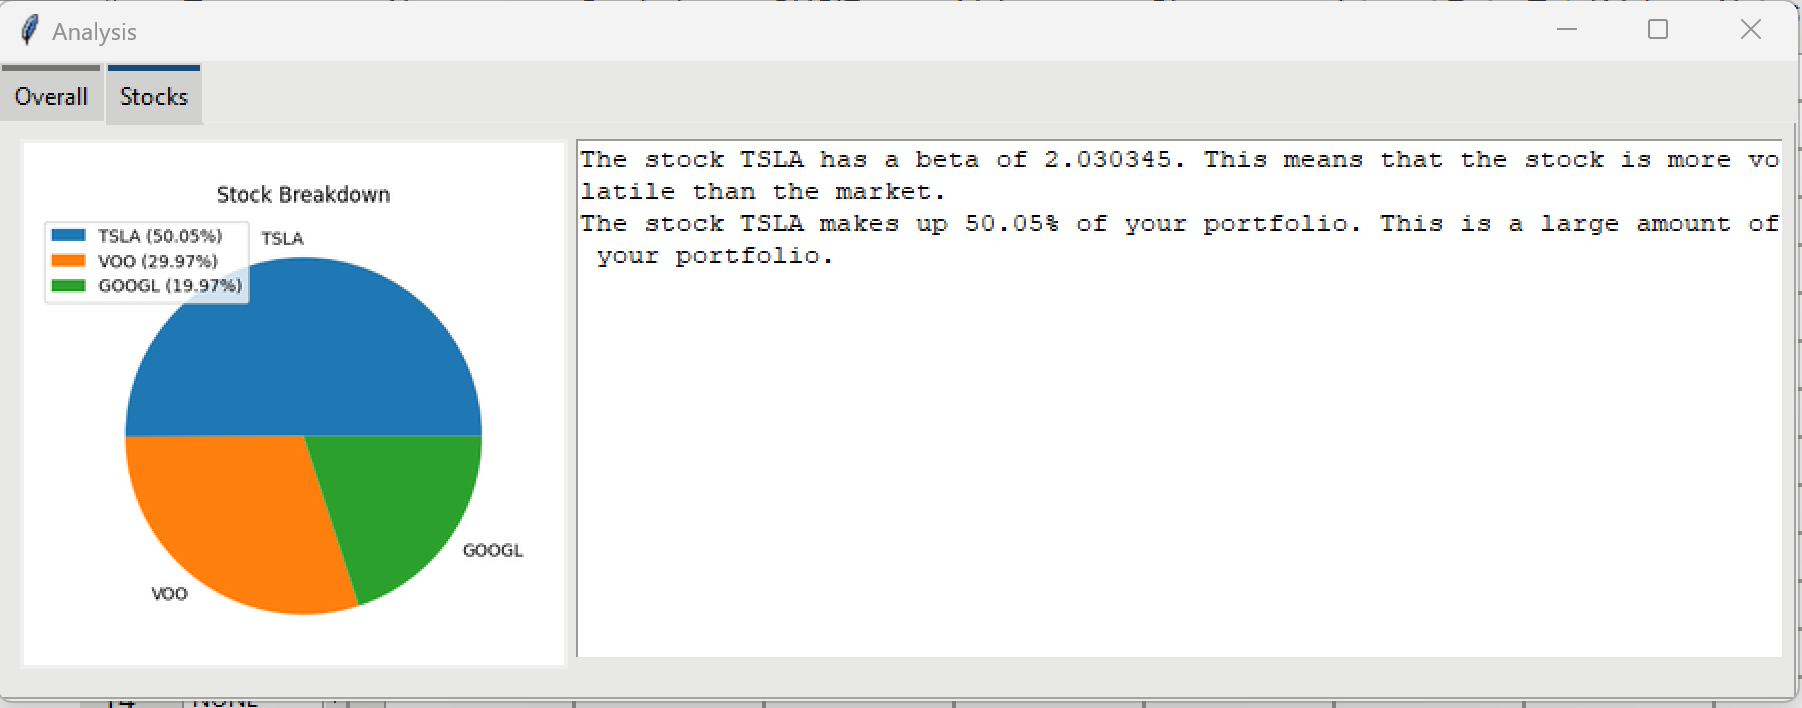
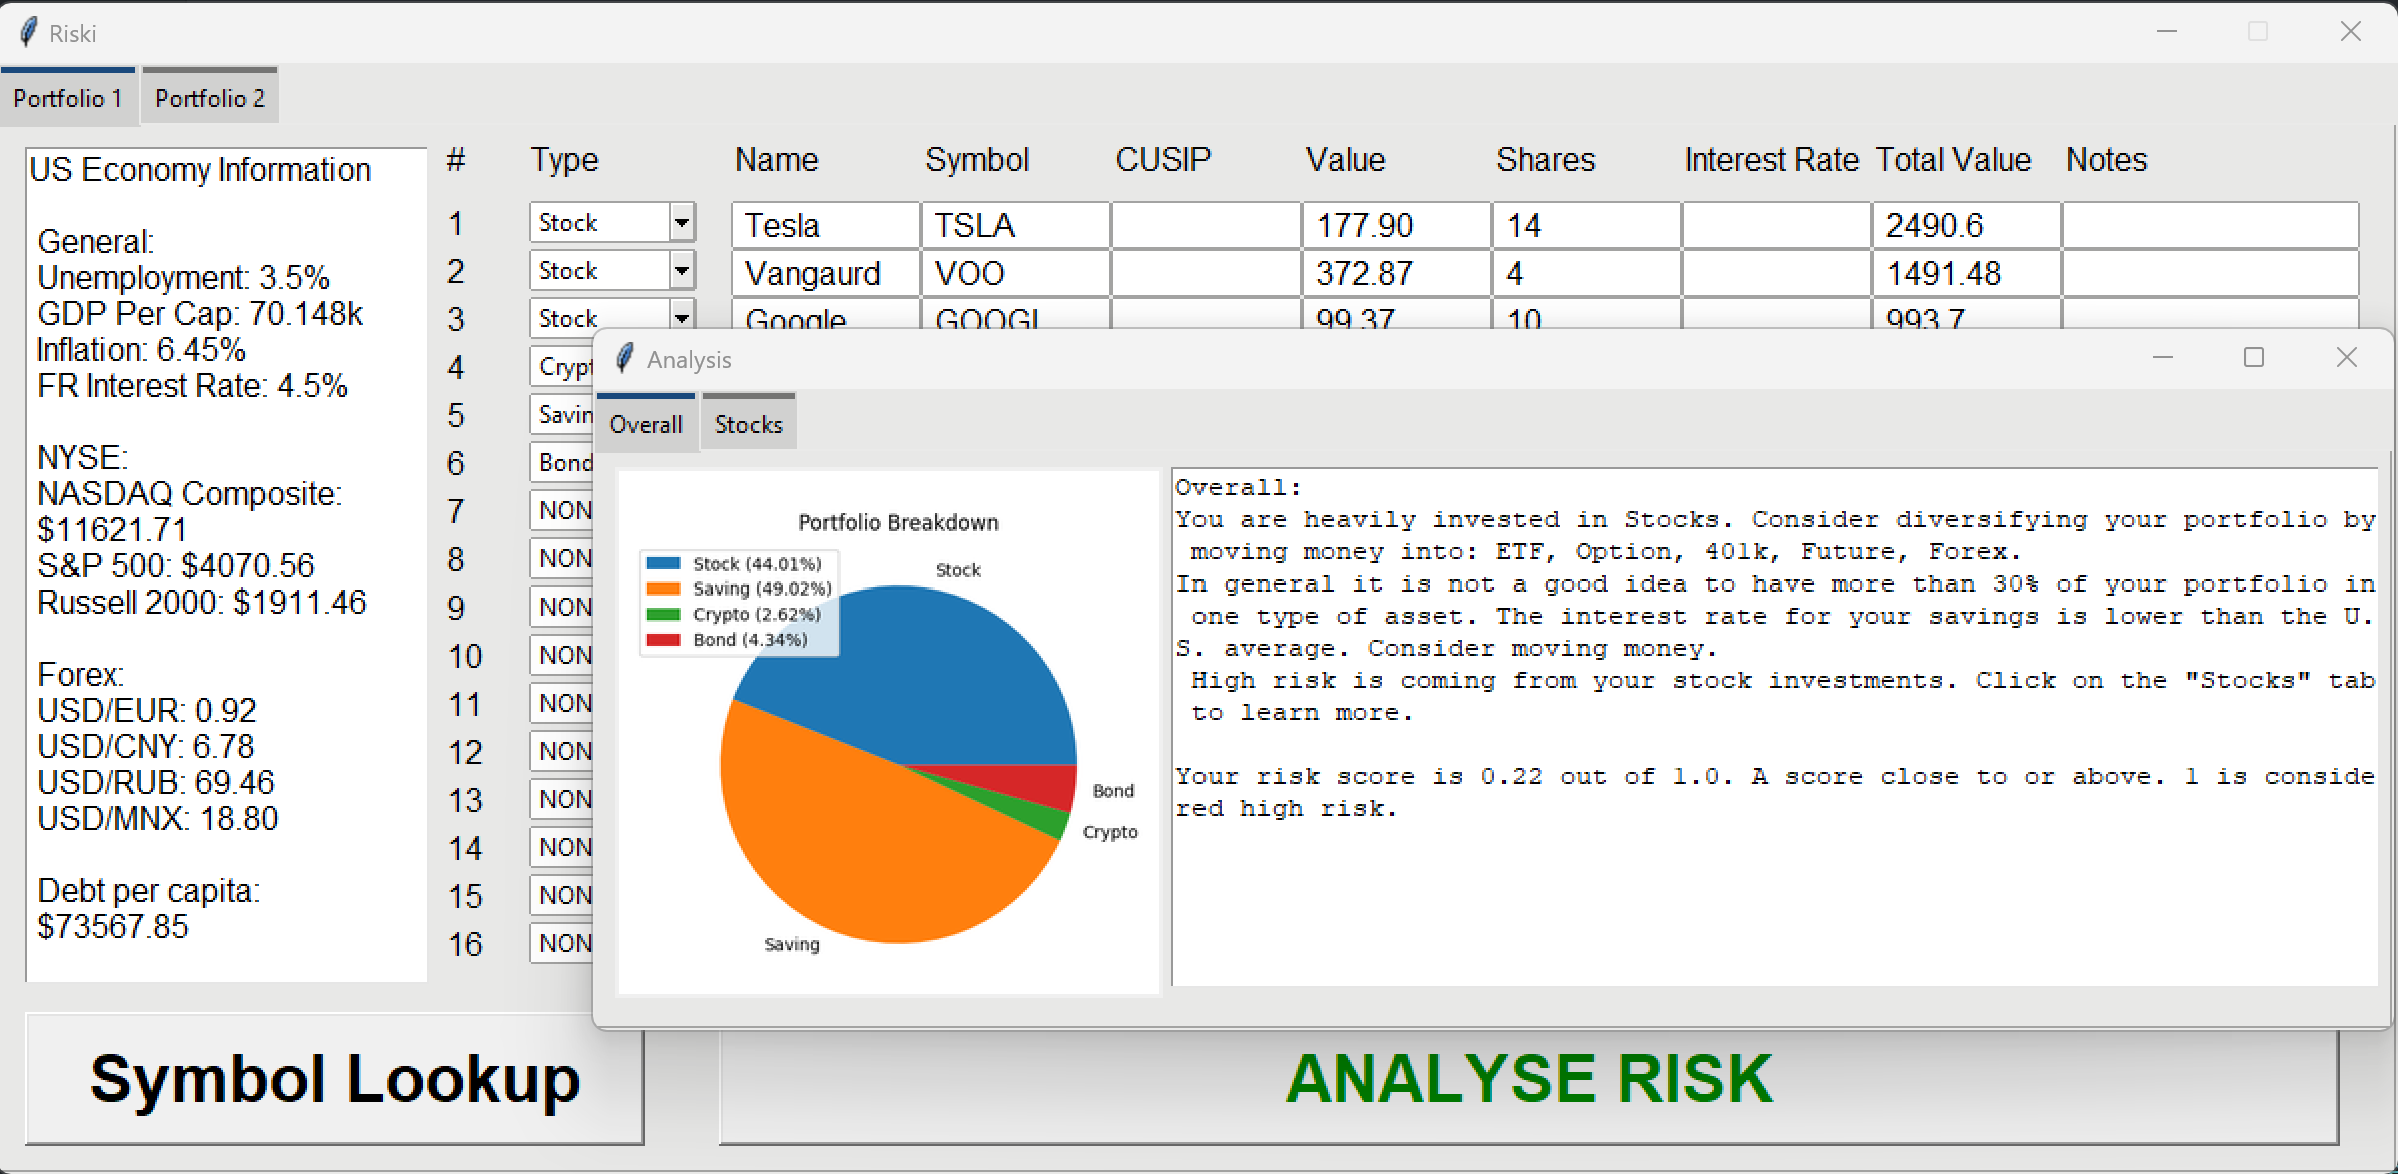
Riski takes in your portfolio data and analyses it. It used real-world statistics, that are fetched from API's, to calculate a risk score. The risk algorithm is a system of weights combined with your portfolio's values and percentages. For stocks, the risk is based on their beta and their percent in your portfolio. Unemployment, interest rates, stocks and bonds, and diversification. The challenge asked us to incorporate one other way to calculate risk and for that what better than diversification? We decided to do this due to how diversification is one of the largest factors that play into risk. Diversification can be seen in risk by messages telling you whether you are over-invested in certain assets and can also be seen in the pie charts Riski creates for you.
How we built it
We built it using python, tkinter, PIL, requests, finance, and many more.
Challenges we ran into
One challenge we ran into was later development with the UI. Unfortunately after creating a large UI in our selected software the program took a long to open and made the debugging process challenging.
Accomplishments that we're proud of
We are really proud of the fact that we created a complete and working risk management tool within 24 hours. The use of API's and real-world data factored into our risk calculations is also something to be proud of.
What's next for Riski
We plan on re-making Riski in a multi-platform system such as React.js so we can adapt it to a website and an app. We also plan on improving the risk algorithm and adding more factors that play into it.

Log in or sign up for Devpost to join the conversation.