-
-
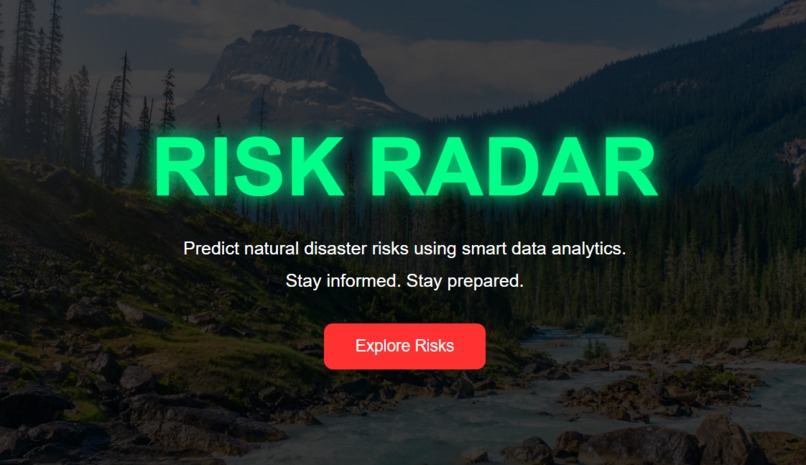
Our website's homepage
About the Project
Risk Radar was inspired by the increasing unpredictability of natural disasters and the need for better awareness and preparedness tools. The goal was to build a system that not only visualizes disaster-prone regions but also helps users understand risk levels in a simple, interactive way and provides practical safety guidance.
We built this project using Python with the Streamlit framework for the frontend and interactivity. For geospatial visualization, we used Folium to create interactive maps with color-coded risk zones. Data processing was handled using Pandas, and we designed a custom risk-scoring model based on weighted factors such as historical frequency, population density, coastal exposure, and infrastructure resilience.
One of the key concepts behind the model is a weighted risk equation:
[ Risk = \sum_{i=1}^{n} w_i \cdot x_i ]
where ( w_i ) represents the importance of each factor and ( x_i ) represents normalized indicators like environmental vulnerability and demographic exposure.
We also integrated an AI-powered assistant to answer user questions about disaster preparedness and mitigation, making the platform more informative and practical.
Challenges we ran into
One major challenge was handling inconsistent or missing values in the dataset across different disaster categories. Another difficulty was integrating Folium maps smoothly inside Streamlit without breaking layout or performance. Managing Streamlit session state for dynamic interactions like disaster selection and chatbot context also required multiple iterations and debugging.
Accomplishments that we're proud of
We successfully built a fully interactive dashboard that combines data analysis, geospatial visualization, and AI assistance in one platform. The risk scoring system works across multiple disaster types, and the interface is clean, responsive, and user-friendly.
What we learned
We learned how to build end-to-end data-driven applications, integrate mapping tools into web apps, manage application state in Streamlit, and design meaningful risk models from real-world indicators. We also gained experience in combining AI with practical dashboards.
What's next for Risk Radar
Next, we plan to integrate real-time disaster APIs, improve prediction accuracy using machine learning models, add location-based alert systems, and expand the platform into a global early-warning and preparedness system.

Log in or sign up for Devpost to join the conversation.