Inspiration
Insurance is inherently reactive. A pipe bursts, a fire starts, a storm hits—and only then does the policy matter. By that point, homeowners are left navigating documents they barely understood when they signed them.
We wanted to challenge that model. What if risk wasn’t something you discovered after a loss, but something you could clearly understand—and act on—before it happens?
Homeowners already have the data: inspection reports, claims history, and basic property details. The problem isn’t access—it’s interpretation. Risk Radar was built to bridge that gap, transforming scattered, hard-to-interpret information into something actionable. Our goal was simple: shift insurance from a passive safety net into an active risk prevention system.
What It Does
Risk Radar is a personalized home risk assessment and prevention platform.
Users:
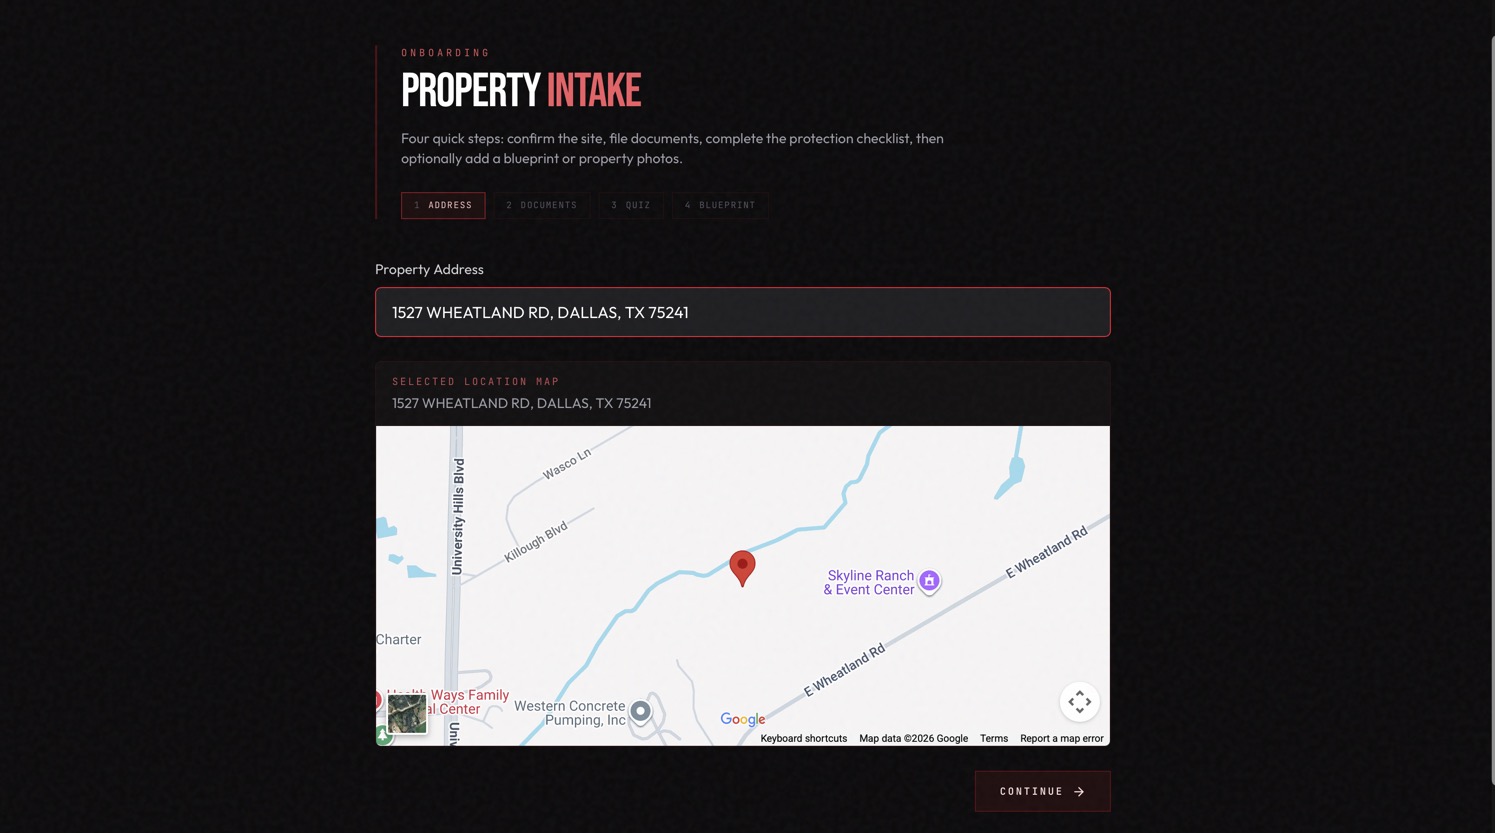
- Enter their address
- Upload home inspection reports and past claims documents
- Complete a short, structured quiz
From there, the platform generates a comprehensive, explainable risk profile with three key outputs:
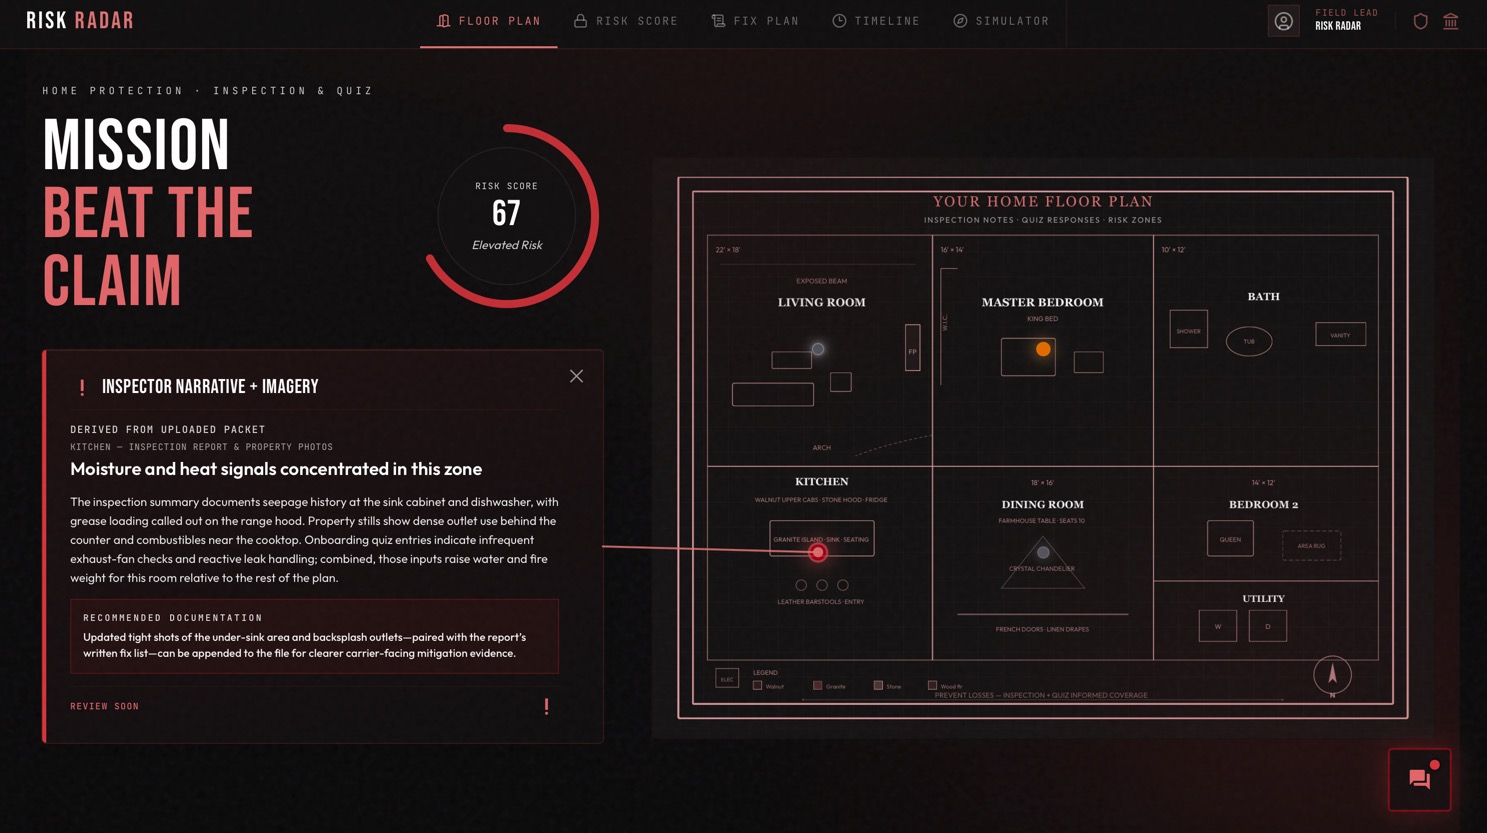
1. Transparent Risk Scoring
A single risk score backed by a clear, factor-by-factor breakdown. Users don’t just see their risk—they see exactly what’s driving it.
2. Prioritized, Actionable Recommendations
Instead of generic advice, users receive ranked actions tailored to their home, with clear impact on their score. This turns insight into immediate next steps.
3. Interactive Floor Plan Visualization (Core Innovation)
Risk is mapped spatially across the home.
- Kitchen → flagged for fire risk
- Bathroom → flagged for water damage
- Roof → highlighted for weather exposure
This transforms risk from an abstract number into something tangible and location-aware, making it significantly more intuitive and actionable.
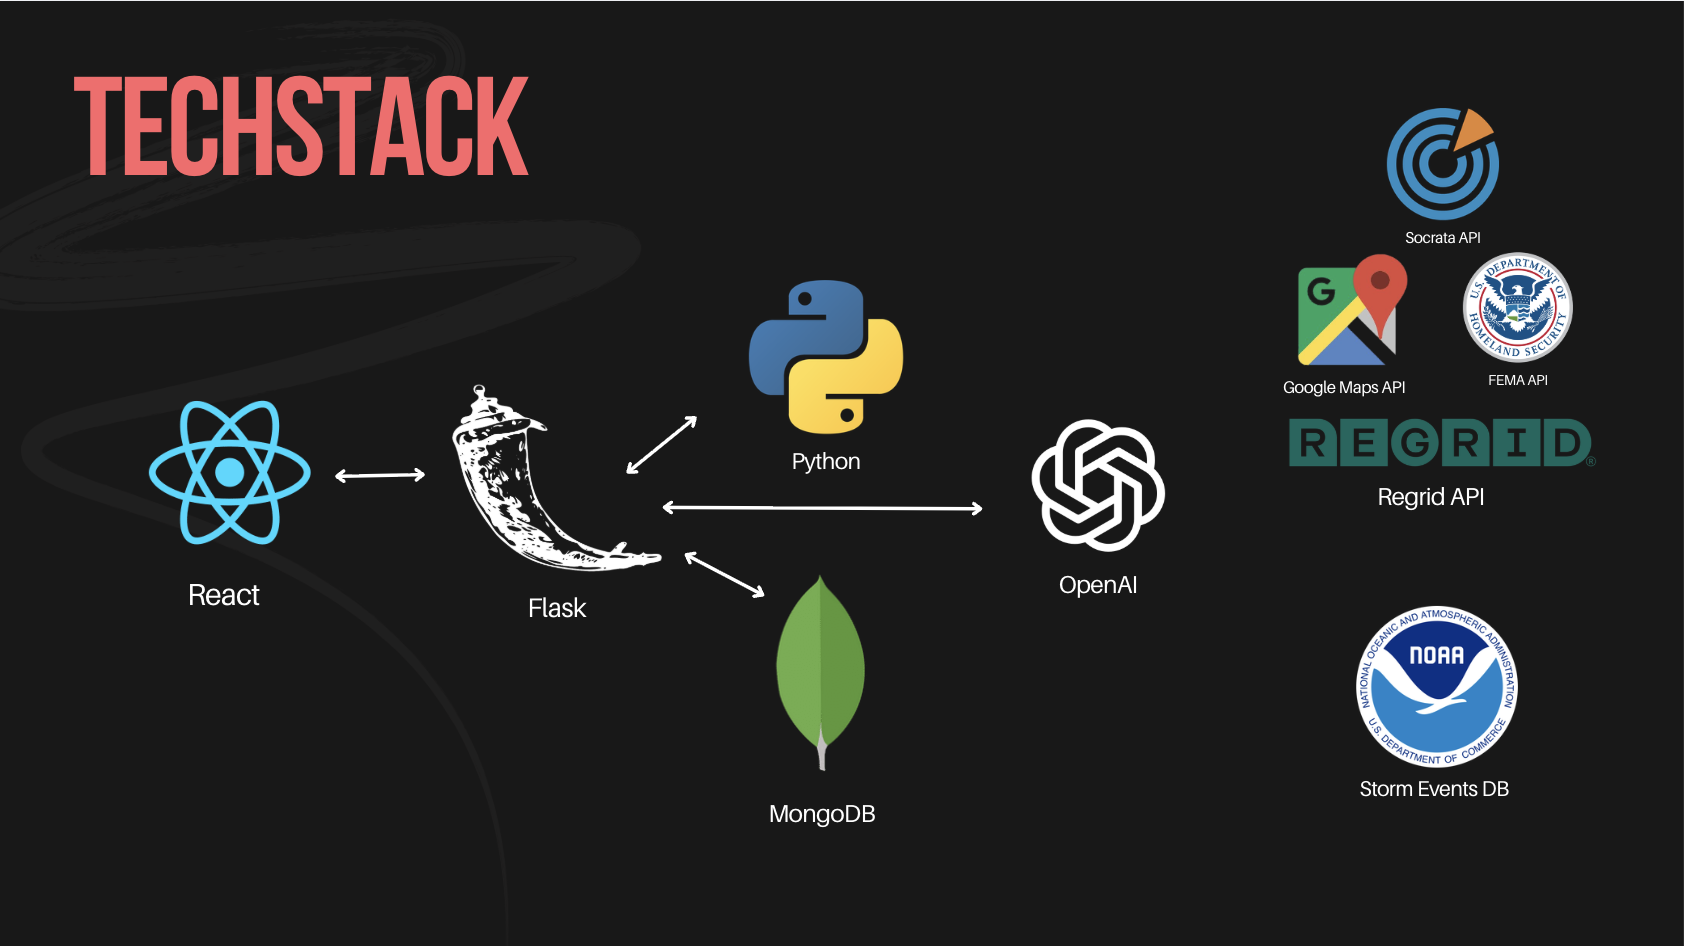
How We Built It
Risk Radar is built around a multi-input risk synthesis pipeline that combines:
- Unstructured data (inspection reports, claims documents)
- Structured inputs (user quiz responses)
- Contextual data (address-based property and environmental factors)
These inputs are normalized into a unified home risk profile, which feeds a rule-based scoring engine designed for:
- Interpretability
- Deterministic outputs
- Easy extensibility
The scoring engine identifies high-impact risk drivers and feeds a recommendation engine that prioritizes actions based on risk reduction potential.
Spatial Risk Mapping
The floor plan visualization layer maps risk outputs to a room-level model of the home. This required translating abstract risk signals into spatial representations, ensuring alignment between:
- Risk category (fire, water, etc.)
- Physical location (kitchen, roof, entry points)
The result is a UI that communicates risk visually, not just numerically.
Challenges We Ran Into
1. Data Synthesis Across Modalities
We had to unify:
- Unstructured text (documents)
- Structured inputs (quiz data)
- External context (location-based risk)
Designing a pipeline that produced outputs that felt coherent, explainable, and non-arbitrary required multiple iterations, especially in balancing signal weighting.
2. Signal vs Noise in Visualization
The floor plan introduced a UX challenge: too much information reduces clarity.
We had to carefully decide:
- What to surface visually
- What to keep in detailed breakdowns
The goal was to ensure the visualization enhanced understanding rather than overwhelming the user.
Accomplishments We’re Proud Of
We built a system that reframes how homeowners interact with risk:
- Not just a score, but a fully explainable model
- Not just insights, but prioritized actions
- Not just data, but spatial awareness
The interactive floor plan is a key achievement—it solves a real usability problem. Abstract risk rarely drives behavior change, but localized, visual risk does.
We’re also proud that Risk Radar leverages documents users already have, lowering friction and making the system immediately usable without requiring specialized inputs.
What We Learned
The biggest takeaway: explainability is non-negotiable.
A risk score without context lacks credibility. Once we introduced factor-level transparency, the system became significantly more trustworthy and useful.
We also learned that visual context changes behavior. Mapping risk to physical space makes it more concrete, which increases the likelihood that users will act on recommendations.
What’s Next for Risk Radar
We see Risk Radar evolving into a continuous, proactive risk management platform.
Next steps include:
- Real-time weather and seasonal hazard alerts tied to user location
- A maintenance timeline to track past updates and predict future risks
- Progress tracking to show how user actions improve their risk score over time
- Engagement features like streaks, goals, and safety milestones
Long term, our vision is for Risk Radar to act as the preventative layer between homeowners and insurers—reducing claims before they happen and shifting the insurance experience from reactive to proactive.
Built With
- fema
- flask
- google-maps
- javascript
- mongodb
- noaa
- openai
- python
- react
- regrid


Log in or sign up for Devpost to join the conversation.