-
-
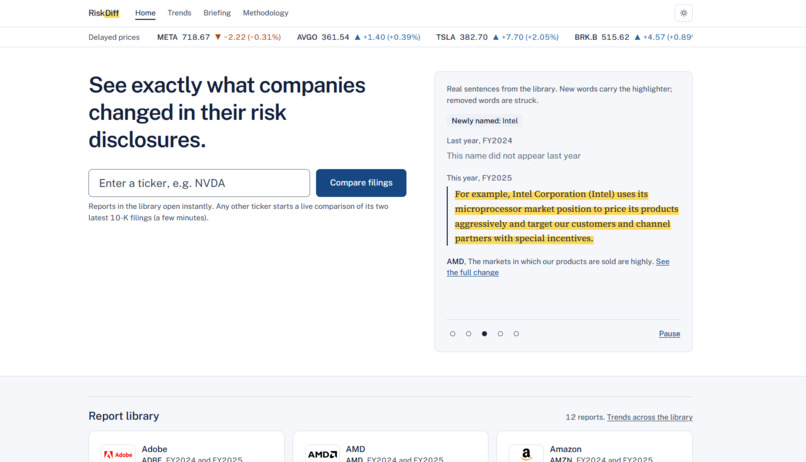
RiskDiff Home Page
-
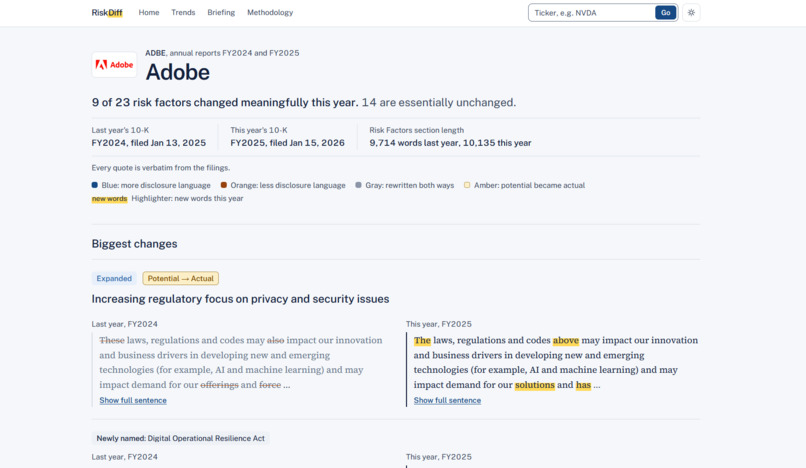
RiskDiff Analysis of Adobe's most recent 10k fillings
-
-
-
Inspiration
We were challenged with building something useful for financial services. Every public company files a 10-K, an annual report required by the SEC that runs hundreds of pages, and the changes that matter are easy to miss. The Risk Factors section is where a company has to tell investors what could go wrong, but most of it is copied over from the year before. Analysts who want to know what changed often paste two years of text into a diff tool and read it line by line, which is slow and easy to get wrong.
We also saw that AI summarizers struggle with trust in finance, because a summary is hard to rely on if you can't see where it came from. We wanted to solve both problems, for the analysts covering these companies and for the risk teams who need proof of what was reviewed.
What it does
The idea
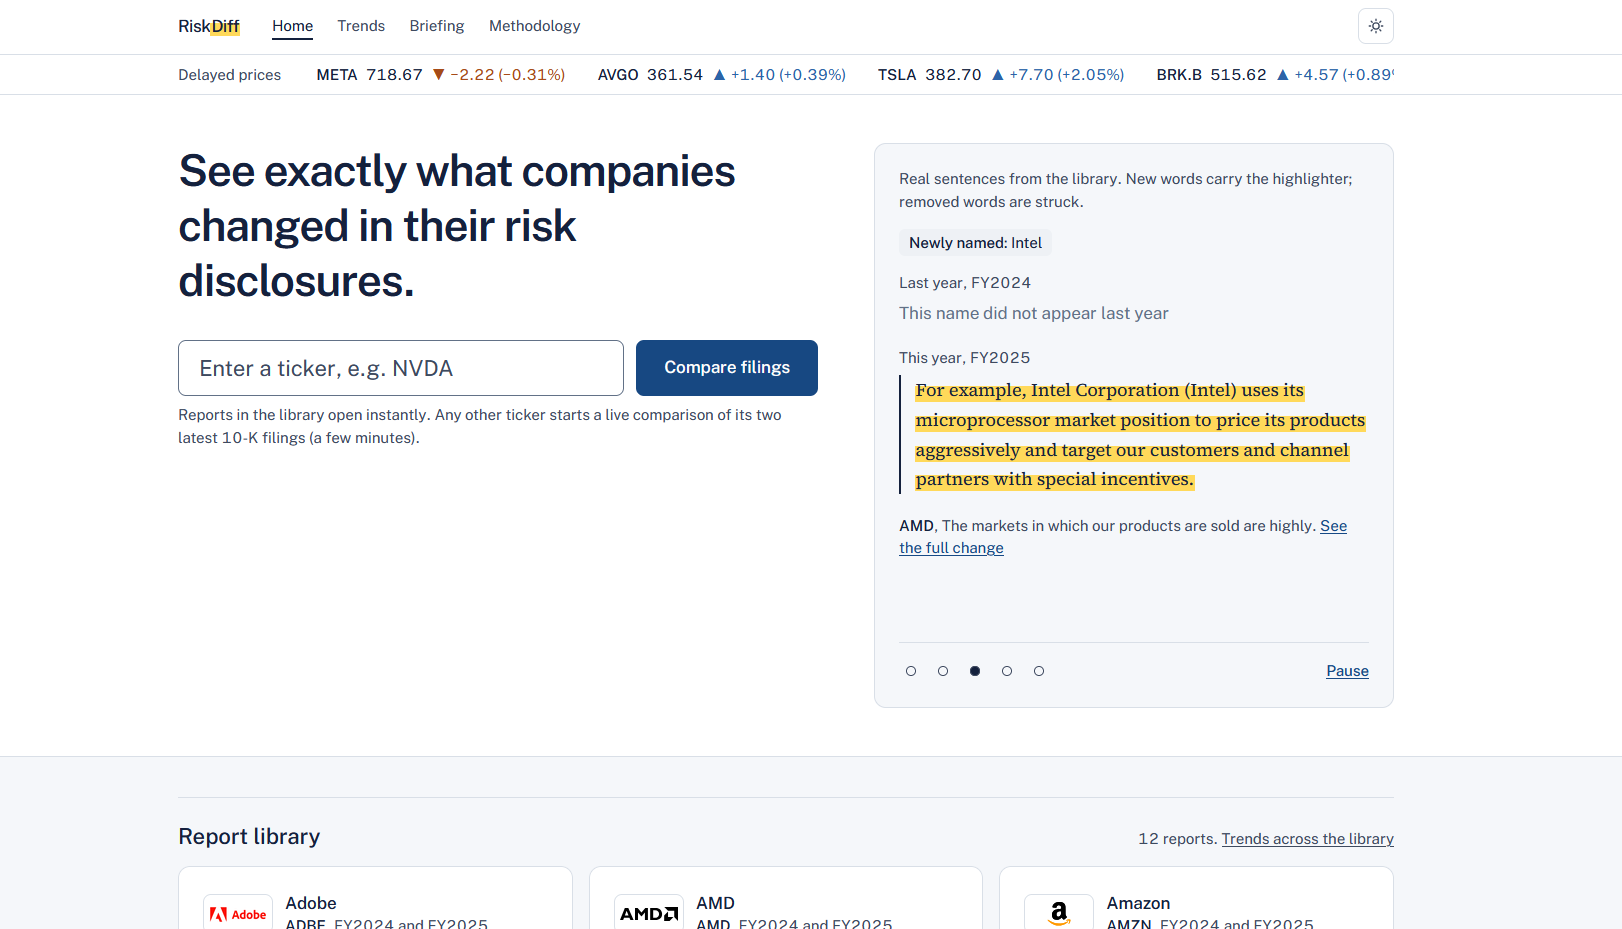
RiskDiff takes a company's two most recent 10-Ks, compares the Risk Factors sections sentence by sentence, and shows you exactly what changed.
Type in a ticker
RiskDiff pulls both filings straight from the SEC, finds the Risk Factors section, and splits it into individual risks. It then matches each risk to last year's version, even if it was reworded or moved, so wording that changed slightly but means the same thing doesn't show up as a new risk. What changed is always decided by fixed rules in code, so the same two filings give the same result every time. AI only helps with the matching and with short summaries that are clearly labeled.
What it shows you
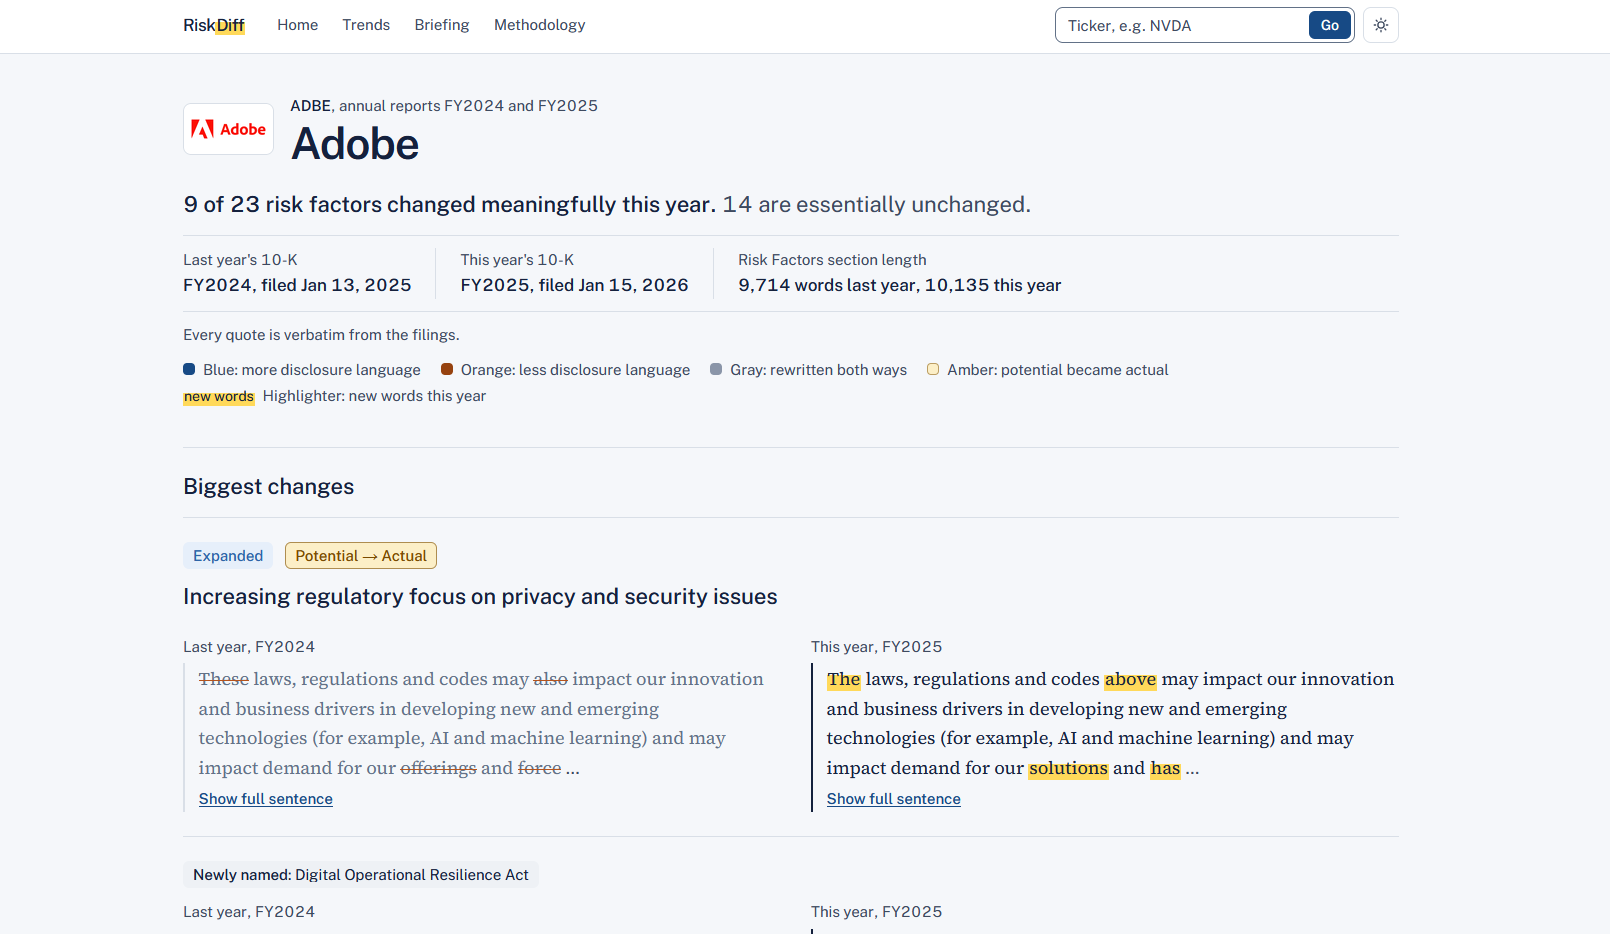
- A label for every risk factor: new risk, dropped risk, expanded, scaled back, major update, or essentially unchanged. For NVIDIA, 6 of 29 changed meaningfully, so you know which 23 you can skip.
- Potential to Actual: our favorite part. It flags a risk described as something that could happen last year that is described as something that did happen this year.
- New figures and new names: like the $4.5 billion charge NVIDIA disclosed this year that wasn't in last year's filing.
- An easy way to read it: new words are highlighted and removed words are crossed out, side by side or inline.
- Proof: every quote is word for word, and a link opens the SEC filing with that exact sentence highlighted.
Trends
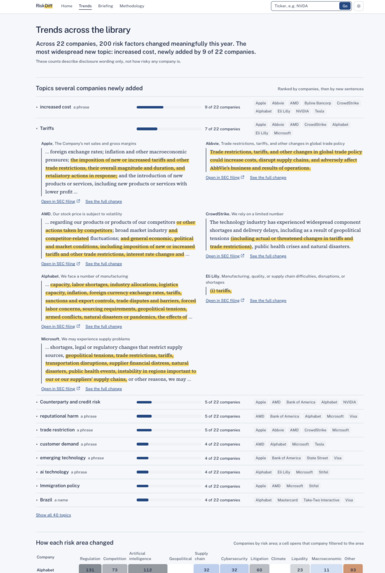
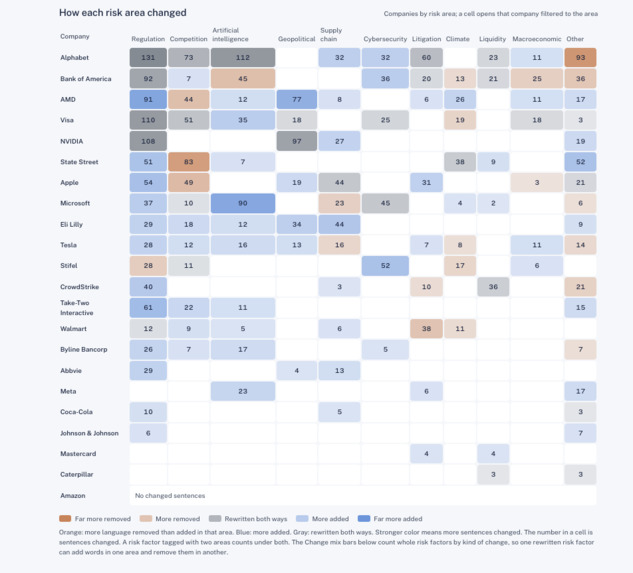
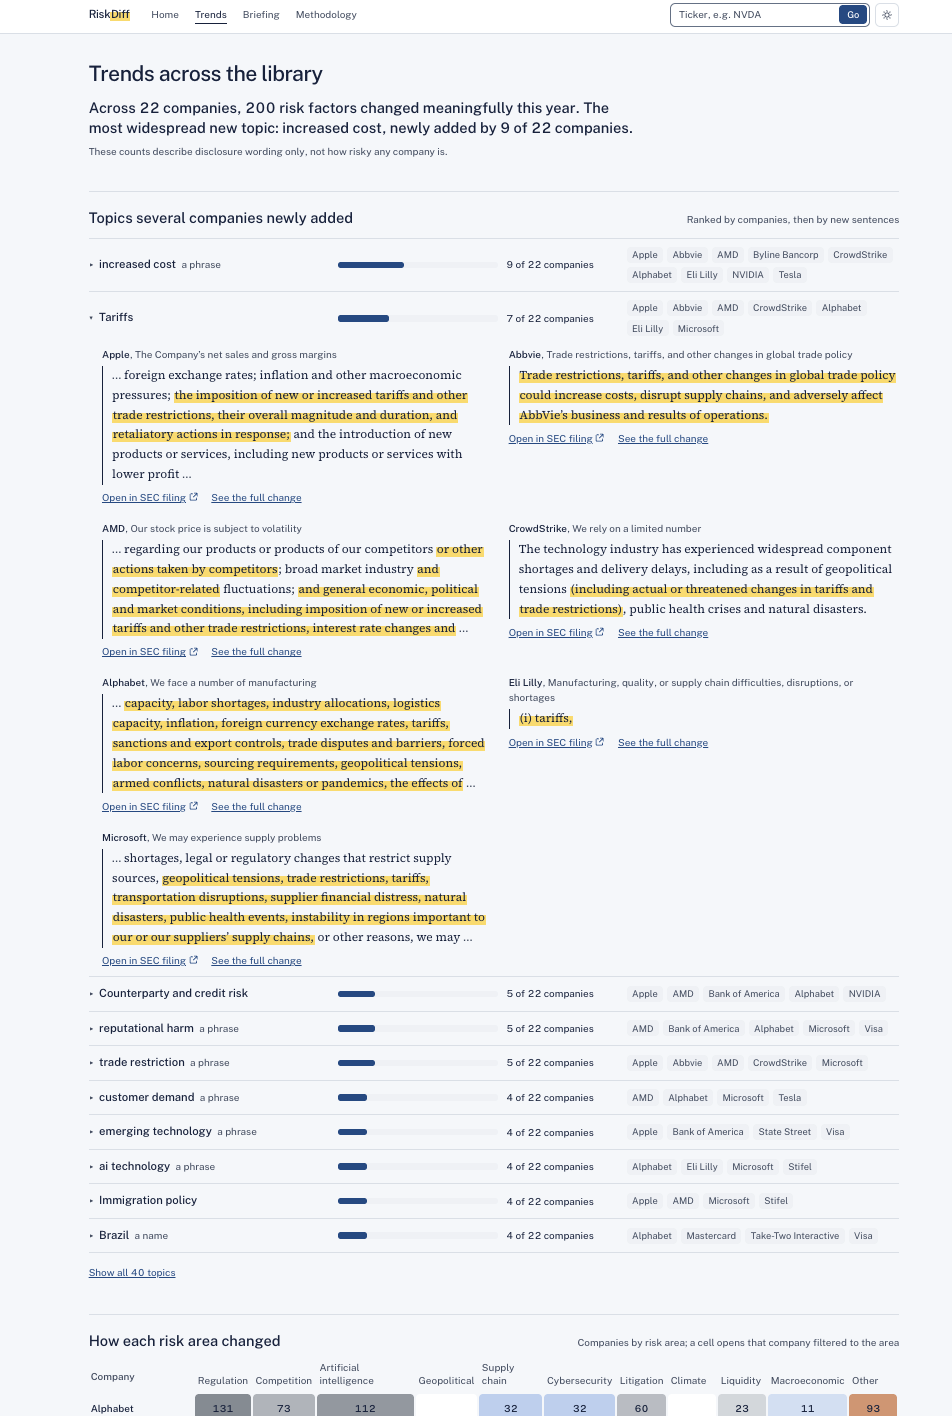
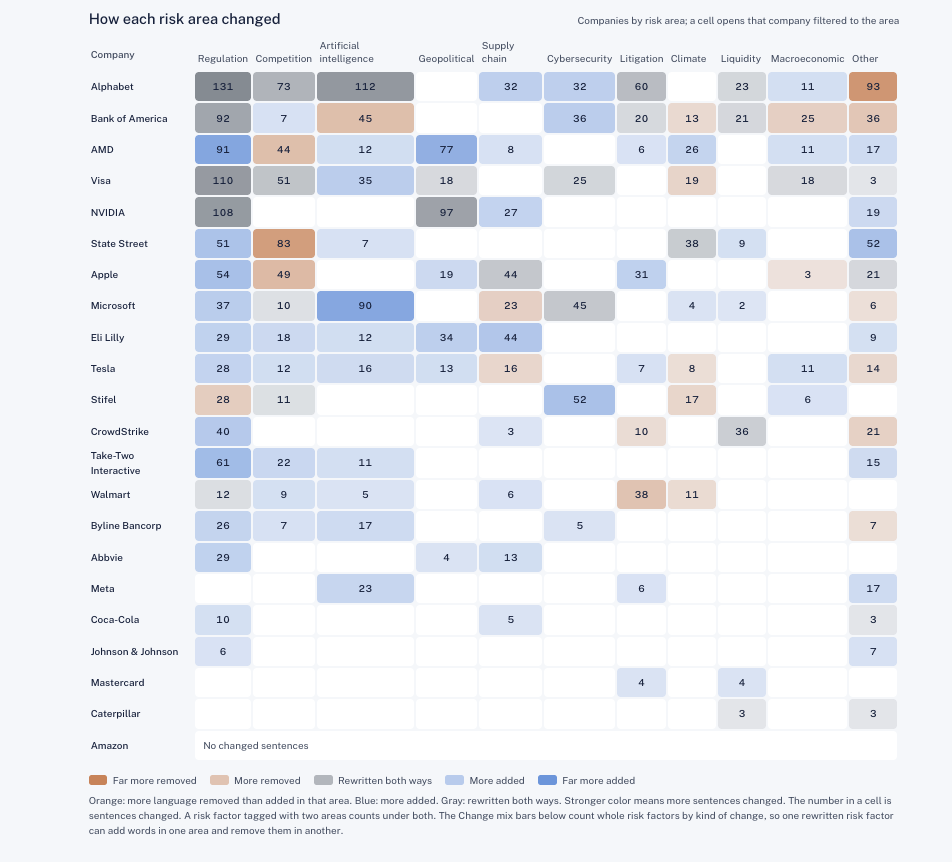
The Trends page looks across every company in our library. It ranks the topics that the most companies newly added this year. Expanding a topic shows the exact sentence from each company, and a heat map below shows how many sentences changed for each company in each risk area.
Briefing
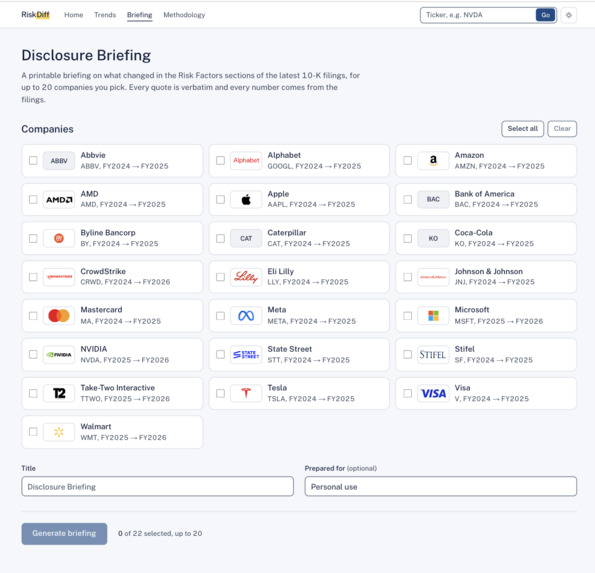
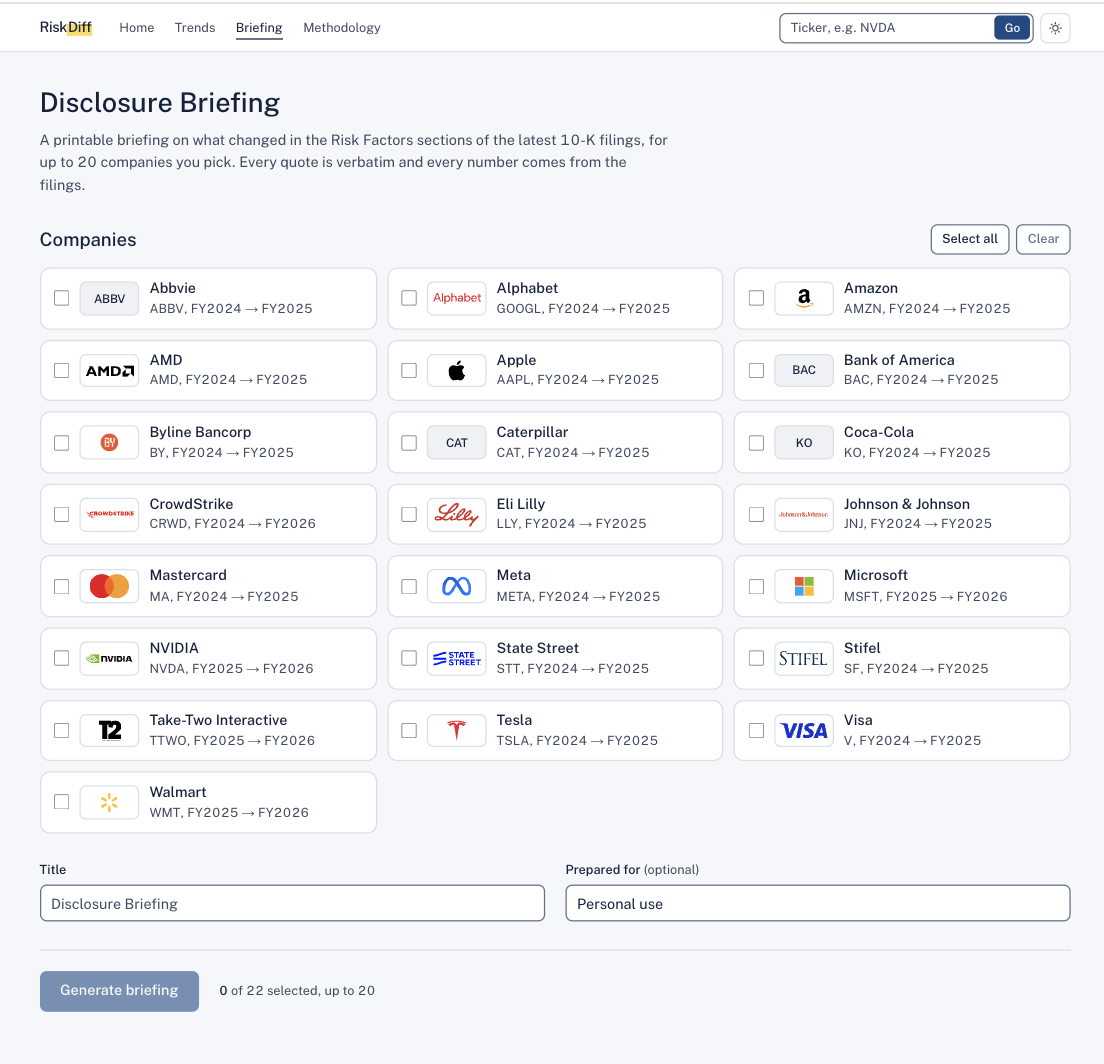
Seeing the changes is useful, but someone still has to turn them into a report. On the Briefing page you pick up to 20 companies and RiskDiff builds a 4-page Disclosure Briefing you can download as a PDF, print, or share by link. It has a one-page summary of what to read first, the themes across your list, what became actual along with new figures and new and dropped risks, and an audit trail of the filings used. A credit analyst can use it for the annual review of a borrower, and a risk team can keep it as a record that the review happened.
How we built it
We started with several ideas and kept refining them until we landed on one the whole team understood before any code was written.
The backend is a Python pipeline that runs in stages. It fetches the filings from SEC EDGAR, extracts the Risk Factors section, splits it into individual risks, and matches each risk to its counterpart from the prior year. It then compares them sentence by sentence and runs rule-based checks for new figures, new names, and potential-to-actual wording. The results are published as reports and served through a FastAPI backend to a Next.js frontend. A shared report library on Databricks keeps every teammate's laptop on the same set of reports.
Challenges we ran into
Pulling clean text out of real SEC filings was harder than we expected. The "Item 1A" heading appears twice in a filing, once in the table of contents and once in the real section, so we had to figure out which one was actually the Risk Factors.
We also had to be careful about how risks were matched, counted, and displayed so users would not be misled. Section headings were being counted as new risks, some before-and-after pairs didn't belong together, and the counts on different pages didn't always agree. Tracking these down meant auditing our own data against the filings.
Our first frontend was also hard to read for anyone who wasn't technical. We redesigned it around plain-English labels and a color system that only shows direction (more language or less language), never "good" or "bad."
Accomplishments that we're proud of
Running RiskDiff on real filings and watching it surface real changes was really cool, like NVIDIA's $4.5 billion charge showing up as a figure that wasn't in last year's filing. We're also proud that every quote in the app and in the briefing can be traced back to the filing, and of how we scoped the project. We chose to do the year-over-year comparison well instead of trying to rate or rank stocks by risk.
What we learned
Partway through, we found quotes in our own app that didn't match their source. Fixing that taught us that a tool for finance is only useful if every claim can be checked, and it shaped the rest of our decisions, from keeping quotes word for word to labeling anything written by AI. We also learned that explaining the project in plain English matters as much as building it.
What's next for RiskDiff
The next step is making the briefing fit more of the people who would use it. One idea is offering different export formats from the same data: a one-page summary for portfolio managers, the full briefing for analysts, and a single-company version for credit reviews. We would also like the briefing's links to jump to the exact sentence in the filing, the way the rest of the app already does, and to expand the library to more companies and more years so trends can be tracked over time.


Log in or sign up for Devpost to join the conversation.