-
-

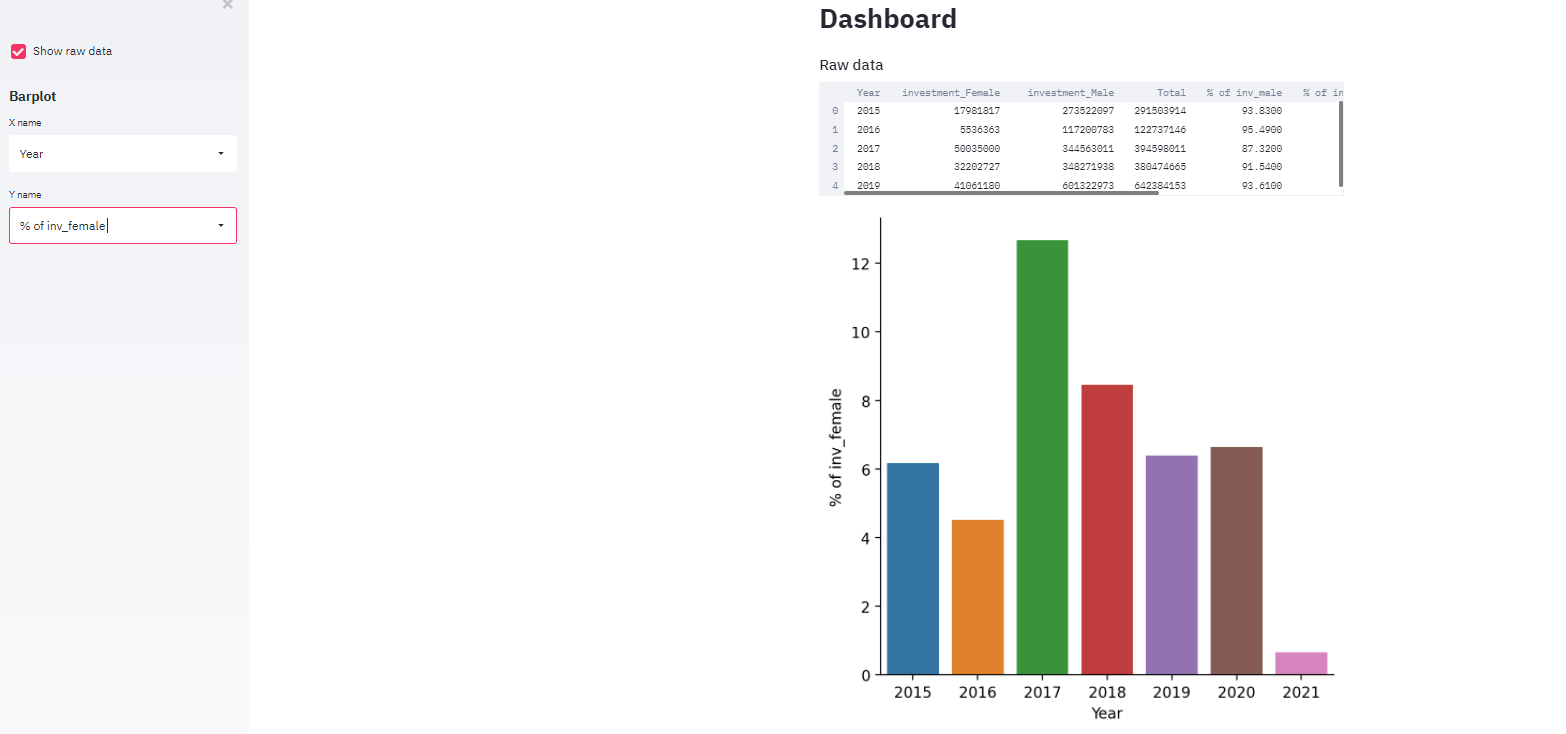
Interactive dashboard
-

Elena, Sandrine, Smita and Nynke
-

-


Inspiration
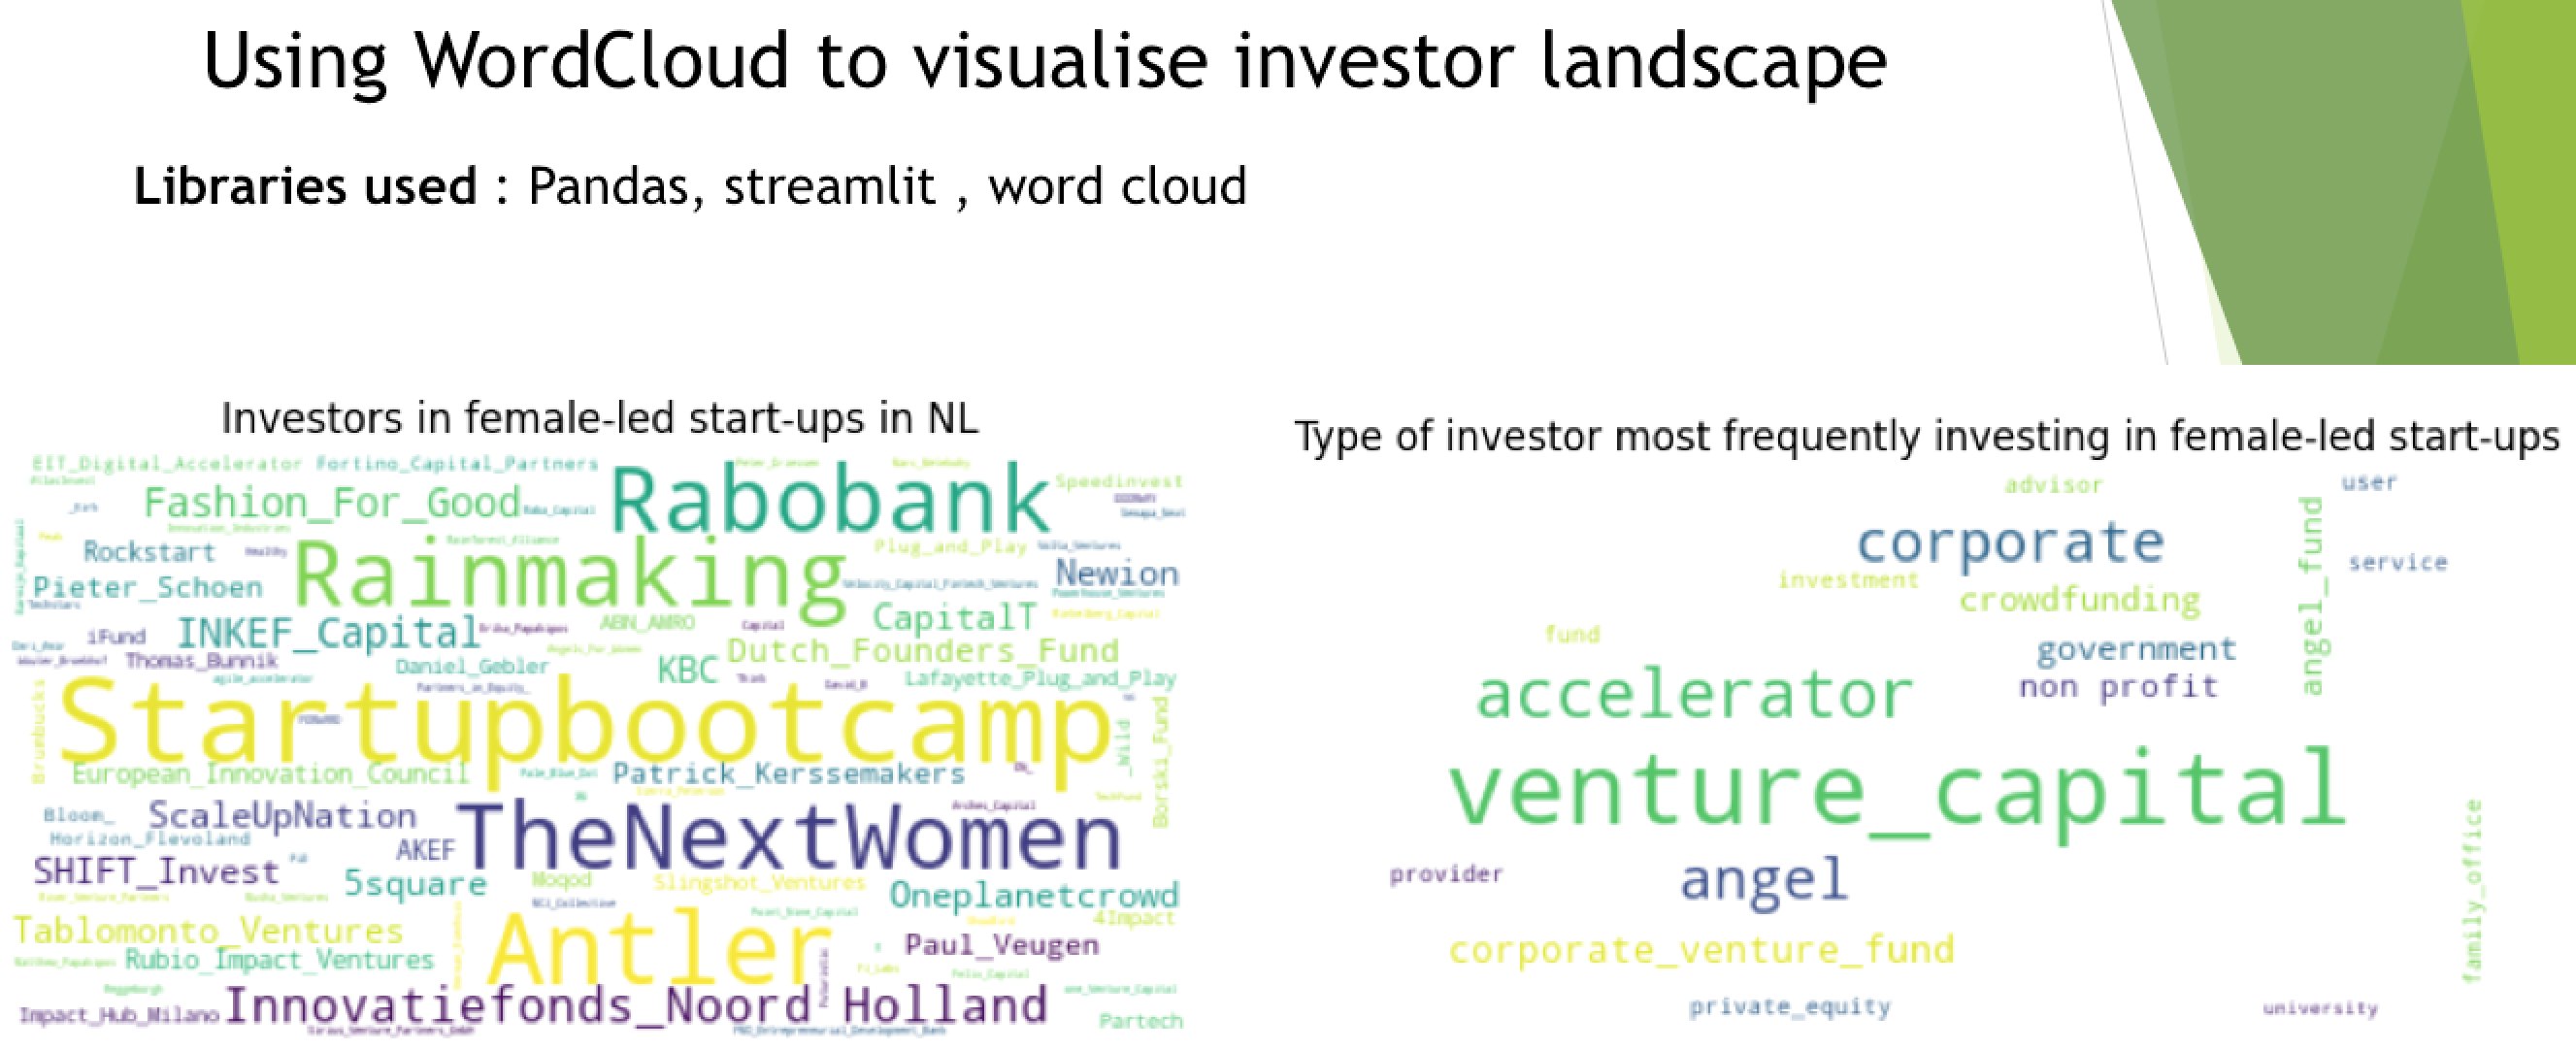
We took up this challenge to show the Women participation in tech and startups and to build the interactive Dashboard for RISE Amsterdam
What it does
It has interactive dashboard where you can select the parameters and it generates the required chart
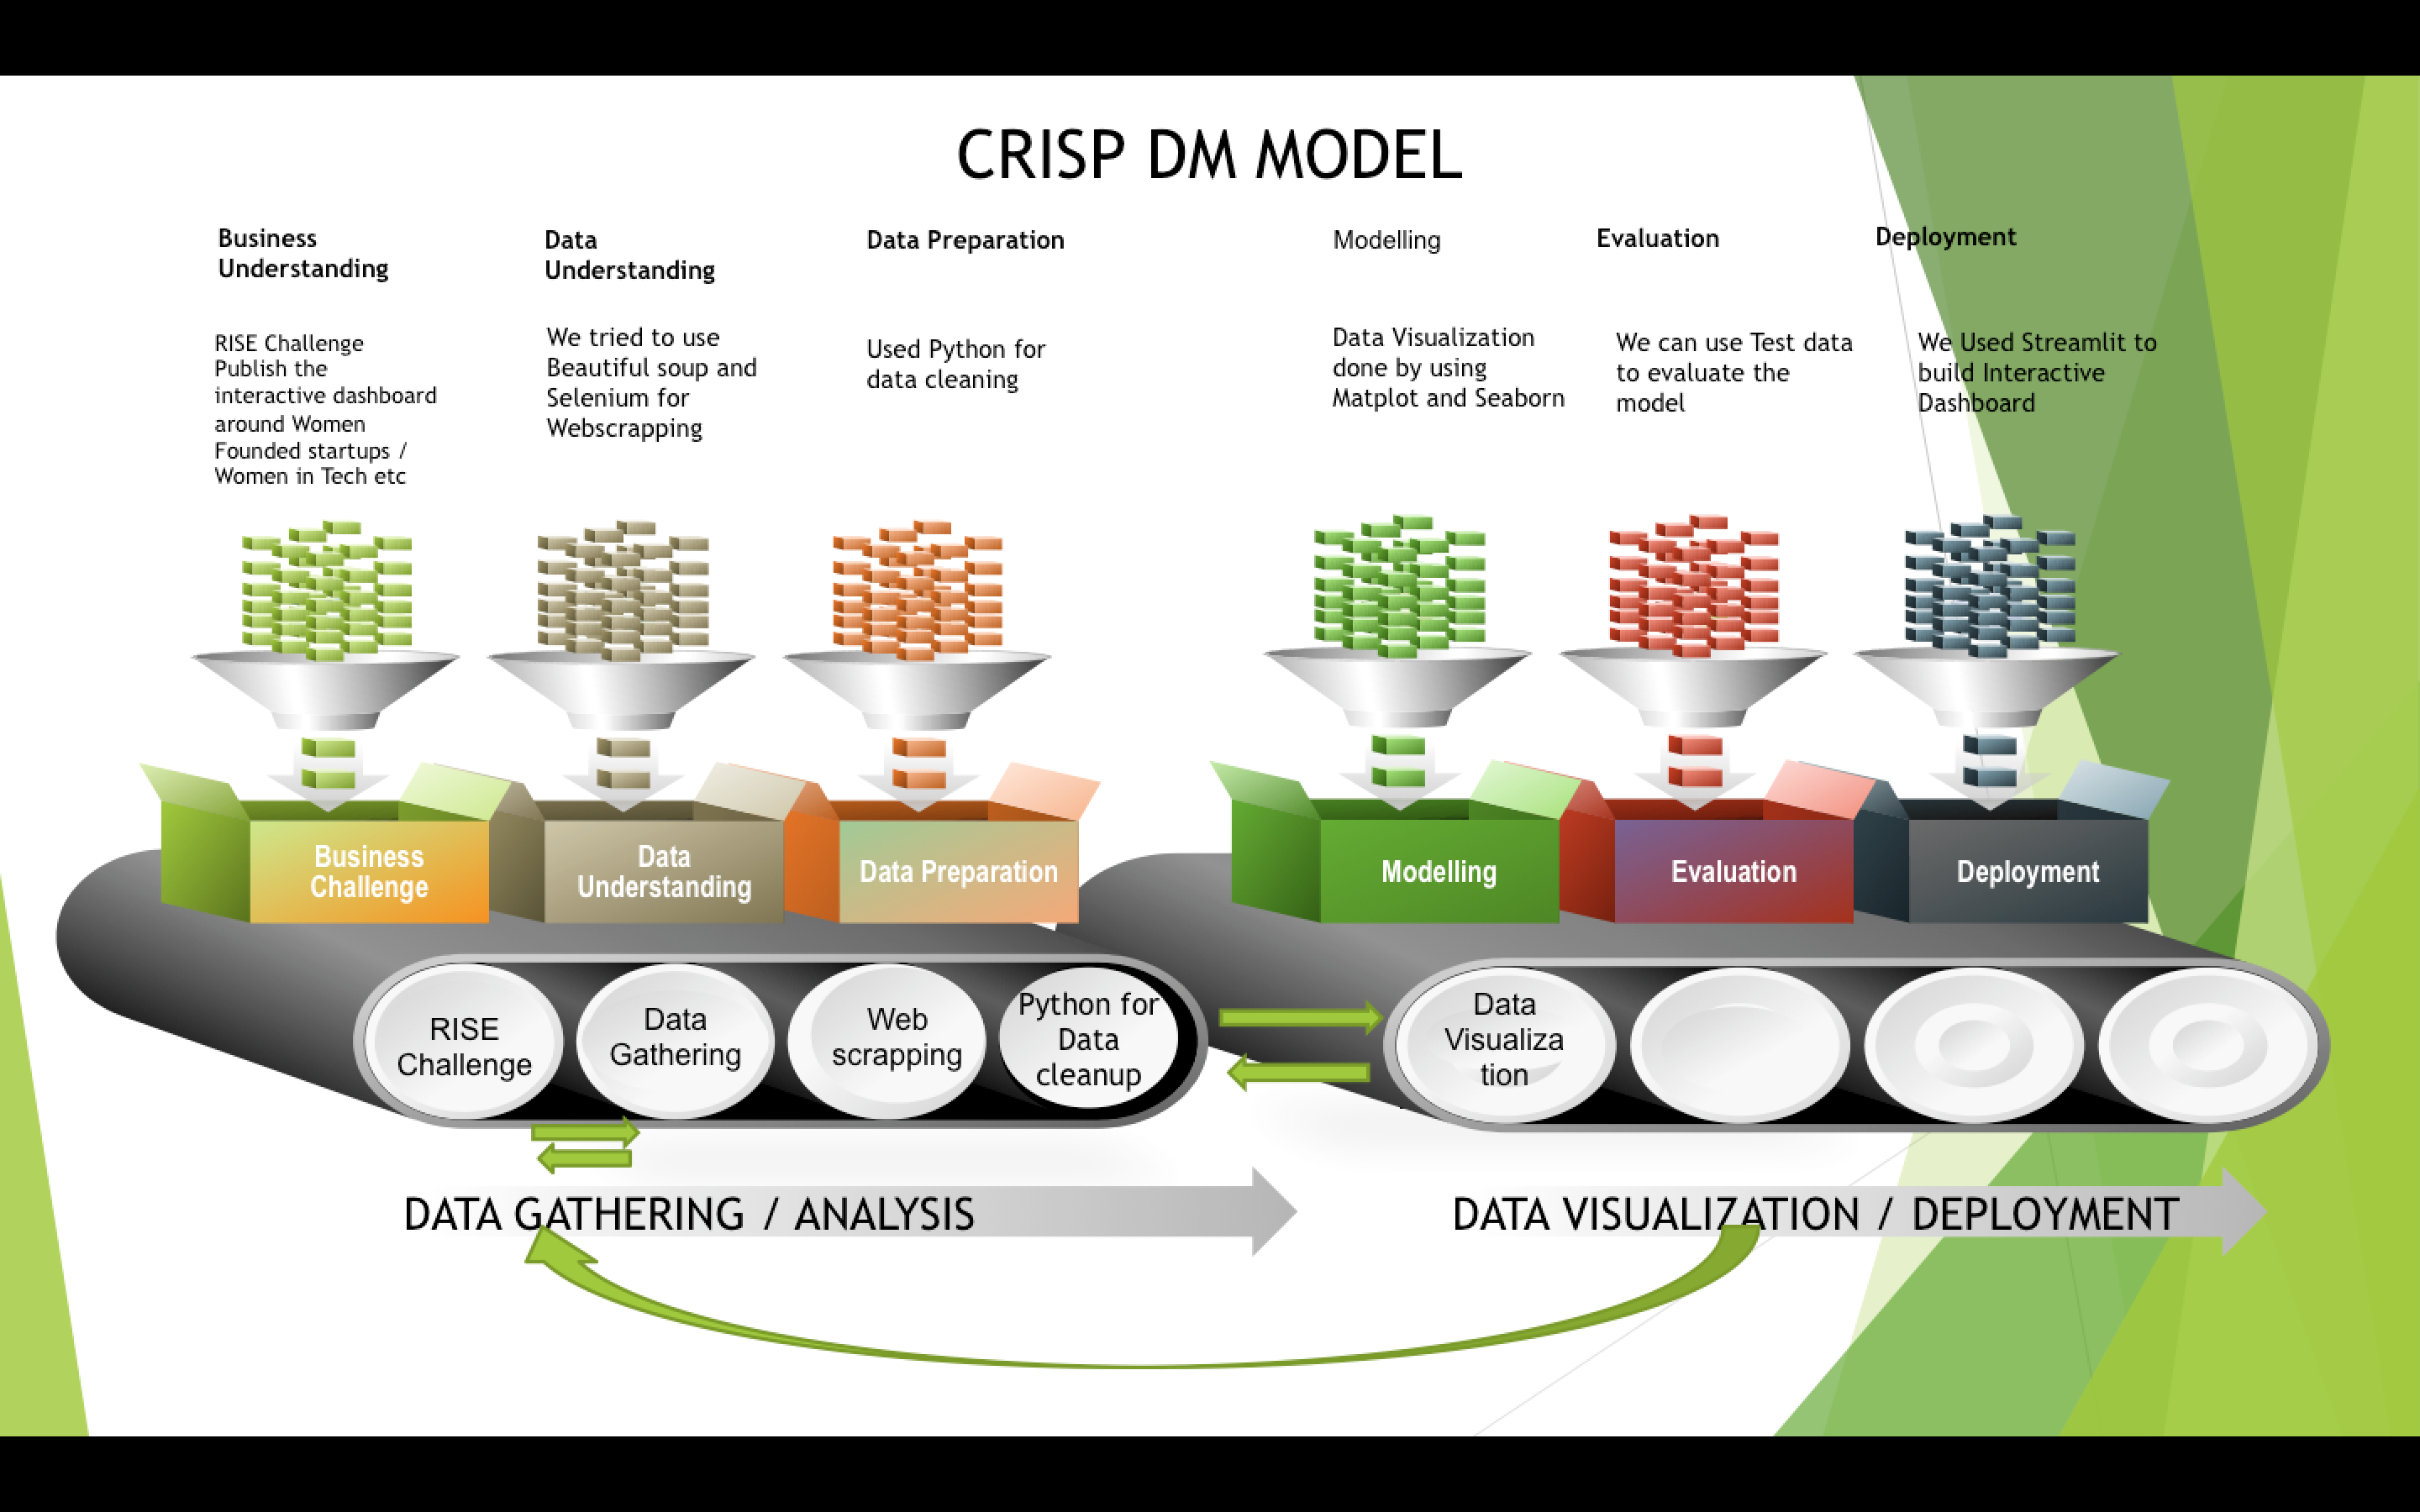
How we built it
We first did the Data preparation and clean up by using Python pandas and numpy library . We then aggregrated the data in one Data frame as data were in different format . We then build the graphs using matplot and Seaborne library . Finally we built the dashboard using Streamlit
Challenges we ran into
Data availablity was the biggest challenge . We referred different websites i.e Techleap , crunch base , Eurostat ,KvK etc . We were able to get very less amount of data . We tried to use Web scrapping using Beautiful soup but could not fetct the data more than 27 rows


Log in or sign up for Devpost to join the conversation.