Inspiration
In long-term care, small changes are the first warning signs: a bad night, a little new confusion, a resident who stops finishing lunch. But they get lost. Each nurse sees only her own residents, notes sit in different places, and the people who notice change first, residents and families, have the weakest way to tell staff: a call bell or a hallway chat that never reaches the chart.
We kept coming back to one question: what if five "unrelated" sick days across three units are actually one outbreak? Existing tools can tell a facility that a cluster is forming. We wanted to help staff see why, and to catch the small individual changes before they ripple into big ones.
Small changes ripple. We catch them first.
What it does
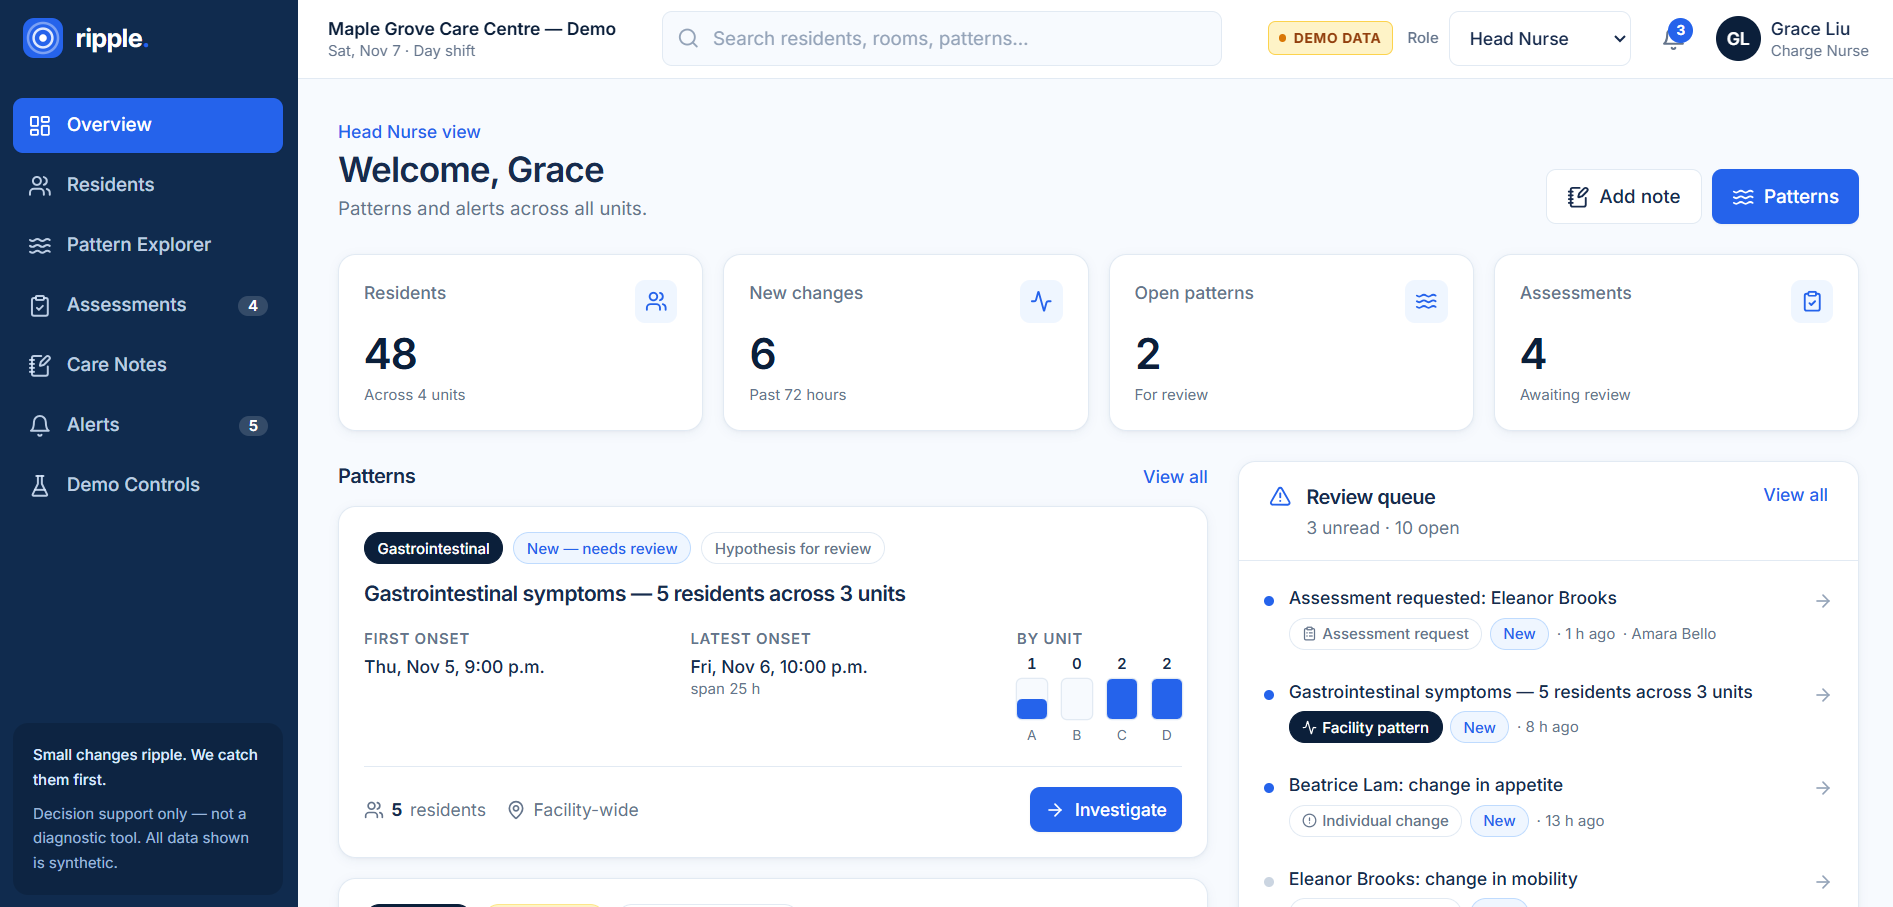
Ripple is an explainable decision-support tool for senior-care facilities. It pulls resident observations, clinical events, meals, activities and care notes together, then surfaces two kinds of insight:
- Individual changes: each resident is compared with their own baseline using transparent rules. For example, 2 or more documented cognition changes within 72 hours, or 2 of the last 3 meals below 50% intake.
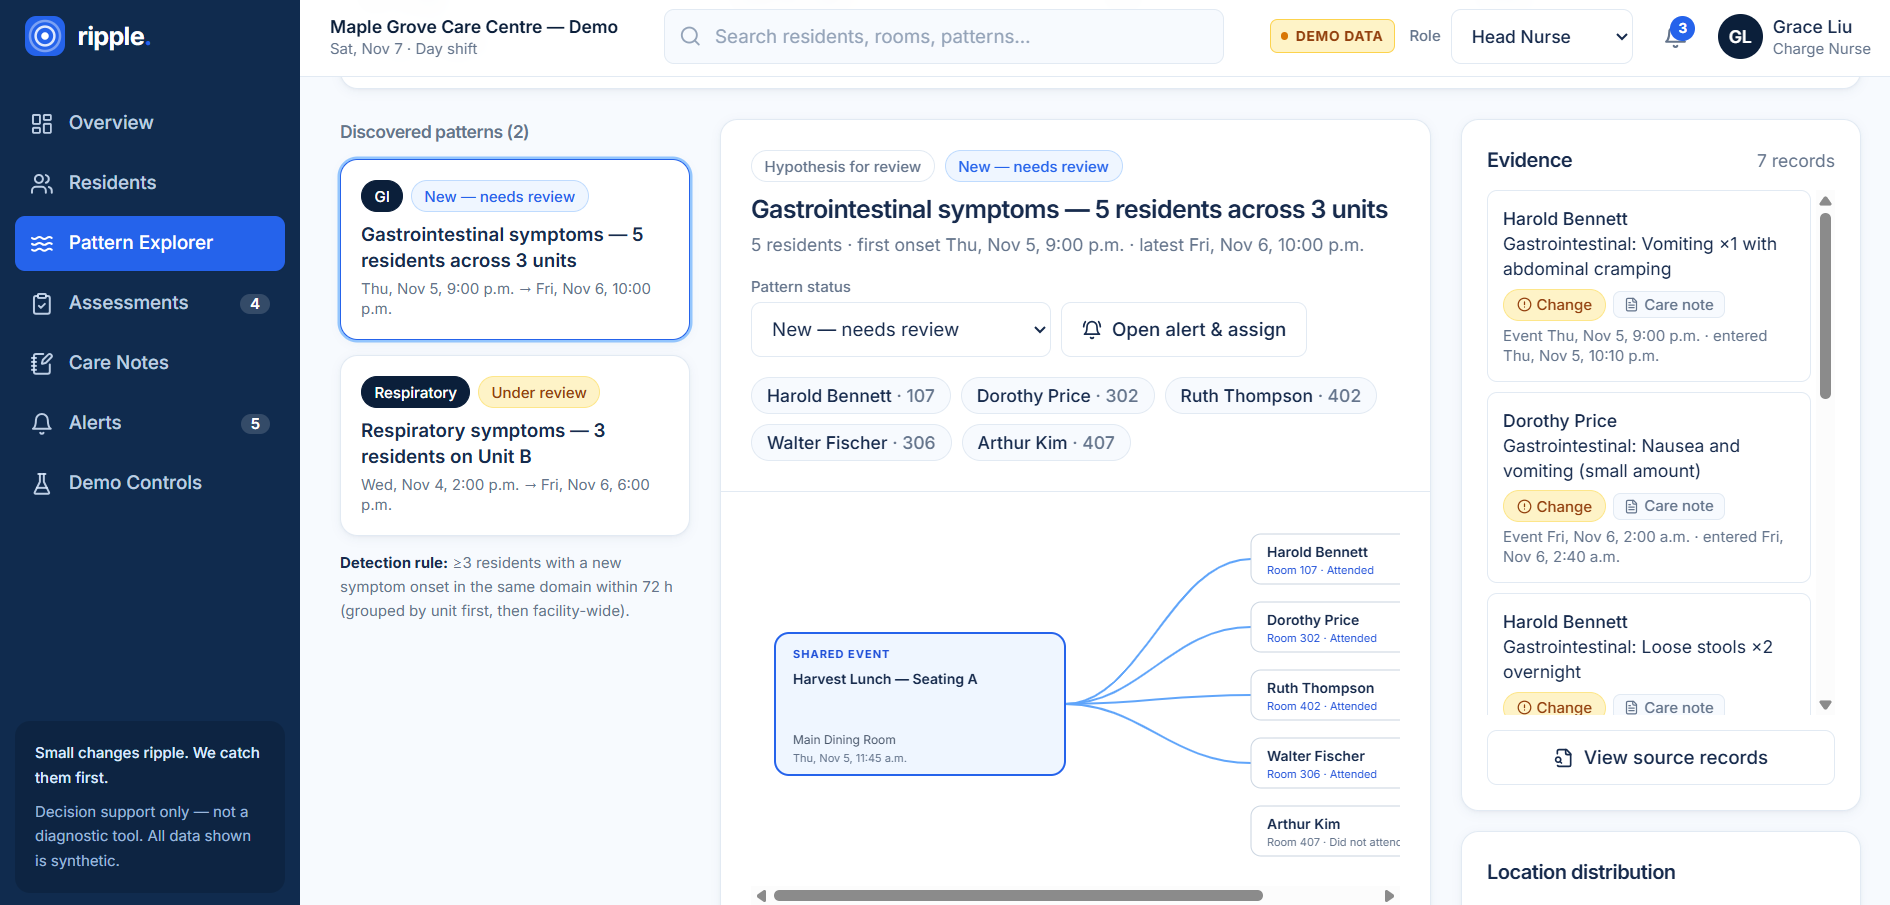
- Cross-resident patterns: new symptoms are grouped by domain, onset window and unit. When 3 or more residents have a new onset in the same domain within 72 hours, Ripple compares every shared exposure in the 72 hours before the first case.
In our GI-cluster demo, 4 of 20 residents who attended the Harvest Lunch (Seating A) became symptomatic, versus 1 of 26 who didn't:
$$\text{Rate ratio} = \frac{4/20}{1/26} = \frac{20\%}{3.8\%} \approx 5.2$$
Ripple shows the full 2×2 table and excludes residents with unknown attendance (reporting how many). It adds a small-numbers caveat and labels the result "Hypothesis for review, not a cause."
Two sides, one loop:
- Resident and family check-ins (
/checkin): a tablet-first page built for an 84-year-old. It asks one question per screen, with mood faces, a 0–10 pain scale, symptom chips, voice, typing or a photo, and Read to me text-to-speech. A live tracker shows Sent → Seen → Added to care record. - Staff inbox and dashboard: rule-based triage with every reason shown, the resident's own words, and a perspective gap flag when a self-report conflicts with a staff "at baseline" record. Draft observations go into the chart in one click. There is also a pattern explorer with timeline and relationship-graph views, alert assignment with an audit trail, and an AI-written shift handover.
How we built it
- Frontend: React + TypeScript, Vite, Tailwind CSS, Zustand for state, Recharts for charts, and the browser Speech APIs for dictation and read-aloud.
- Analytics: a deterministic rules engine (
analytics.ts) for individual-change flags, triage, perspective gaps, cluster detection and exposure comparison. Every observation keeps its event time separate from its entry time, along with source, status and reviewer. - AI: Claude (Opus 5.5) runs through a server-side Vite middleware, so the API key never reaches the browser. It uses structured JSON outputs and a server-side refusal fallback. Claude turns free-text care notes into structured observations, enriches check-ins (summary, photo description, suggested triage) and drafts the shift handover. Without a key, everything still runs on the rules.
- Data: a deterministic synthetic dataset of 48 residents, with scripted demo scenarios and a one-click reset.
- Testing: 18 unit tests cover the rules and the full patient → nurse → chart loop.
Challenges we ran into
- Choosing the problem. We explored medication gaps for women, ER triage recording and gait tracking before settling on facility-wide pattern detection. Then we learned PointClickCare already offers cluster detection, so we re-scoped around explaining patterns and capturing earlier signals.
- Honest statistics with small numbers. In a 48-resident facility, one case can swing a percentage. We had to use full denominators, handle missing data (missing ≠ negative), and resist presenting correlations as causes.
- Putting AI in the right place. We wanted AI to help without becoming the decision-maker. Designing the safety rails, where AI can raise triage but never lower it and nothing reaches the chart without a nurse, took several iterations.
- Time. We had one day, plus workshops, so we cut scope aggressively and kept a working demo at every step.
Accomplishments that we're proud of
- A two-sided product: a resident or family member can check in by voice or photo, and a nurse sees triaged, chart-ready observations moments later.
- Explainability everywhere. Every flag shows its reasons, every exposure comparison shows its full 2×2 table, and every AI suggestion is labelled.
- Graceful fallbacks. The whole app works with no API key or internet, so the demo can't be broken by Wi-Fi.
- An accessible patient interface with 64 px buttons, one question per screen, read-aloud and family mode.
What we learned
- In healthcare, "how do you know?" matters as much as the answer. Transparent rules, visible evidence and honest caveats build more trust than a black-box score.
- The best use of AI here is reading messy human input (notes, voice, photos) and writing summaries, while deterministic rules own the thresholds and the flags.
- Missing data is information. A missing record must never be treated as "normal."
- Basic epidemiology (attack rates, rate ratios, denominators) is powerful, and also easy to misuse with small samples.
What's next for Ripple
- PointClickCare integration: read observations from the EHR and its Infection Prevention and Control module, and capture Vox Advantage voice notes as input.
- Dietary and kitchen data, so meal exposures come from real records.
- Multilingual input for residents, families and staff.
- A pilot on one unit, measuring how much earlier changes are caught and how much documentation time is saved.
