Inspiration
Prediction markets like Kalshi and Polymarket price real-world events in real time, from Fed decisions to tariffs, often before the news cycle catches up. We wanted to know how those markets compare with the stock market: where they agree, where they diverge, and which one moves first.
That raised a second question. An event rarely affects just one company. News about Nvidia also matters to TSMC, which makes its chips, and to the cloud companies that buy them. Those connections are public, but they're buried in hundreds of pages of SEC filings. We wanted one tool that shows a market move or news event and the companies connected to it, with the source for every link.
What it does
Ripple is a research workspace for comparing prediction markets with the stock market.
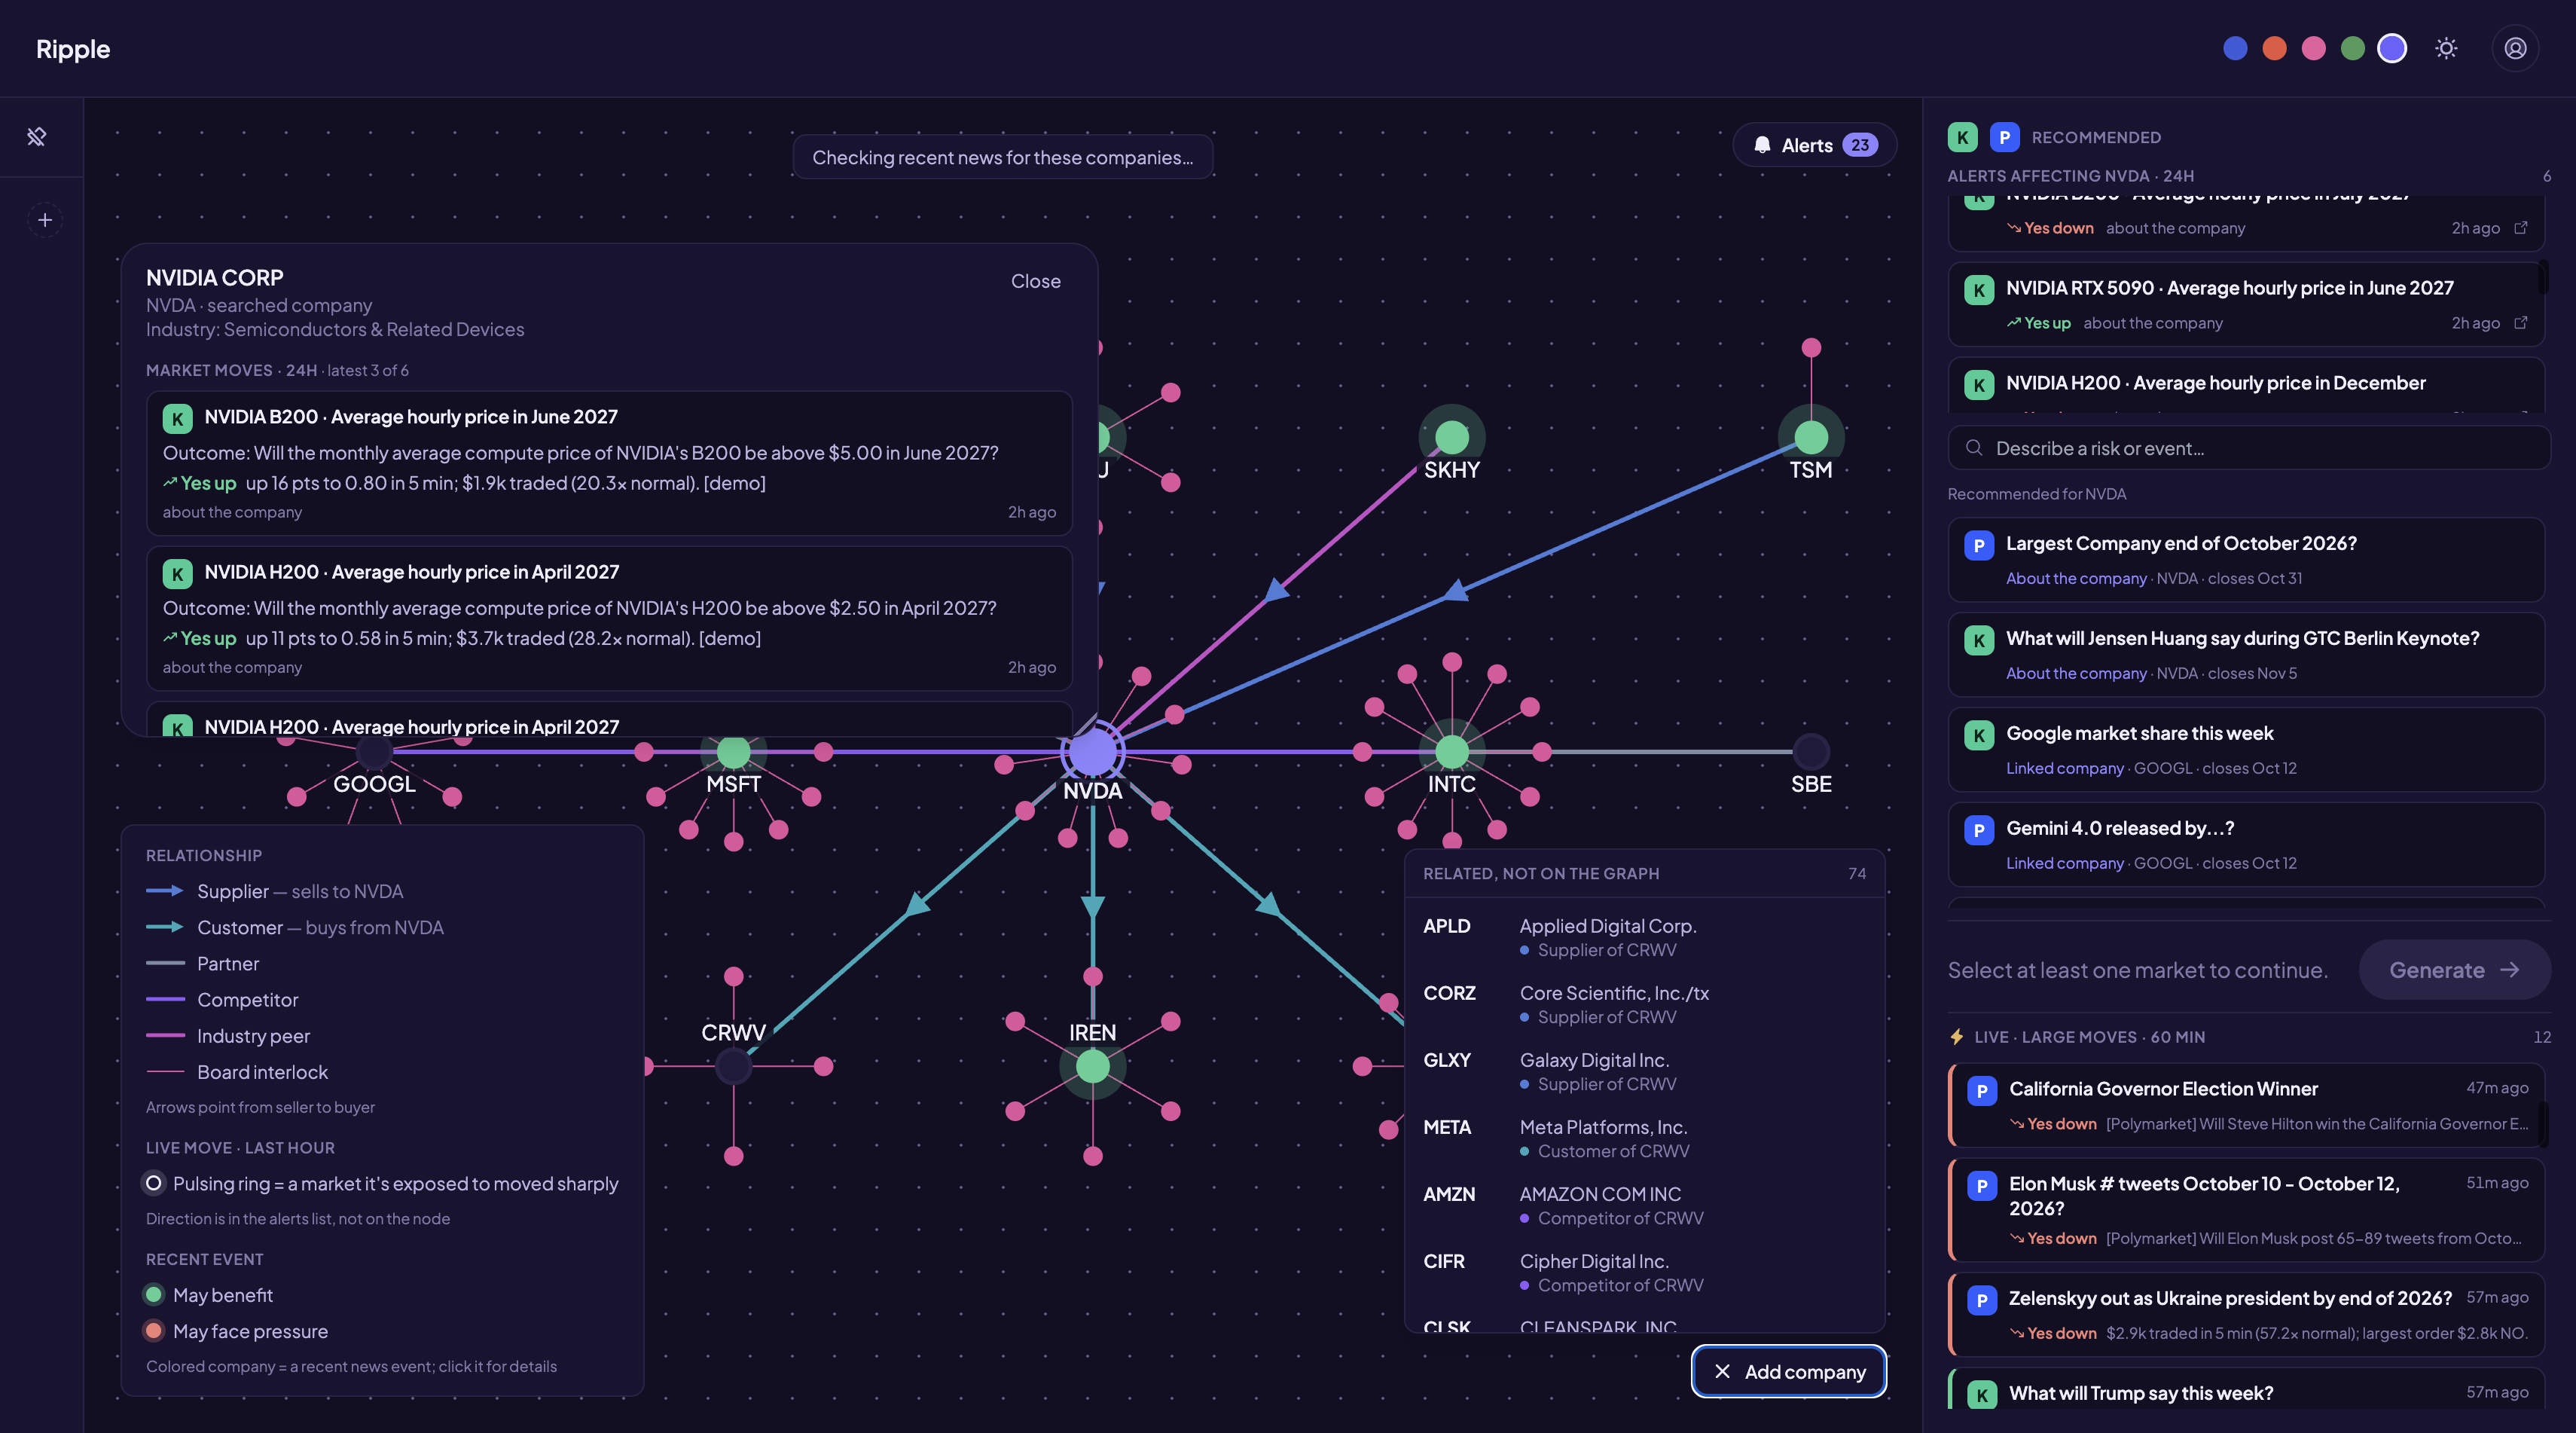
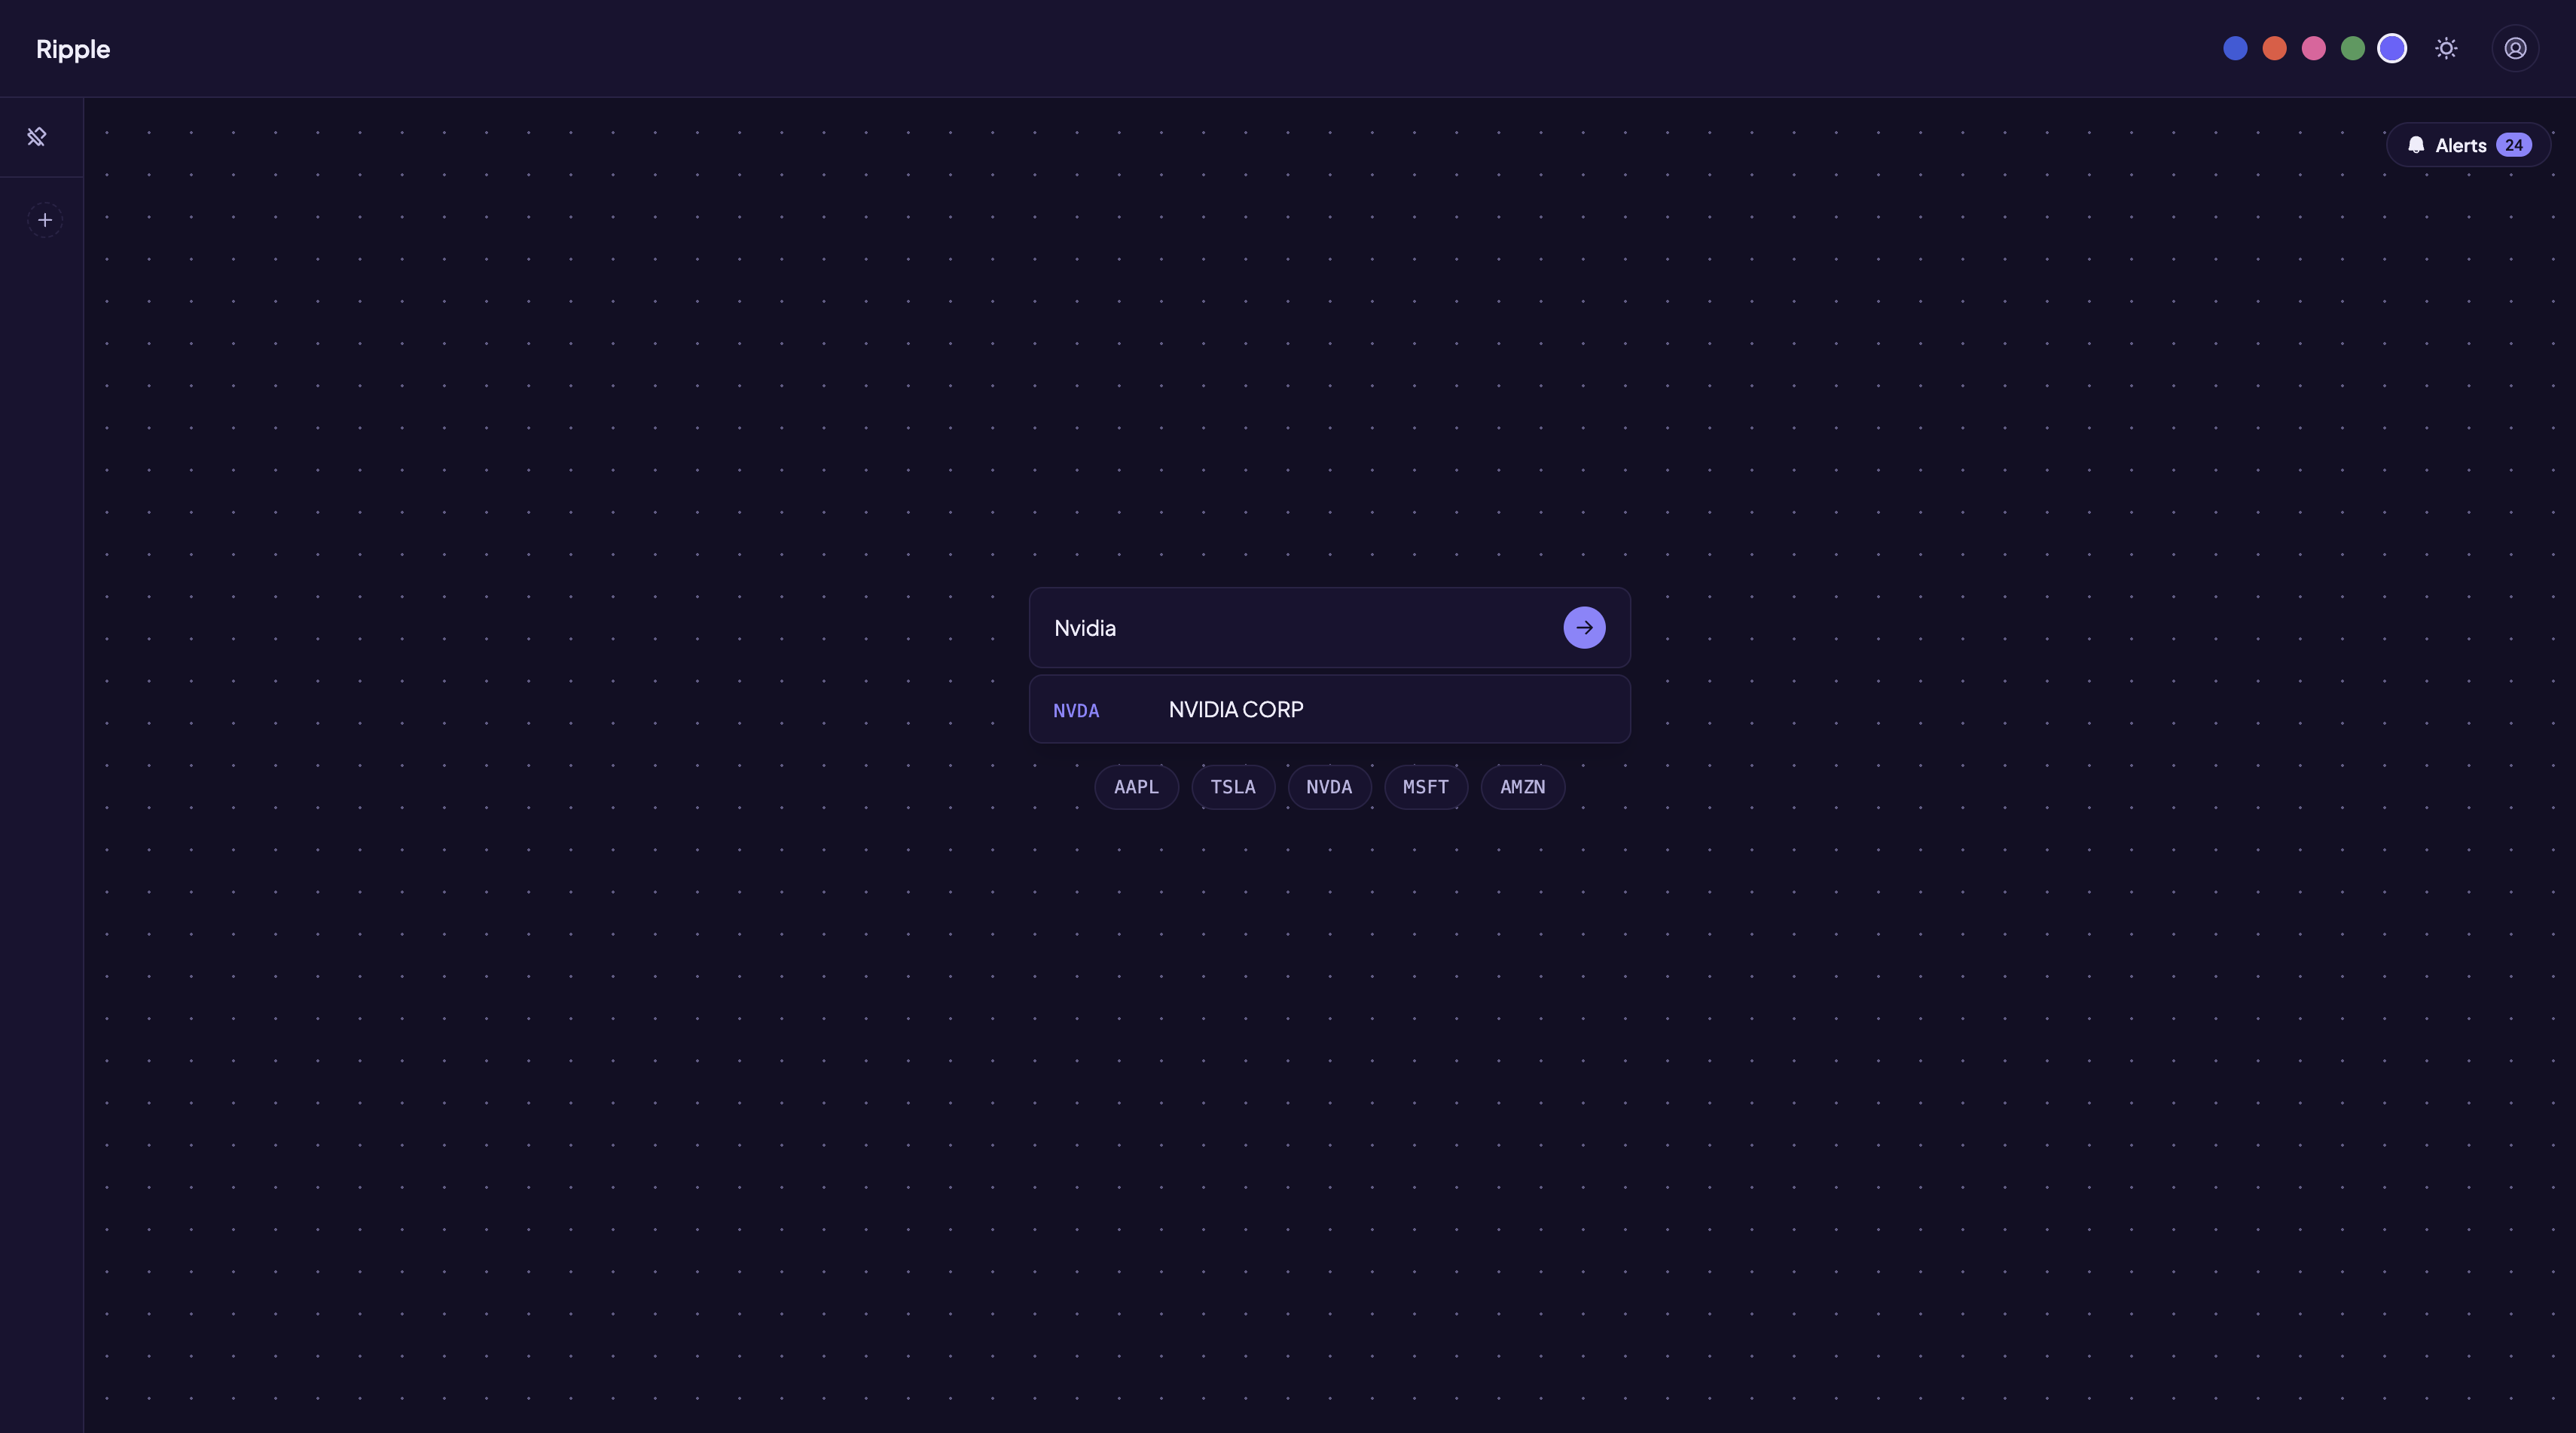
- Company graph. Type a company name or ticker and see the companies it does business with: suppliers, customers, partners, competitors, and industry peers. Every link opens the SEC filing it came from. An "Add company" picker lets you grow the graph one related company at a time.
- Board members. Each company shows its directors, pulled from SEC insider filings, so you can spot people who sit on two boards.
- Highlights. News and X posts from the last 7 days are matched to the graph. Linked companies light up as "may benefit" or "may face pressure", with a one-sentence reason and a source link.
- Live alerts. A detector watches Kalshi and Polymarket for real moves using four signals: price move, volume burst, whale order, and one-sided buying. When a market moves, the companies tied to it pulse on the graph and the alert appears in a live feed.
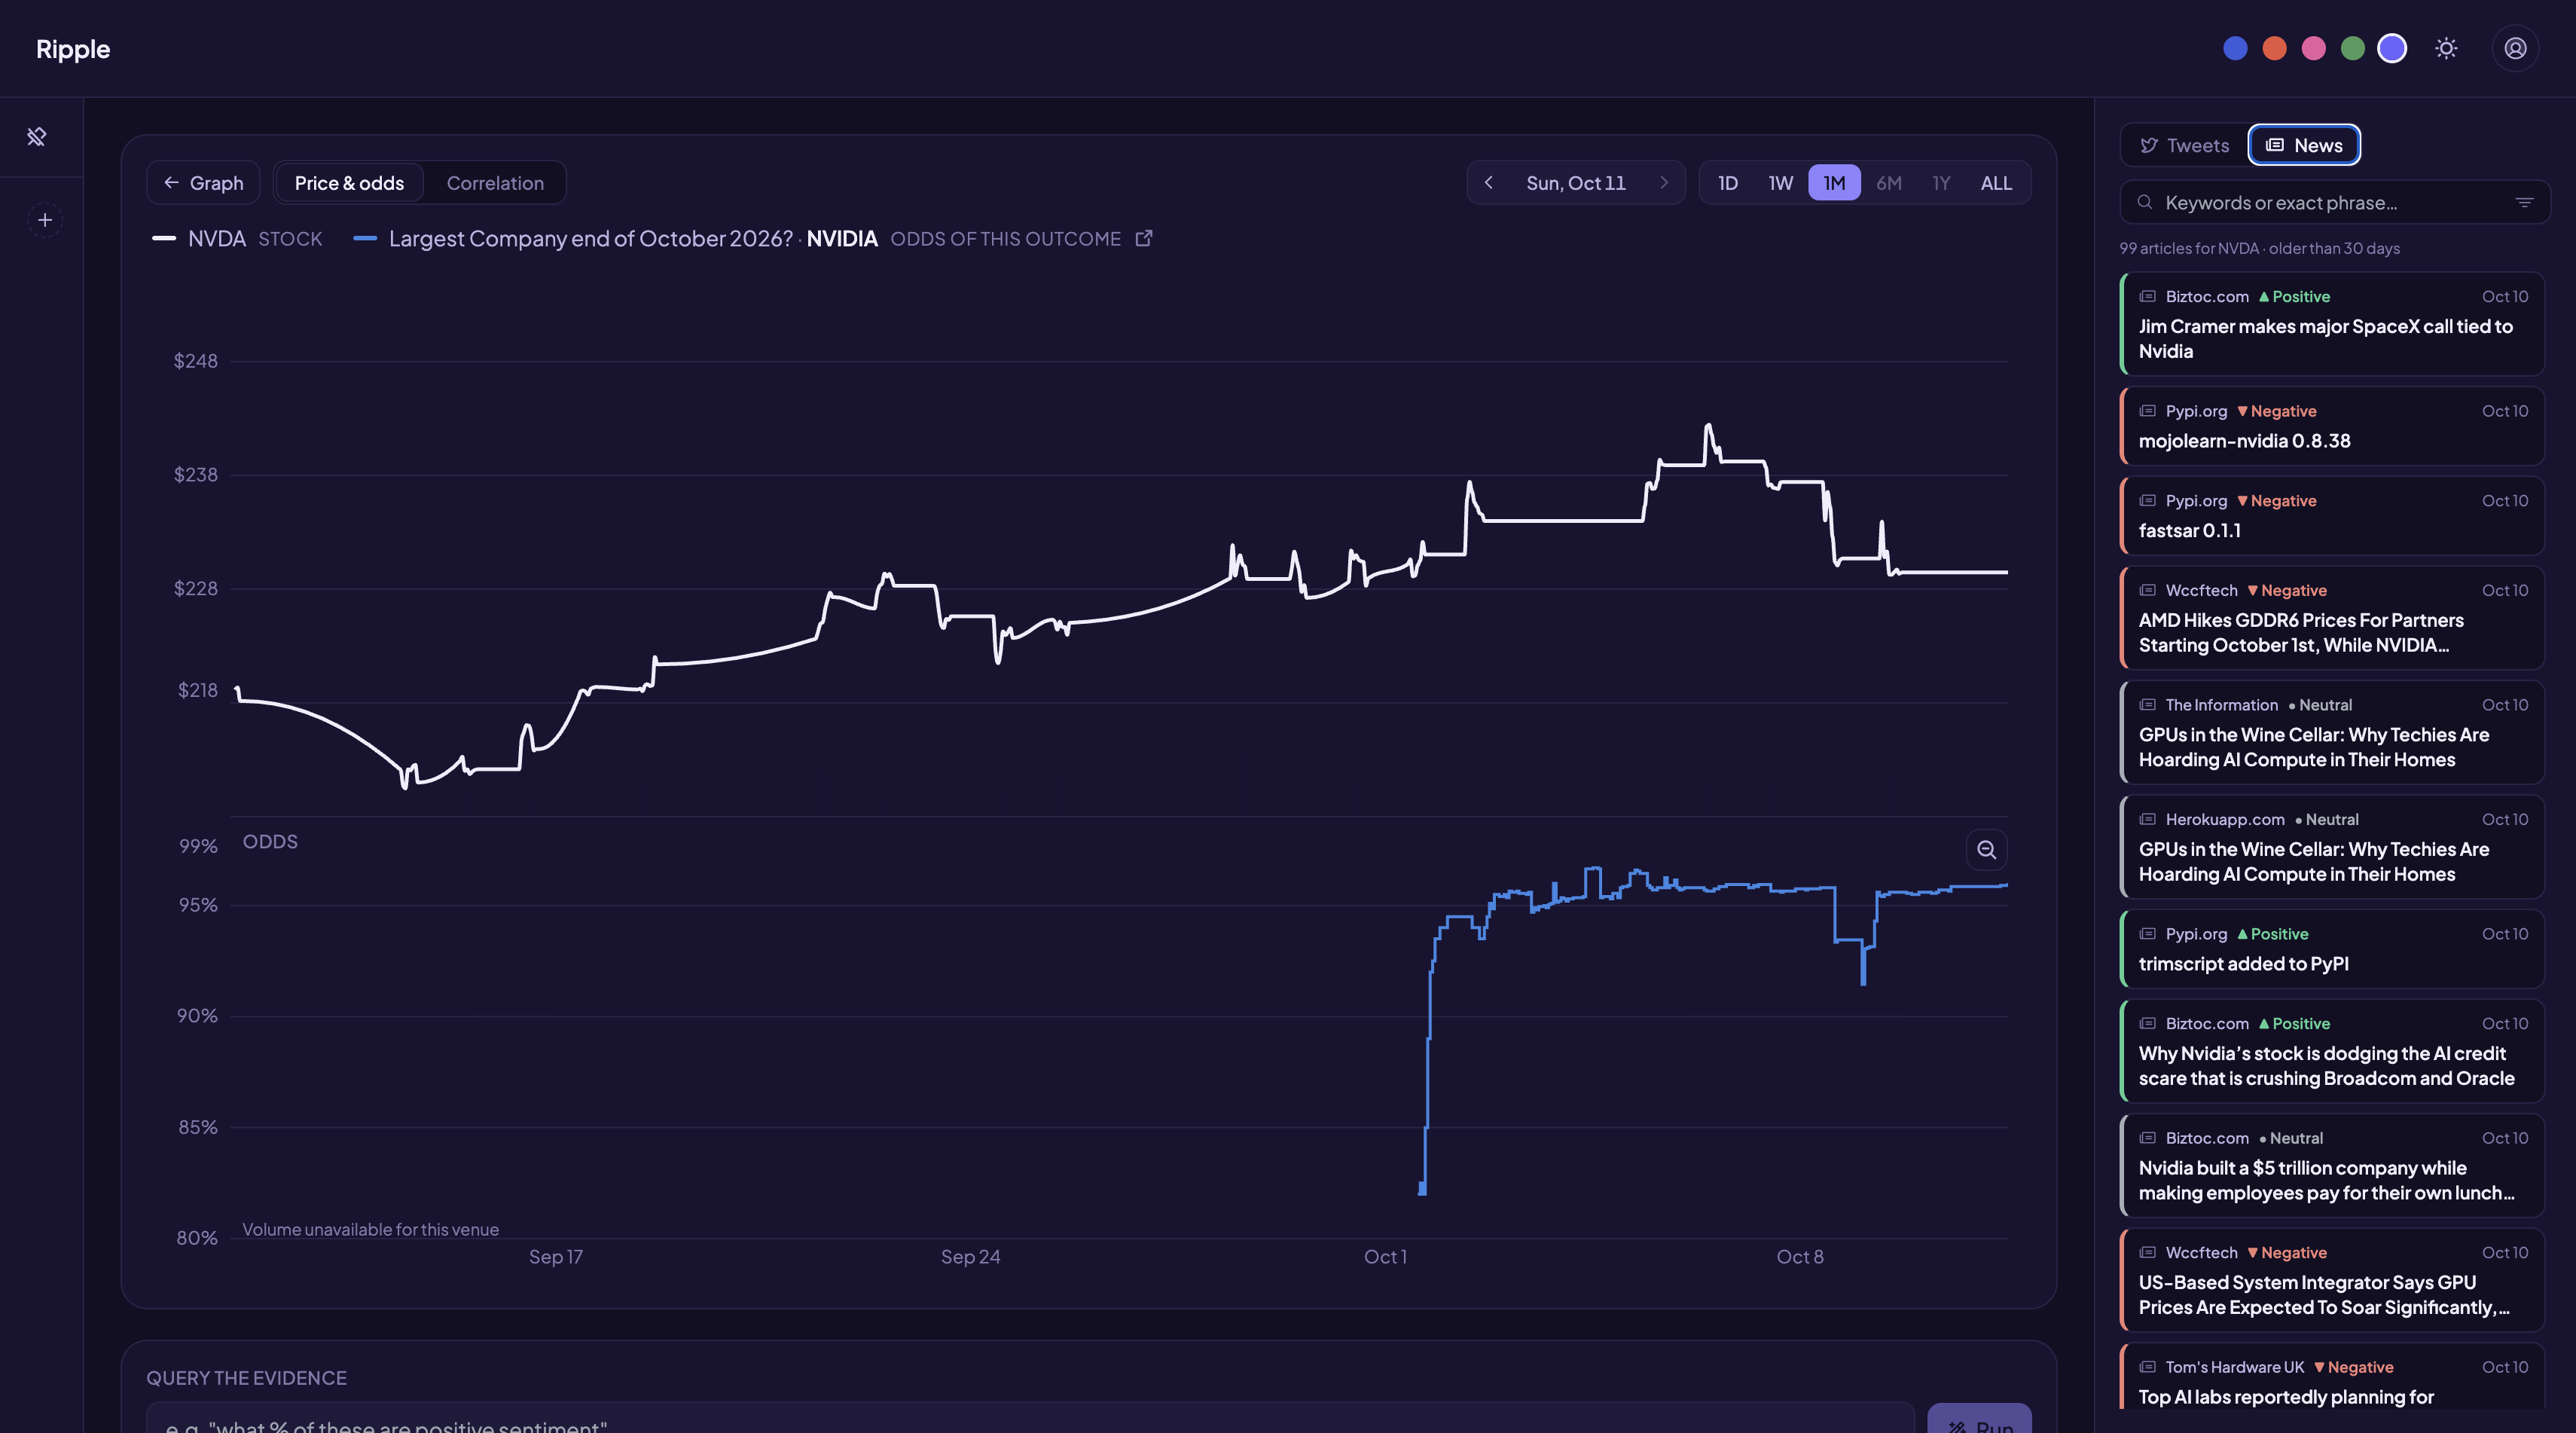
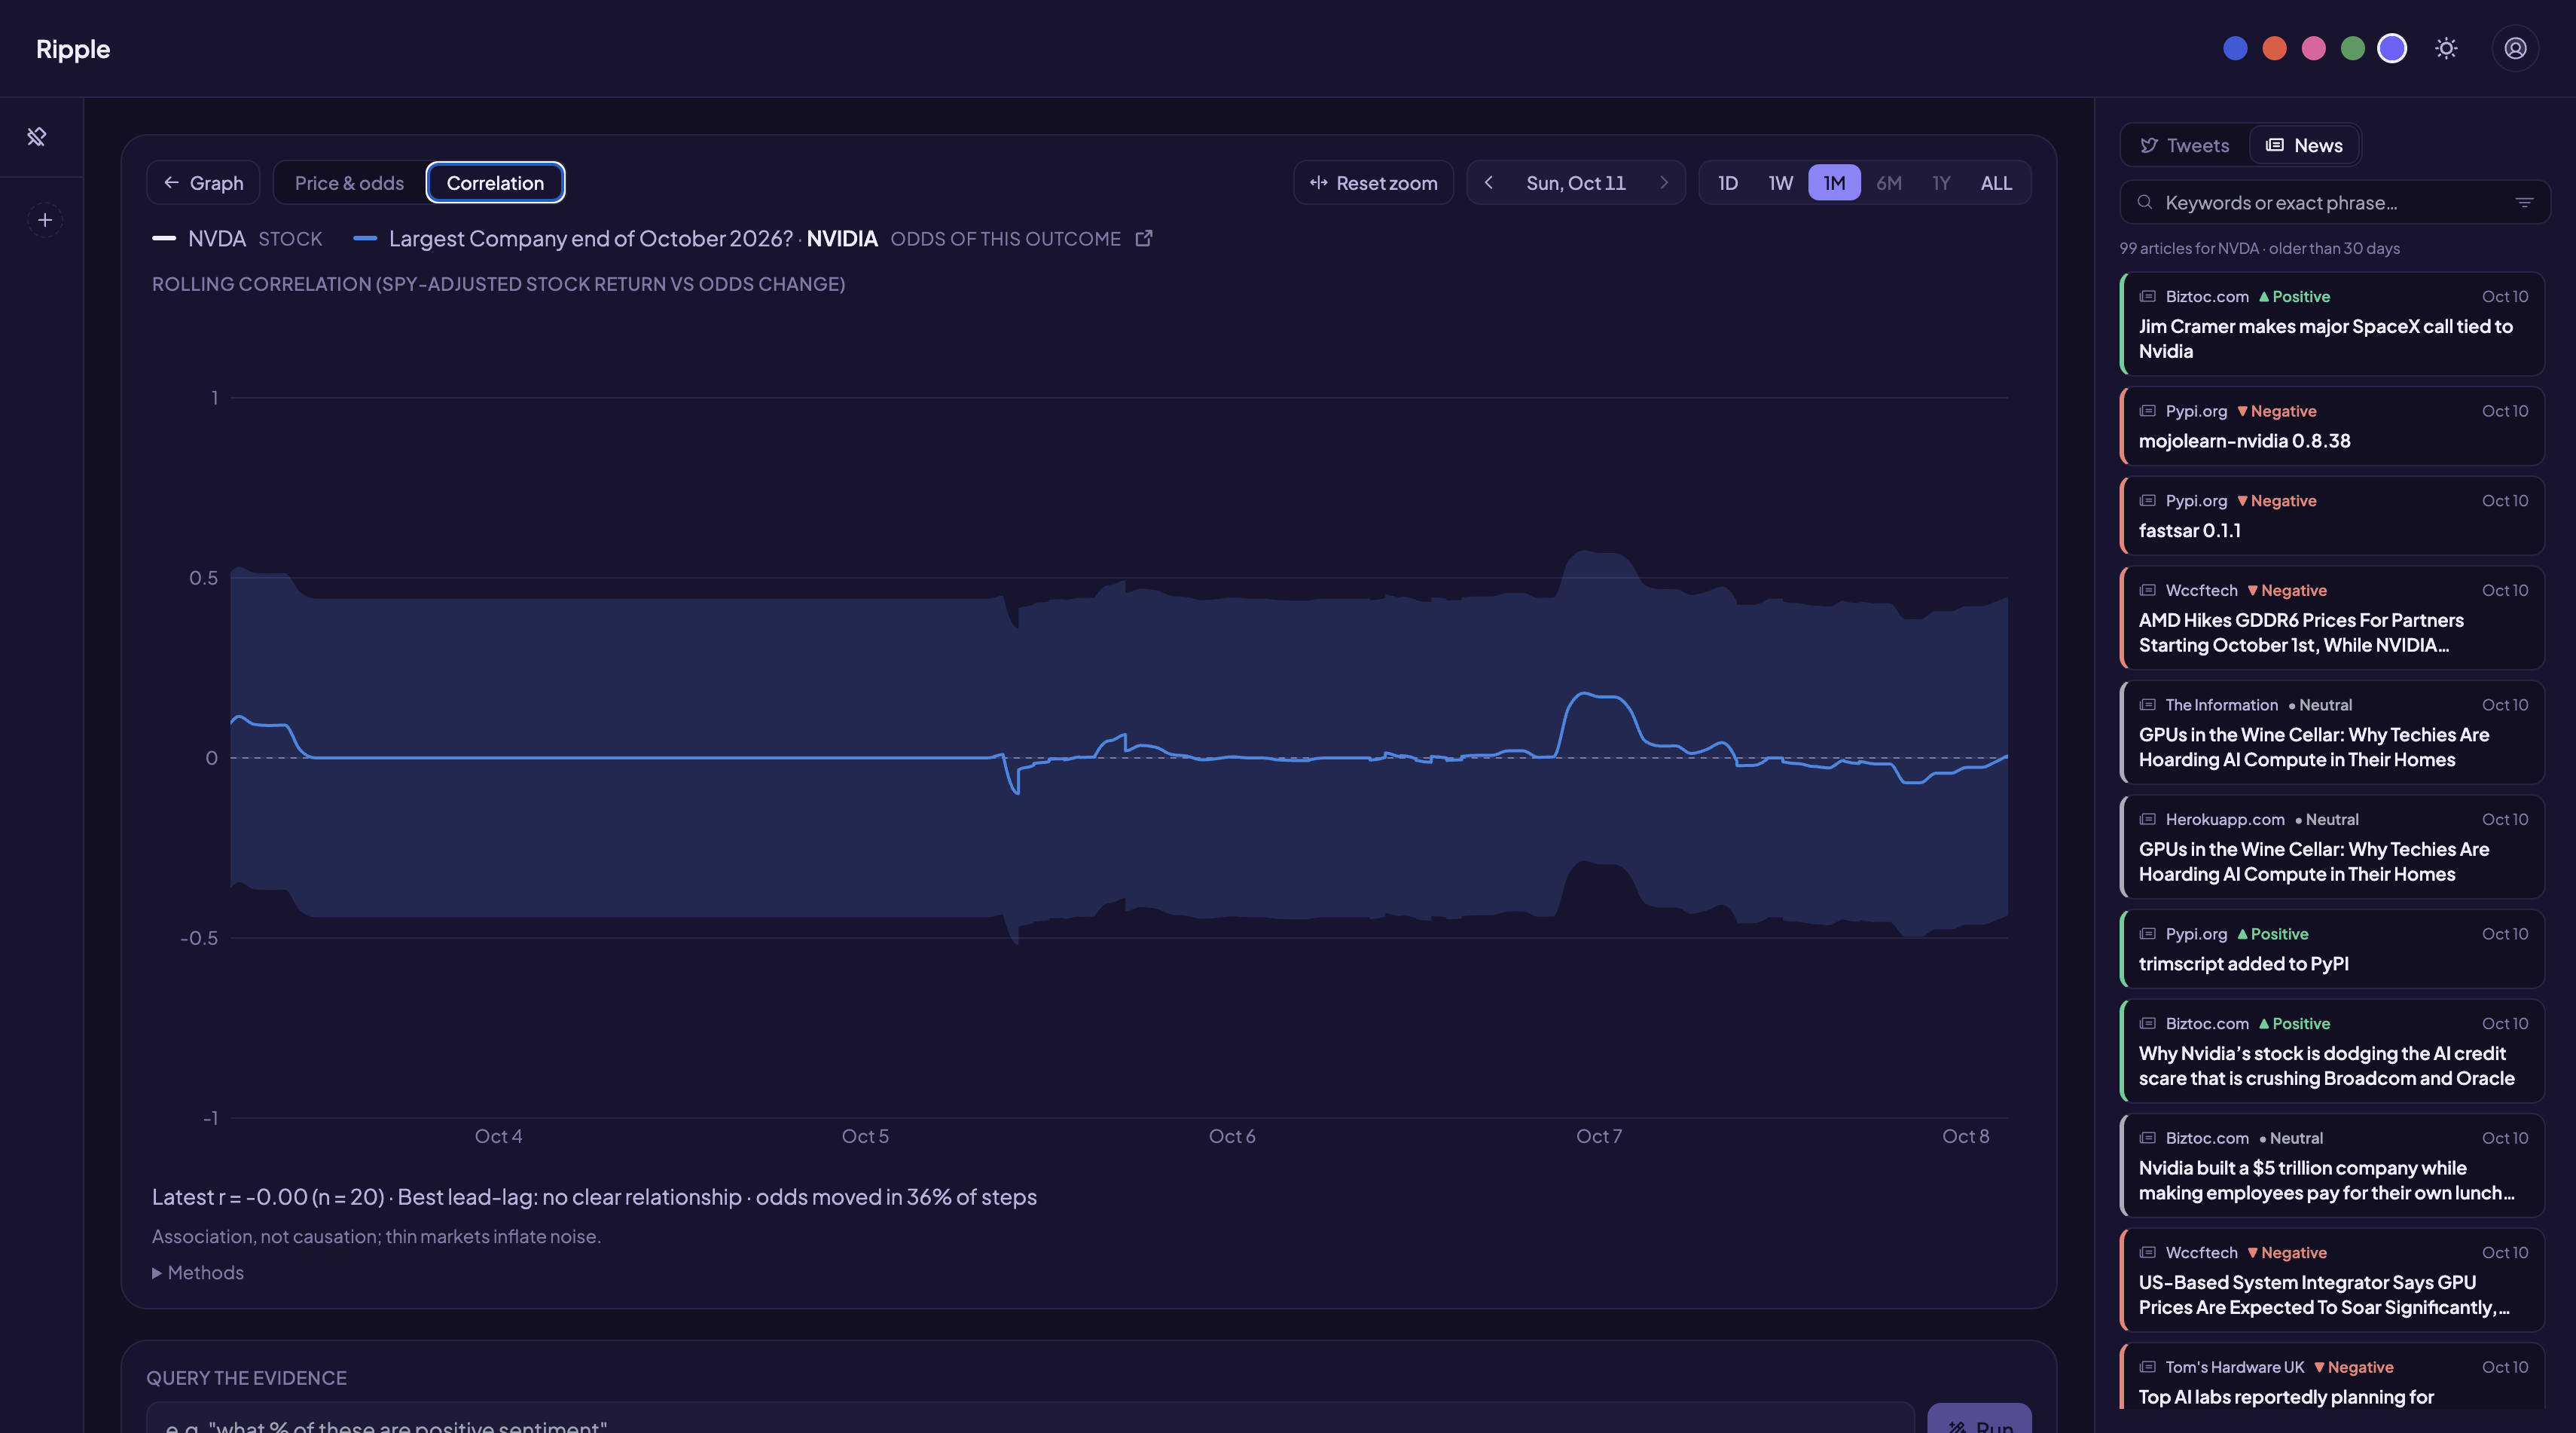
- Market view. A stock and a related prediction market are charted on the same timeline with volume, zoom, and a rolling correlation that shows whether the odds or the stock moved first.
- Projects. Save a graph and its markets as a project and come back to it later.
How we built it
- Backend: Python, FastAPI, SQLAlchemy, and Postgres hosted on Neon.
- Frontend: React, TypeScript, Vite, and Tailwind, with react-force-graph for the graph and Recharts for the charts.
- Data: Kalshi and Polymarket APIs, SEC EDGAR, NewsAPI, the X API, and Alpaca for stock prices.
- AI: Claude reads trimmed passages of SEC filings and returns the business relationship each one states, or nothing. TypeSafe's Jev classifier tags prediction markets with the companies they affect and types news events. Model calls go through OpenRouter, the Anthropic API, or Gemini, chosen by one setting.
To build a company's graph, we read its two most recent annual reports, then search every other company's annual reports for its name, since small suppliers name their big customers even when the big company stays quiet. Plain code cuts each filing down to the passages around phrases like "accounted for" and "sole source" before any model sees it.
We built it as a team of four, each working with Claude Code as a coding agent, with a written spec per feature and separate folders and branches to avoid merge conflicts.
Challenges we ran into
- Keeping the AI honest. A link is saved only if its evidence URL was downloaded in that same run. The direction of a highlight comes from the link type in code, not from the model, and reasons that read like price predictions are dropped.
- Messy SEC data. 215 company names produced broken search phrases (for example "JPMORGAN CHASE &"), so filings for JPMorgan, Eli Lilly, and others matched nothing until we fixed the name cleanup. Foreign companies like TSMC file a 20-F, not a 10-K, and were invisible at first.
- Apple names no suppliers. Its links had to come entirely from other companies' filings.
- Tight API limits. NewsAPI's free tier allows 100 requests a day and can't serve older date ranges, so we added a news cache table and a command to pre-fill it.
- Running out of model credits. We added an offline mode that saves every passage a run would send to the model, so the answers can be filled in and loaded back without an API call.
- A market's direction is not a stock call. "Yes went up" on a market doesn't mean a linked stock goes up, so live market moves pulse in a neutral color and only news highlights carry a direction.
- Campus wifi blocked our database port, so we wrote a small WebSocket tunnel to reach Neon.
Accomplishments that we're proud of
- The graph runs on real data. Searching Nvidia returns TSMC, Micron, and SK Hynix as suppliers and CoreWeave as a customer, each backed by a filing.
- A first search finishes in well under a minute, and stored graphs load instantly.
- More than 600 automated backend tests, plus tests for the chart math and graph merging on the frontend.
What we learned
- Use the model for reading and plain code for everything else. Fetching, trimming, validating, and deciding direction in code made the results faster, cheaper, and easier to trust.
- SEC filings are a better source of company relationships than news, because companies have to disclose major customers and key suppliers.
- Writing the specs first is what let four people and their coding agents build in parallel.
What's next for Ripple
- A backtest of whether highlighted companies actually moved after the event.
- Coverage for companies that don't file with the SEC, such as Panasonic.
- Following more company-specific prediction markets, so market-driven alerts reach more of the graph.
Built With
- alpaca
- claude
- jev
- kalshi
- openrouter
- polymarket
- postgresql
- python
- react
- sec-edgar
- typescript


Log in or sign up for Devpost to join the conversation.