-
-
Home Page
-
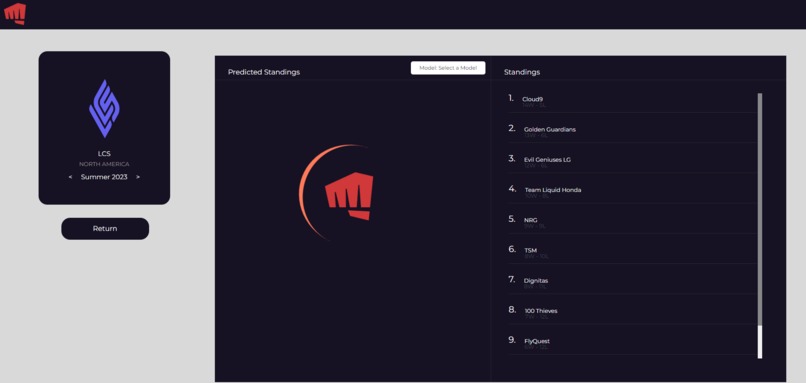
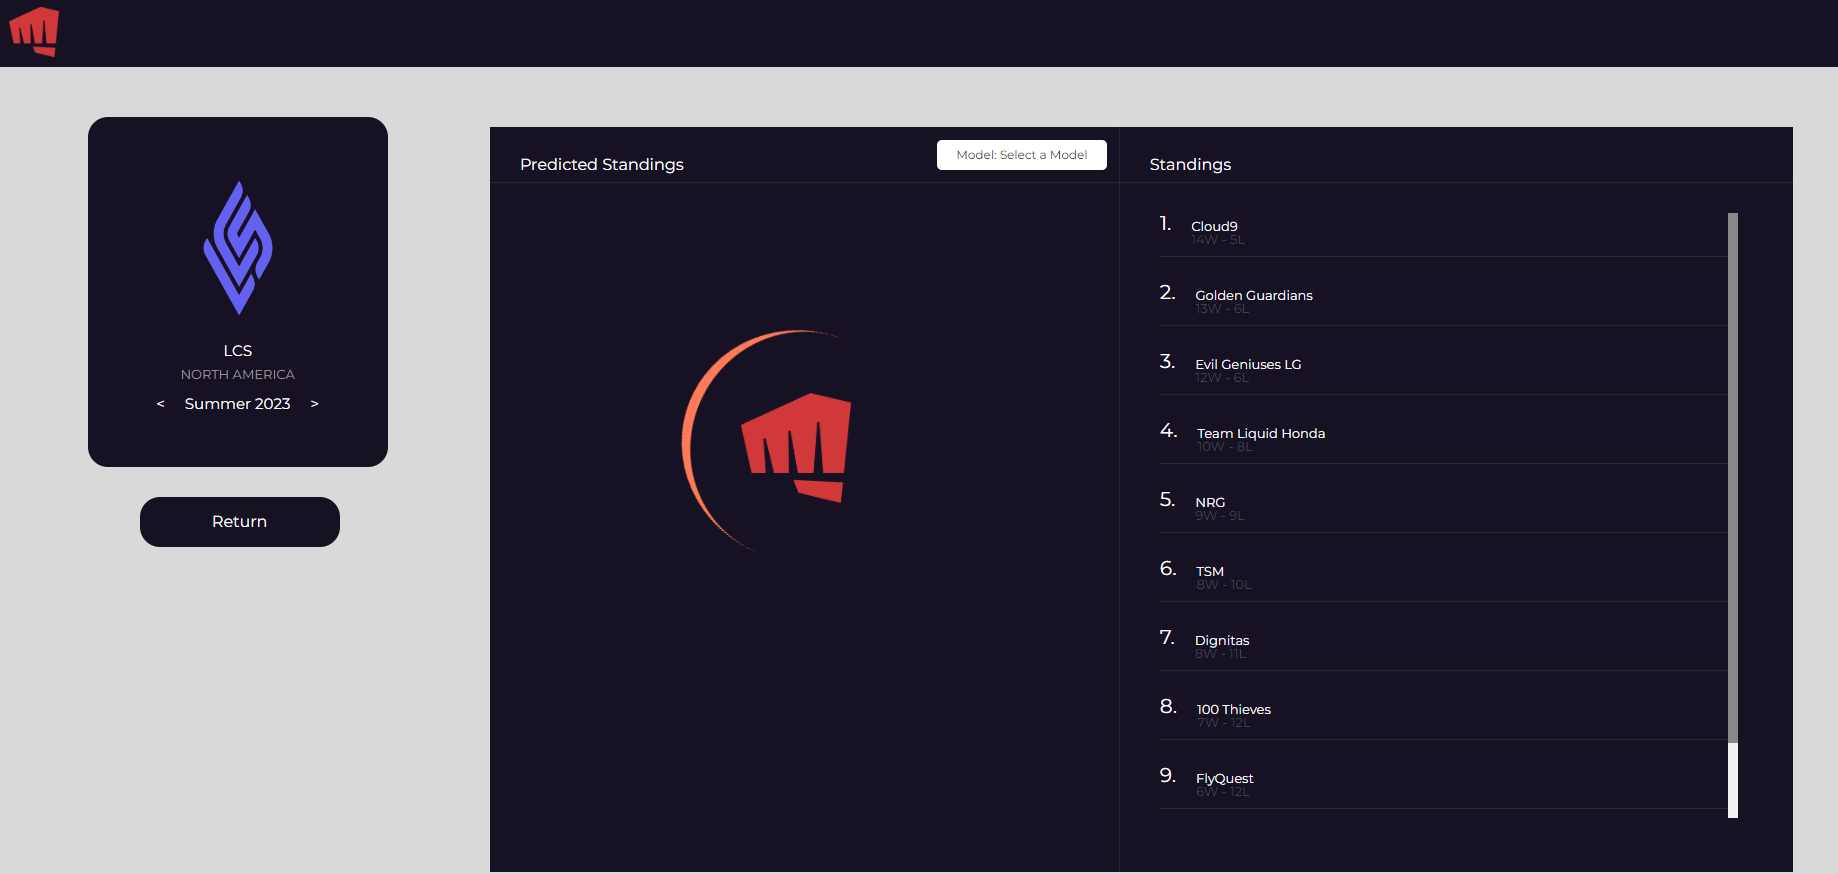
Actual standings with our predicted standings (hidden)
-
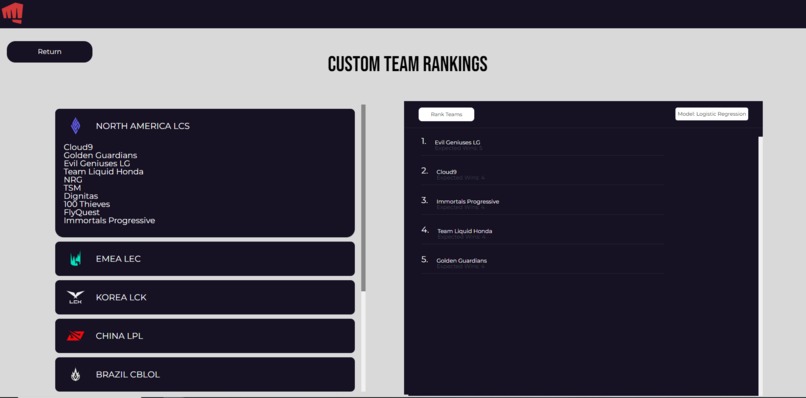
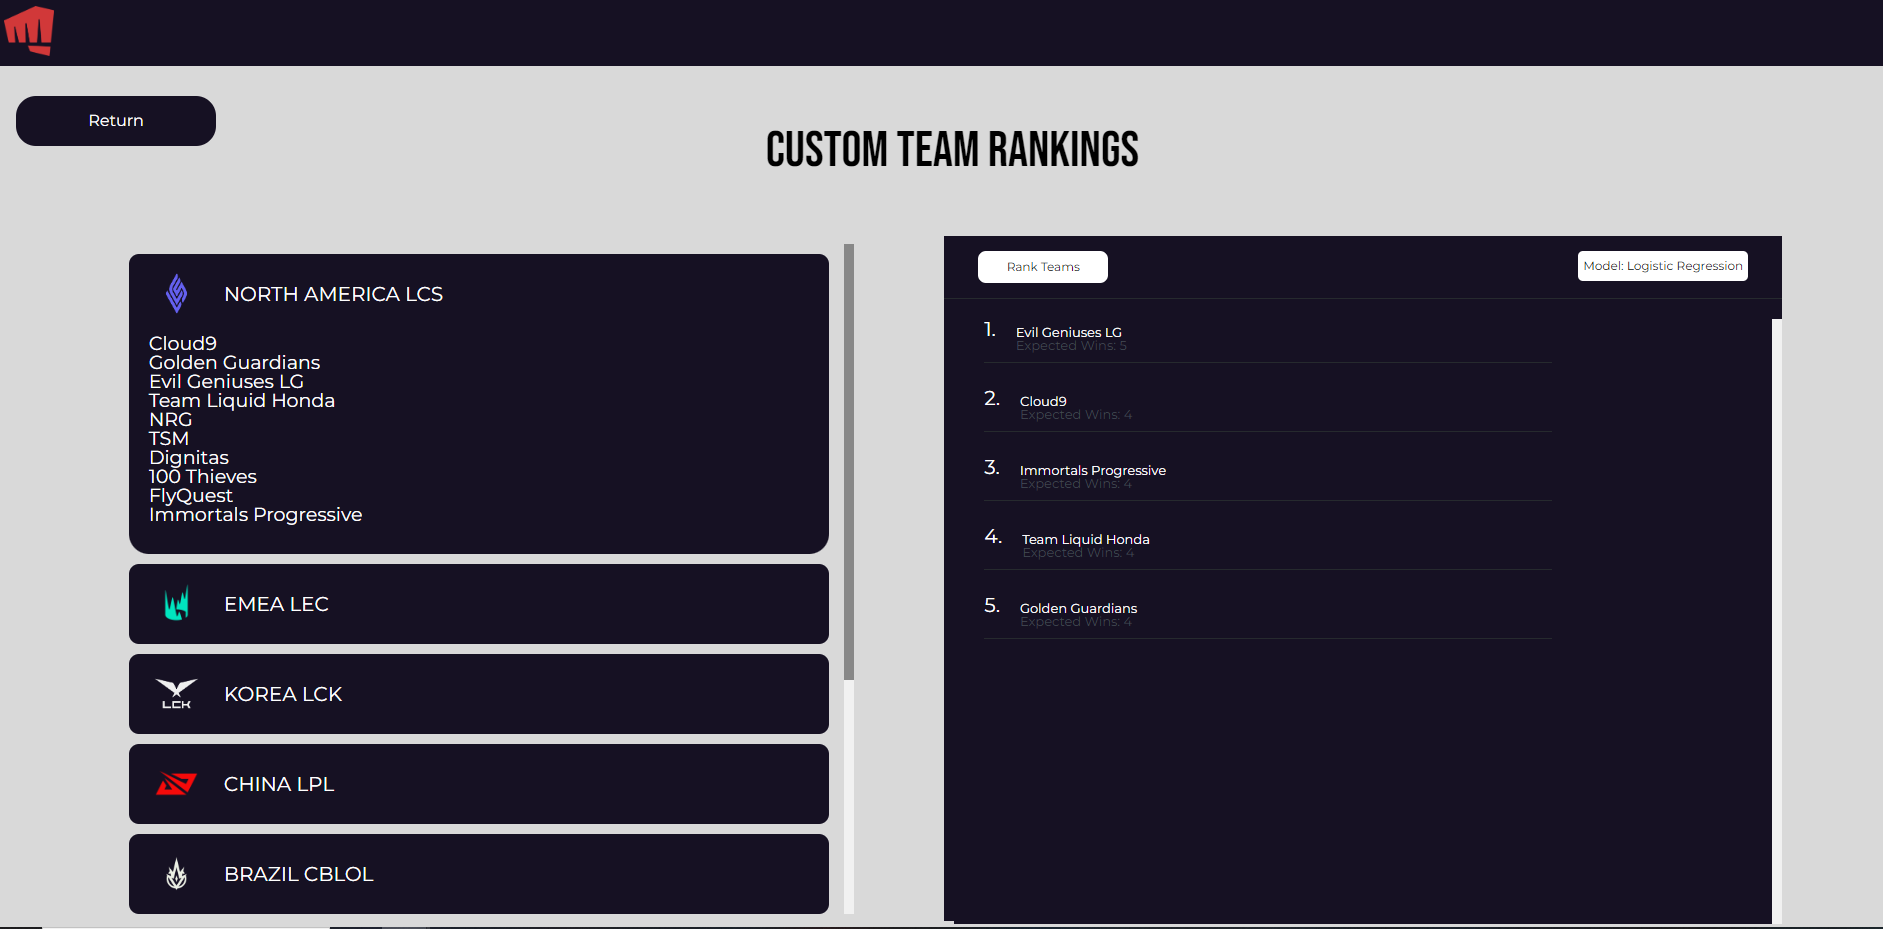
Custom Rankings Interface
-
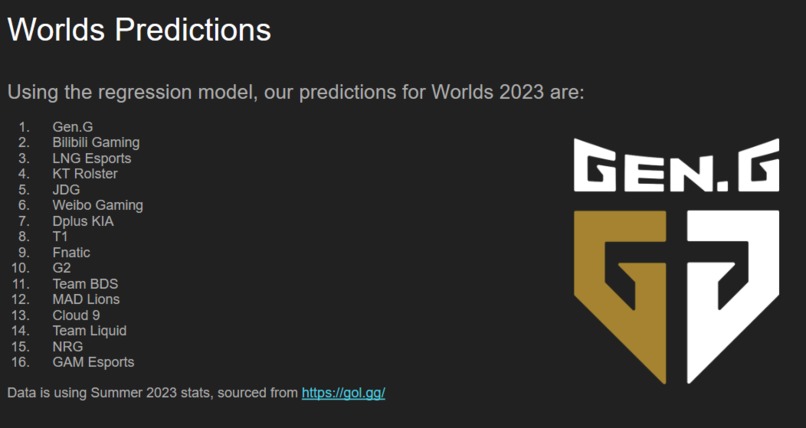
Worlds 2023 Rankings

Inspiration
As avid fans of all professional sports, we have seen the influence Machine Learning has had on popularizing sports betting and displaying live predictions in games. This Hackathon was an excellent opportunity for us to use our technical skills and challenge ourselves to create a model that would predict and rank the professional teams.
Testing Instructions
To test our project, head onto here. From here, the user should be able to choose from viewing global, tournament, and custom rankings.
What it does
Overview
Our project, viewable here, gives the user options to generate global, tournament, and custom rankings for a given list of teams. The global rankings generate a ranking of all teams in our filtered database- this includes all teams from leagues that are eligible for Worlds participation. The tournament rankings display the rankings of all teams that participated in a selected tournament, and users are immediately able to compare them with the actual results of that tournament. Finally, the custom rankings display the rankings of all teams selected by the user.
Model Philosophy
The philosophy of our model is calculating the expected wins in a matchup between two teams. Given the cumulative stats of two teams, the model would predict the probability for each team to win, which would be interpreted as the expected wins. This means that given a list of teams, our model would predict the total expected wins from every team playing each other exactly once. We had various approaches but ultimately settled on a logistic regression model as our most confident model.
How we built it
Data Cleaning and Preparation
In order to predict the outcomes of these 'simulated' matches, we had to prepare and clean the data. The main steps were removing any unnecessary and missing data, and choosing features to fit our model and make predictions. There were various approaches, but we ultimately settled on creating cumulative stats for every team. We calculated the “cumulative stats” for each team as a weighted average of various team statistics, with a higher weighting on recent games. We hand-selected a list of statistics that we thought would be relevant for our machine learning models, with the expectation that our models would filter out features that don’t have significant predictive power. We used a combination of simple, traditional statistics such as average barons, dragons, and K/D ratio, while some stats were more creative and required additional computation (Ex. first blood rate, gold differential @ 14 as that is when turret plates fall), etc. We used the “scale by 90” method to increase the weighting of more recent games. In this method, each time a new game is played, the weightings of all previous games are scaled down to 90%. This gave more weight to more recently played games and was done to help combat the large changes made to the game and team rosters each season.
Model Fitting and Data Adjustments
In our model fitting process, we decided to create a Naive Bayes model as a performance baseline and then used the Random Forest and Logistic Regression models to create a better-performing model. The Naive Bayes assumes every feature is independent of all other features, and uses conditional probability to predict the results. The process of creating the Random Forest was most useful in identifying some important concerns. The initial model produced results that clearly overrated select 'minor' or 'wild-card' region teams, as those regions are less competitive and tend to have a couple of dominant teams. This raised the issue that there were far fewer international games compared to regional games, potentially deeming the region features as unimportant. Although several changes, such as heavily weighting the international games (a 100:1 ratio with regional games) and finding optimal hyperparameters improve the model, it was still limited by the unimportance of the regional features and decision trees' tendencies to favor features with high cardinality (regional features were formatted with the one-hot method). Although we could have settled with these results, we knew from historical performances that region strength definitely exists, so we continued with the logistic regression model. With our logistic regression model, we tried to identify the correlations between the cumulative statistics calculated from the data processing stage in order to predict the outcome of a matchup between two teams. Before training, model hyper-parameters like regularization strength and the type of regularization were fine-tuned using a Grid Search method with cross-validation. Then, we trained on the standardized dataset where features had been scaled to ensure consistent interpretation across the different feature dimensions. Post-training, the model's performance was evaluated using a separate validation set, and we further verified its predictive accuracy using stratified k-fold cross-validation. The end results were one we were quite happy with, and we decided to use this as our main model.
Reflection
Accomplishments that we're proud of
Overall, we think our model is a simple, yet effective model of capturing the essence of every team's strength. From our global rankings, the top of the list is dominated by Chinese and Korean teams, as expected, followed by EMEA and NA with a few wildcard regions sprinkled in. The expected wins method was a good alternative to predicting outright wins/losses (1/0), as it helped illustrate the competitiveness of each team.
Limitations
Unfortunately, the spirit of Power Rankings is to capture the immediate strength of these teams, and considering much of the data is based on historical performance, the model struggled a little bit on that front. Our data was also limited by not including individual player stats, as season-by-season roster turnover is a huge part of professional League of Legends and how a team performs each season. This is something to improve on for the future.
What we learned
Throughout the process, we learned a lot about the process of data cleaning and model fitting. This was a great opportunity for us to use a complex dataset and extract only the data we needed. Furthermore, we were able to use a lot of AWS services that we were unfamiliar with, and many of them ended up being integral to our development process.
BONUS: Worlds 2023 Predictions!
With the help of gol.gg, we were able to extract the team's most recent stats for this year's Worlds participants. The dataset is available on our Github repo. The dataset isn't perfect, but we thought it would be fun to watch how our model would fair as the tournament went on. The complete results are attached to our submission as an image, but we predict Gen.G to be this year's champion! We will be keeping a close eye on them as the tournament goes on.
AWS Services Used
- Amazon Relational Database Service (RDS)
- We used RDS to create a MySQL database to store our processed data. We chose this service because it was affordable, managed, and could easily be integrated with other AWS services
- Amazon Elastic Container Service (ECS) and Fargate
- We dockerized our API and frontend and used ECS and Fargate to deploy our containers. We wanted a serverless deployment option that was serverless and easy to use so we could focus more on application development. ECS provided this, in addition to being affordable integrating well with other AWS services.
- Amazon Elastic Container Registry (ECR)
- Store docker images for our API, frontend, and data cleaner. We liked that this service was cheap and integrated seamlessly with ECS
- Amazon CloudWatch
- This was used to monitor logs from our ECS containers
- Amazon Route 53
- We used Route 53 to create DNS records, to route traffic from our purchased domains, to our API and frontend
- Amazon Registry
- We used the Registry to purchase a domain for our API/frontend
- Amazon Identity and Access Management (IAM)
- IAM was used to manage AWS accounts for team members
- Amazon EC2 Load Balancers
- Application load balancers were used to route traffic from our static URL to our API/frontend
Built With
- amazon-cloudwatch
- amazon-ec2
- amazon-rds-relational-database-service
- amazon-registry
- amazon-route-53
- ecr
- ecs
- fargate
- python
- react
- route
- scikit-learn
- typescript

Log in or sign up for Devpost to join the conversation.