-
-

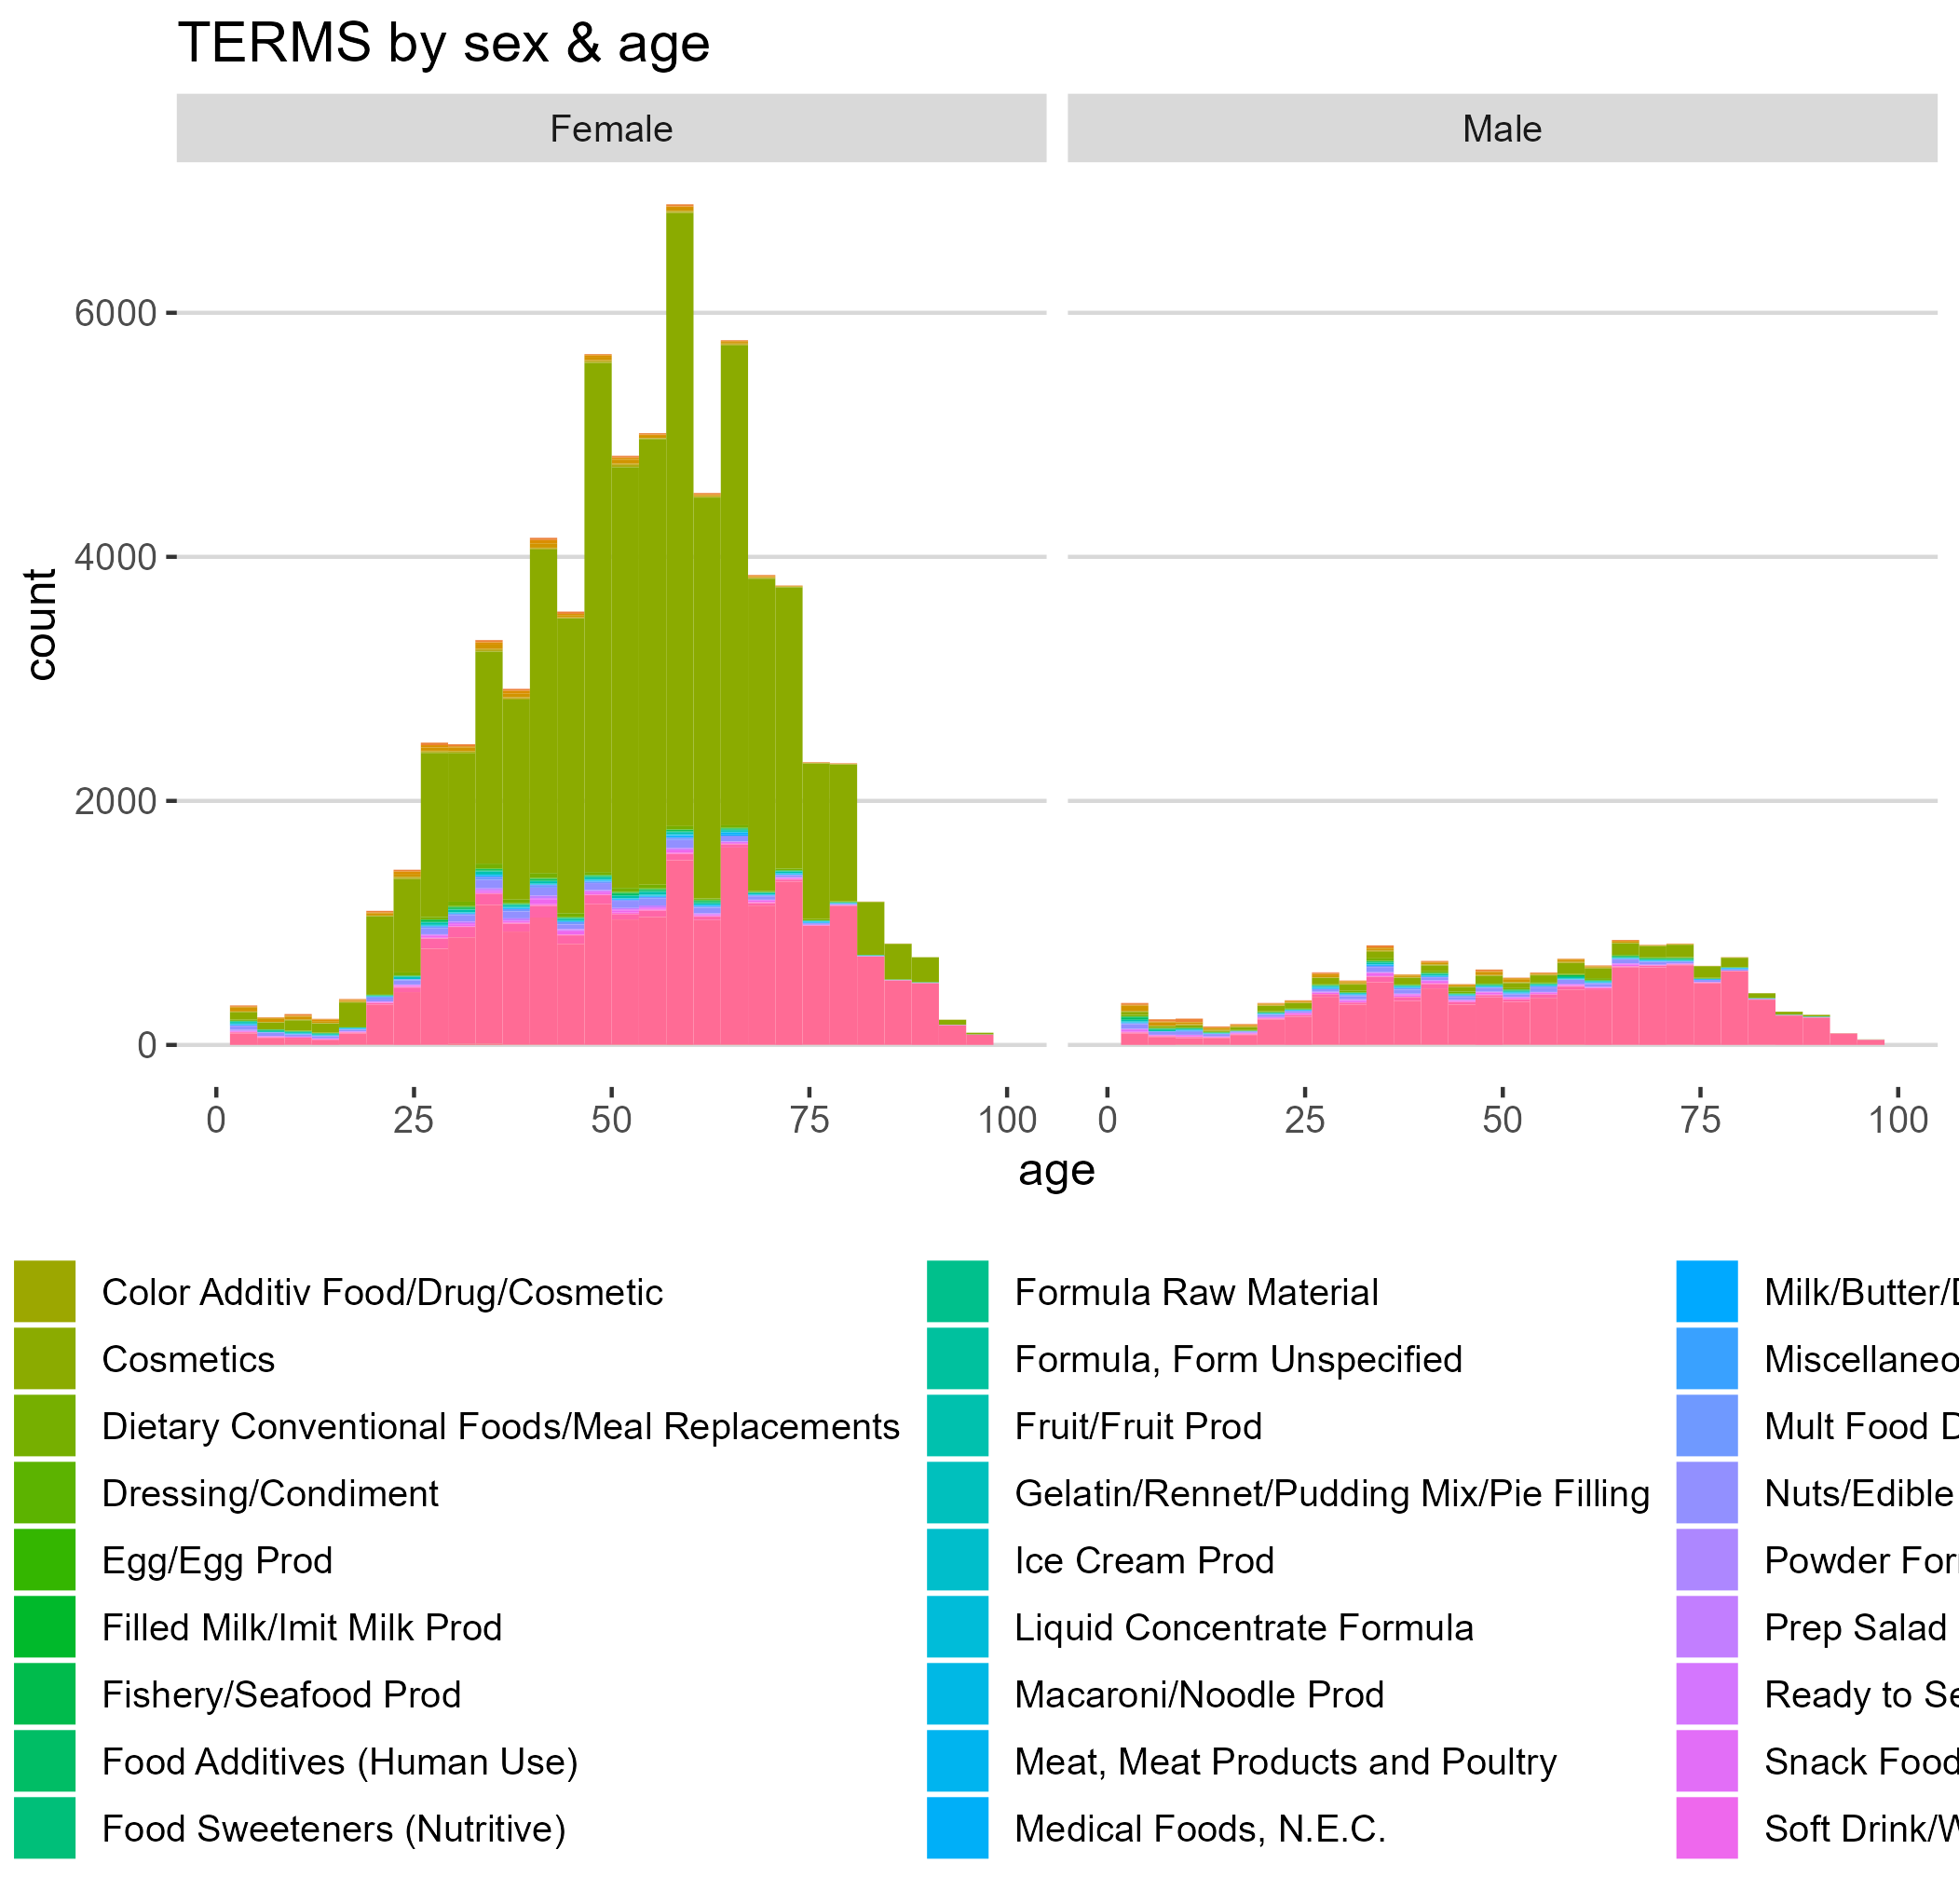
TERMS by sex and age
-
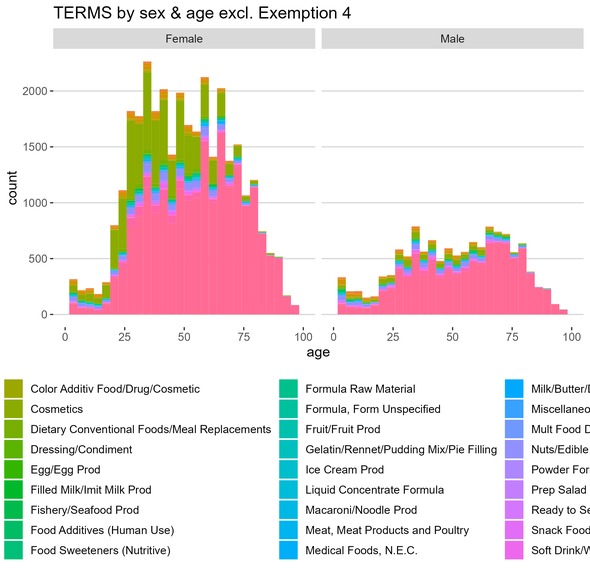
TERMS by sex and age excl. Exemption 4
-

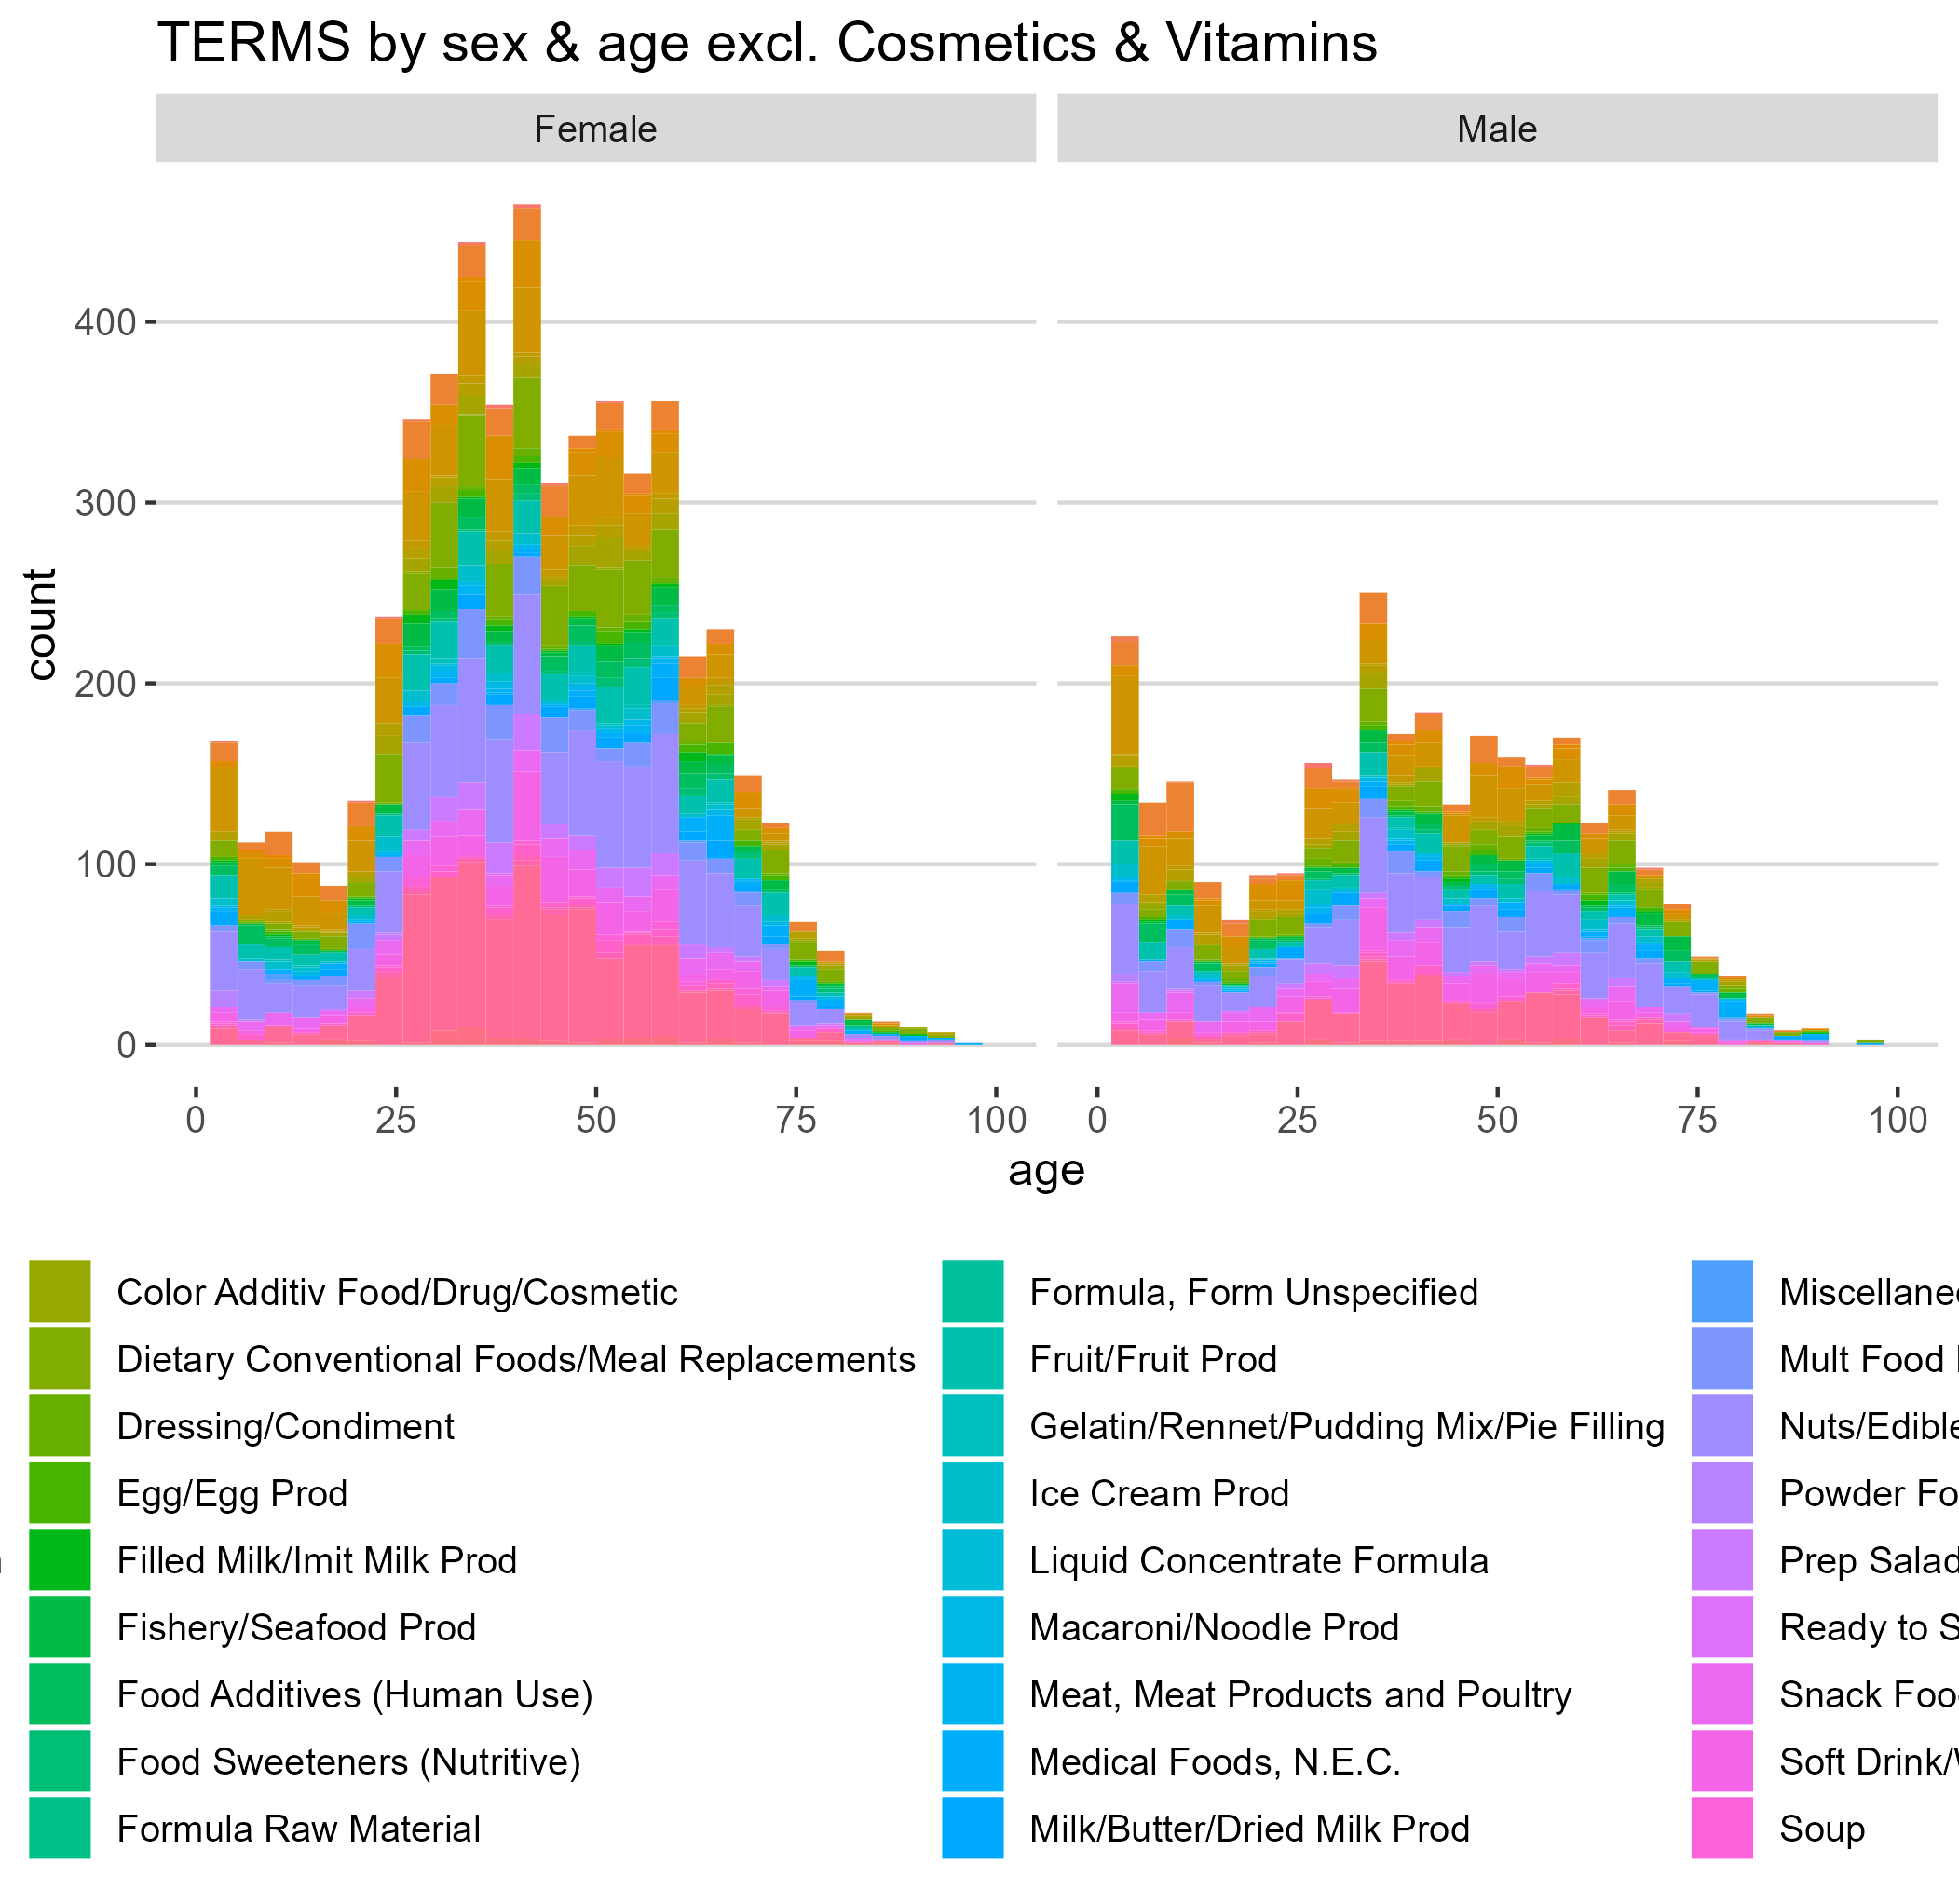
TERMS by sex & age excl. Cosmetics and Vitamins

Inspiration
Our inspiration for this project came from a desire to make a tangible impact on public health and exercise our beginner data science skills using a huge dataset of more than 200,000 entries. By examining a repository of FDA data, we saw an opportunity to uncover patterns and insights that could lead to improved safety standards and awareness around food and drug products in the United States.
What it does
Our project utilizes data analytics and data visualizations in R to sift through FDA adverse event reports. First, we imported the data set and performed basic cleaning and maintenance function. This included re-coding columns and filtering out entries labeled as concomitant, which are unlikely to be causative. We then subdivided the columns with wide data in it (the diagnostic terms and outcomes), and generated tall data tables dividing each into their unique lines. We generated three data sets - one clean raw data set with 1 incident/line, term data set with 1 term/incident/line, and one dataset with 1 outcome/incident/line. This allowed us to perform the subsequent analyses efficiently. We then inspected the data and chose several criteria to chose products for further investigation. These include products with (1) severe adverse events (>=3 deaths), (2) many adverse events (>=50 unique incidents), and (3) those affecting vulnerable populations (>=10 incidents affecting those below the age of 2 and above the age of 85). Our tool then generates a master list and creates figure with histogram and top 10 adverse event causes for each product that met the criteria. These can then be classified into those requiring immediate action, no action at all, or something in between. Our analysis also shows large trends, including disparate impact of adverse events on women. Lastly, we created an interactive web application with an interface for end users to explore our data. This will allow for earlier detection of future issues, especially in the context of vulnerable populations which often fall through the cracks.
How we built it
We built this project using a stack of data processing and visualization technologies. R's dplyr and tidyverse library was crucial for data wrangling and preparation. ggplot2 graphical package was used for figure generation. Shiny and related packages were used to create the web application and shinyapps.io was used for deployment.
Challenges we ran into
One of the major challenges was the sheer volume and complexity of the FDA data. Ensuring accuracy in data interpretation and dealing with missing or inconsistent data entries required sophisticated data cleaning techniques and a robust validation strategy. Data wrangling and cleaning up was especially a problem due to the missing data for date and gender that had to be dealt with.
Accomplishments that we're proud of
We're especially proud of developing a visualization dashboard that allows for effortless exploration of the data set. It focuses on data we found most meaningful to interpretation, while suppressing noise otherwise present in the data.
What we learned
Throughout this datathon, we've learned about the intricacies of FDA data, the importance of data cleanliness, and the power of collaborative problem-solving. We've also gained a deeper appreciation for the role of data in public health and regulatory affairs.
What's next for FDA Adverse Events Analysis
We would like to incorporate additional data into our prediction - the dataset available today was large, but included limited demographic information. Additionally, the outcomes data was coded into broad categories. Granularity would improve our analysis. Additionally, we would like to automate the final step of data evaluation - the analysis of candidates for trends and recency to identify products requiring action immediately and without direct input.

Log in or sign up for Devpost to join the conversation.