Inspiration
Every day, thousands of visitors leave reviews about Pashupatinath Temple on TripAdvisor and Google. But nobody at the temple actually reads them. There's no system to understand what visitors feel, what problems they face, or why they complain. The temple management makes decisions based on guesswork, not data. Meanwhile, problems like river pollution, overcrowding, and touts harassing visitors keep getting worse. We realized that all the answers are already hidden in those reviews — we just needed a way to extract and connect them. That's why we built RIA.
What It Does
RIA takes thousands of messy, unstructured visitor reviews and turns them into clear, actionable intelligence for heritage site managers. It does four things:
1. Keyword Search with Filters — You can search any word (like "sadhu", "cremation", "entry fee") and instantly see how many times it appears in reviews, whether it's positive or negative, and read real visitor quotes. You can also filter by aspect category (ritual experience, service quality, cleanliness, etc.) and by sentiment (positive, negative, neutral).
2. Causal Chain Tracing — This is the game-changer. Most tools just tell you "overcrowding is negative." RIA tells you WHY. It traces the full chain: overcrowding happens during festivals → this blocks ritual access → non-Hindu visitors feel it worst because they're already restricted → visitors leave frustrated instead of spiritually fulfilled. Every step is backed by real quotes from real reviews.
3. Network Analysis — RIA builds a network graph showing how all experience elements connect. It revealed that "a guide" is the most central node — meaning improving guide quality would have the biggest impact on overall visitor experience. It also showed that problems cluster around services (service↔issue is the second-strongest connection).
4. Monthly PDF Reports — Managers can generate downloadable PDF reports for any month with executive summary, critical issues, causal chains, network changes, completed actions, pending tasks, recommendations, and UNESCO compliance notes.
How We Built It
Step 1: LLM Semantic Understanding — We fed raw visitor reviews through a Large Language Model that extracts structured data: named entities (who/what is mentioned), relationships (co-occurrence and causal links), aspect-level sentiments, and entity types.
Step 2: Heterogeneous Information Network — We took all that structured data and built a network graph with four node types (Attraction, Sentiment, Issue, Service) and two edge types (co-occurrence and causal). Edge weights are calculated using a weighted formula: w = 0.7 × co-occurrence frequency + 0.3 × causal strength.
Step 3: Network Analysis — We compute degree centrality for every node to find which experience elements are most important, and cross-category connectivity to reveal which types of experiences interact most.
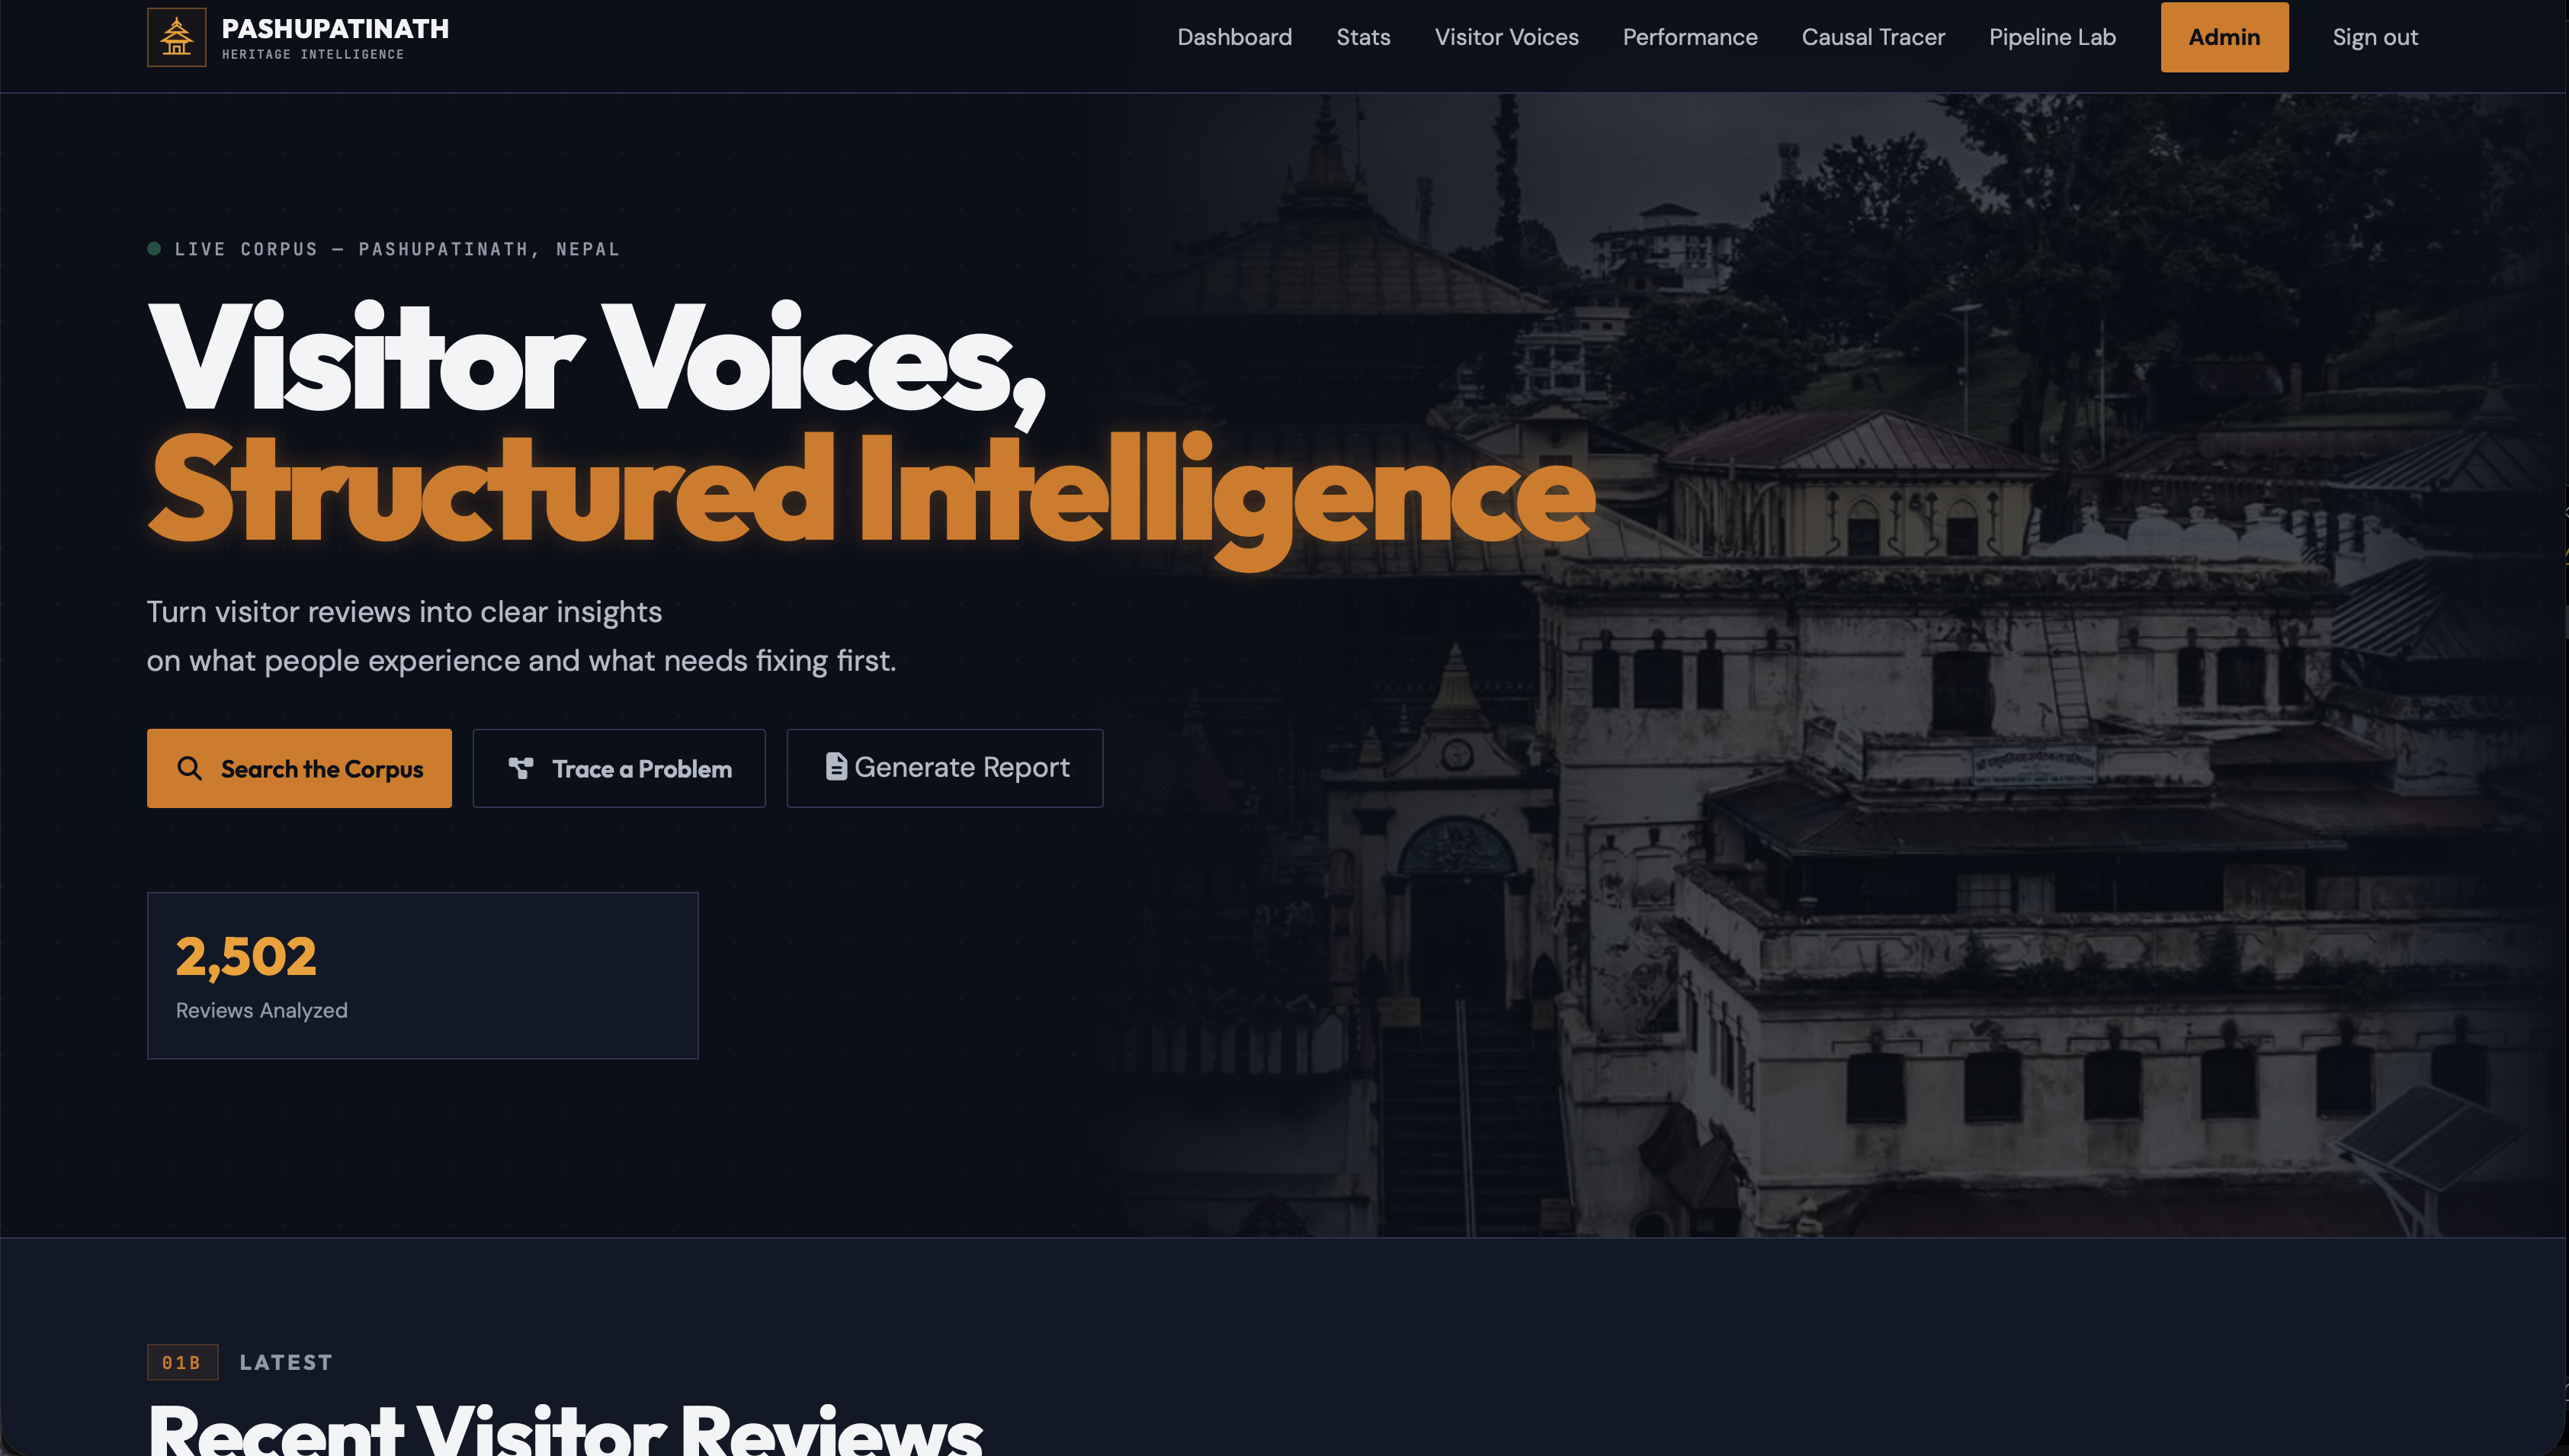
Step 4: Dashboard & Reports — We built an interactive web dashboard with the spiritual theme of Pashupatinath (saffron gold, sindoor red, Bagmati teal colors, diya flame animations, Om symbol) and PDF report generation using jsPDF.
Tech Stack: LLM (GPT-4) for semantic extraction, Python for network construction, HTML/CSS/JS with Tailwind CSS for the dashboard, Chart.js for visualizations, jsPDF for PDF generation.
Challenges We Ran Into
1. Causal extraction is hard — Most reviews describe feelings, not causes. "The crowd was terrible" is easy to extract, but WHY it was terrible requires understanding context. We had to carefully design our LLM prompts to distinguish between simple mentions and actual cause-effect relationships. We only kept relationships where the review explicitly states a cause (like "the long queue BECAUSE of the festival").
2. Entity disambiguation — Different reviews use different words for the same thing: "cremation", "cremations", "burning ghats", "funeral pyre" — all refer to the same experience. We had to build a canonical entity mapping system to merge these variants into single nodes.
3. Sparse network — With 300 nodes and only 134 edges, our network is very sparse (density 0.003). Many entities are mentioned only once and never connected to anything. We had to design the dashboard to focus on the connected core rather than isolated nodes.
4. Balancing co-occurrence vs. causality — Co-occurrence edges are much more common than causal edges. If we weighted them equally, causal insights would get drowned out. That's why we chose 0.7 for co-occurrence and 0.3 for causality — co-occurrence dominates as a signal, but causality still contributes meaningfully.
5. Making it useful for non-technical users — Temple managers and government officials don't understand network graphs. We had to translate centrality scores and edge weights into plain language: "Guides are the most impactful thing to fix" instead of "Node 'a guide' has centrality 0.0167."
Accomplishments That We're Proud Of
1. The causal tracer actually works — It doesn't just flag problems, it traces WHY they happen. The overcrowding chain (festival → squeezed ritual access → non-Hindu compounding → frustration) is a genuine insight that no sentiment analysis tool would produce.
2. We discovered that "a guide" is the network hub — This wasn't obvious. Guides aren't the most mentioned entity, and they aren't the most complained about. But in the network structure, the guide node connects to more different experience categories than any other node. This means investing in guide quality would improve the entire visitor experience system, not just one aspect.
3. The UNESCO alignment — Our system automatically satisfies UNESCO's OA2.2 periodic reporting requirement for "systematic monitoring of visitor satisfaction." The monthly PDF reports can be directly submitted as evidence of proactive heritage management.
4. Government policy alignment — We mapped our system to 10 specific points in the RSP government's manifesto and 7 points in the FY 2083/84 policy. The "One Door Digital Tourism System" the government announced needs exactly the analytics layer we've built.
5. Built with the real Pashupatinath vibe — The dashboard feels like you're at the temple: saffron gold like the priest's dhoti, sindoor red like the offerings, Bagmati teal for the sacred river, floating ember particles like the cremation ghats, a flickering diya flame, and the Om symbol. It's not just functional — it belongs there.
What We Learned
1. Network structure reveals what frequency hides — Just counting mentions tells you "river pollution is mentioned 39 times." Network analysis tells you "river pollution is connected to sacred atmosphere collapse, and fixing it would improve the entire spiritual experience narrative." The network view is fundamentally more useful than simple statistics.
2. Causal chains are the real product — Nobody cares about another sentiment dashboard. But showing WHY overcrowding leads to spiritual disappointment — with real visitor quotes at each step — that's something managers actually use to make decisions.
3. Heritage sites are underserved by technology — While hotels and restaurants have sophisticated review analytics, UNESCO World Heritage Sites have nothing. The temple management at Pashupatinath was making decisions with zero data. This is a massive gap and a real business opportunity.
4. The gap between technical output and government adoption is huge — We can build the best AI system in the world, but if we can't explain it in plain Nepali to a ministry official in a 15-minute meeting, it won't get adopted. Simplification and translation are as important as the technology itself.
5. Reviews contain secrets that even regular visitors don't see — By connecting hundreds of reviews into a network, we found patterns that no single visitor could observe. The fact that the non-Hindu entry restriction compounds overcrowding problems is only visible when you see the full causal chain — no individual reviewer made that connection explicitly.
What's Next for RIA
1. Pilot at Pashupatinath — We're seeking a 6-month pilot partnership with PADT (Pashupatinath Area Development Trust). Zero cost to them — we provide the platform, they provide site access and data. At the end, we co-publish a white paper on digital heritage management.
2. Real-time data pipeline — Currently we process reviews in batches. Next step is connecting directly to TripAdvisor and Google APIs for real-time sentiment monitoring and instant issue alerts.
3. Scale to other UNESCO sites — Lumbini, Chitwan, Kathmandu Durbar Square, Bhaktapur — all have the same problem. The same RIA architecture works for any heritage site. We want to build a SaaS model: government pays an annual subscription per site.
4. Guide certification module — Since "a guide" is the network hub, we want to build a guide management system: certified guides get QR codes, visitors scan and rate them, bad guides get flagged, good guides get promoted. This directly attacks the #1 leverage point our network revealed.
5. Crowd prediction engine — Our causal chain shows overcrowding is triggered by festivals. If we combine festival calendars with historical review volumes, we can predict crowd pressure 2-4 weeks in advance and recommend pre-emptive measures.
6. UNESCO partnership — We're applying for UNESCO's Digital Technologies for Heritage program to get international endorsement and grant funding. Once UNESCO backs the system, adoption by national governments becomes much easier.
7. Ministry integration — The Nepal government's "One Door Digital Tourism System" needs an analytics layer. RIA is that layer. We're preparing to pitch MoCTCA for integration into the national tourism infrastructure.
Built With
- fastapi
- gemma
- gliner
- postgresql
- react
