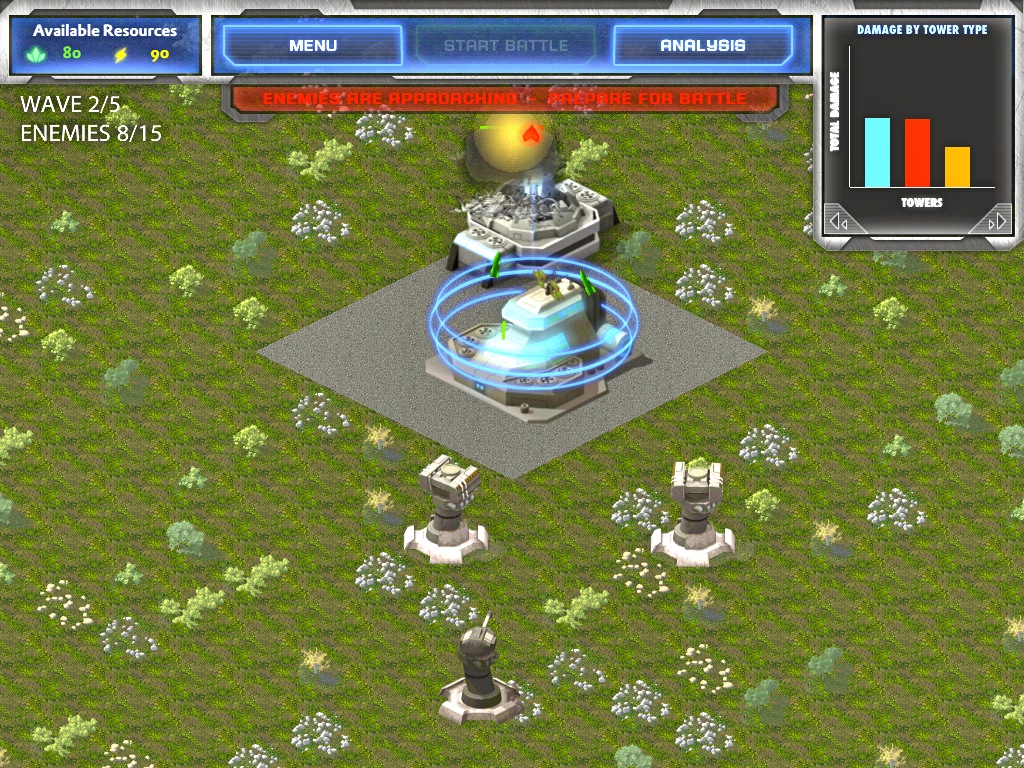


"Rho Planet" is an iPad game that teaches and measures introductory statistics knowledge, skills, and abilities (KSAs) aligned with Common Core State Standards for data analysis and inferential reasoning. The game’s stealth assessment system is based on Evidence Centered Design (ECD; Mislevy, Steinberg, & Almond, 2003) and the latest research in technology-based assessment (Bennett, et al., 2007; Mayrath & Clarke-Midura, 2012; Nihalani, Mayrath, & Robinson, 2011; Quellmalz & Pellegrino, 2009; Shute, et al., 2009).
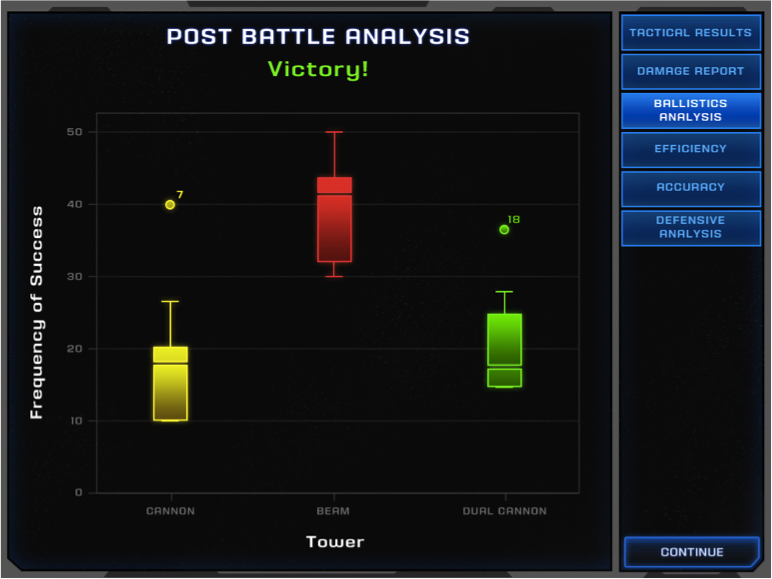
Rho Planet is a Real-Time-Strategy (RTS) / Tower Defense game that requires a student to go through multiple iterations of battle. The game is consistent with the scientific method in that students go through cycles of prediction and experimentation. Numerous types of data are presented to the student, including shots over time, damage over time, and percentage of adversaries over time, proportion shots by tower category, and many more. The data must be accurately analyzed to successfully progress through levels.
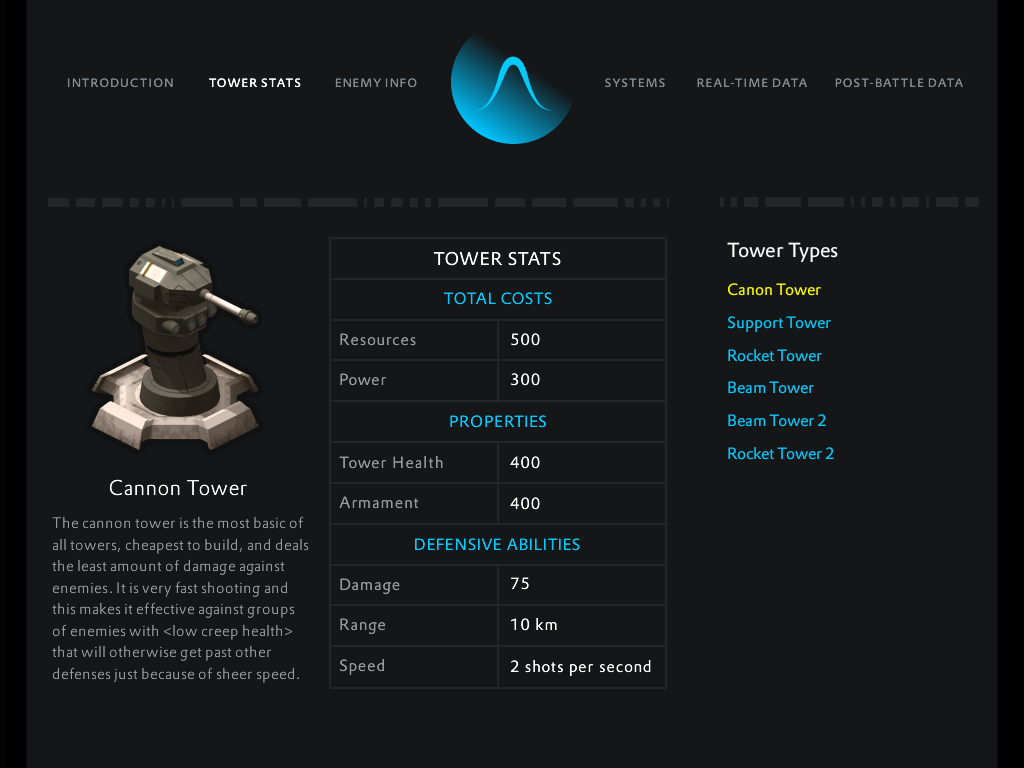
Rho Planet is unique in that e-textbook content and reference materials produced internally are embedded within the game. Consistent with experiential learning (Kolb, 1984), situated learning (Lave & Wenger, 1991) and anchored instruction (CTGV, 1990) theories, the game provides an authentic context for students to explore concepts, such as standard deviation or skew, through iterative cycles of experimentation and reflection. Our goal is to make the embedded e-textbook into the game manual. Students proactively seek out the e-textbook to figure out how to keep progressing in the game.
Through our research at Harvard on the Virtual Performance Assessment project and our dissertations at the University of Texas at Austin, we understand the necessity of unpacking KSAs into finely granulated observable variables. ECD was applied to develop tasks and scoring rules for measuring student proficiencies and current ability levels through the perspective of learning progressions. Design patterns were used for multiple types of assessments, and logdata tracks every move and decision a user makes while playing the game or while using the embedded instructional content.
Bayesian networks (BNs) are being used to model probabilistic inferences in our framework. The approach of using BNs was selected because they allow for making inferences about proficiencies by aggregating and synthesizing evidence from observed variables. The results of this modeling offer a data-based interpretation of the development of skills that constitute the learning progression.
The game is currently undergoing psychometric analyses for item validity, including a confirmatory factor analysis to establish if the skills that are assessed by the items/tasks conform to the skills as defined by the learning progressions.
LEARNING PROGRESSIONS
Rho Planet spans many Common Core State Standards for (9 - 12) High School: Statistics & Probability – Interpreting Categorical & Quantitative Data. Specifically, the game teaches and measures a students’ ability to: Summarize, Represent, and Interpret Data on a Single Count or Measurement Variable.
Our learning progressions framework contains five levels: Novice, Basic, Intermediate, Advanced, and Expert. Tasks reflect the set of KSAs students at that level would be expected to possess.
Due to space limitations and IP considerations, only one learning progression of the many Common Core standards we are measuring is detailed below:
H.DPS.1c Analyzing and summarizing the data resulting from studies using statistical measures appropriate to shape of the data (median, mean) and spread (interquartile range, standard deviation), and using data to support inferences (population parameters, sample size) or explain possible outliers
S-ID.2. Interpret differences in shape, center, and spread in the context of the data sets, accounting for possible effects of extreme data points (outliers).
Level 1 At Level 1, students have a Novice understanding of the concepts underlying data distribution and outliers. Given these understandings of data distribution and outliers, students should have difficulty analyzing data and making inaccurate inferences about the next round of battle. This level of proficiency is observed through log data associated with the student’s decisions about where to place towers after reviewing post-battle wave summaries.
For example, the student must examine charts with the Percentage of Adversaries Over Time, which represents summary data for waves of enemies during a battle. At Level 1, the graph will show lower rate of change over time indicated by a - 5 or lower value for slope. This lower rate of change indicates the inefficiencies in strategy, i.e., tower placement.
Additional observable variables collect data about proficiency levels; however, they are not detailed here due to space limitations and IP restrictions.
Level 2 At Level 2, students have a Basic understanding of the concepts underlying data distribution and outliers. The Percentage of Enemies Over Time graph’s slope should have a value greater than – 4 but less than - 3.
Level 3 At Level 3, students have an Intermediate understanding of the concepts underlying data distribution and outliers. The Percentage of Enemies Over Time graph’s slope should have a value greater than – 3 but less than - 2.
Level 4 At Level 4, students have an Advanced understanding of the concepts underlying data distribution and outliers. The Percentage of Enemies Over Time graph’s slope should have a value greater than – 2 but less than - 1.
Level 5 At Level 5, students have an Expert understanding of the concepts underlying data distribution and outliers. The Percentage of Enemies Over Time graph’s slope should have a value greater than – 1 but less than – 0.5.
REFERENCES
Bennett, R. E., Persky, H., Weiss, A. R., & Jenkins, F. (2007). Problem solving in technology- rich environments. A Report from the NAEP Technology-Based Assessment Project, Research and Development Series. NCES 2007-466.
CTGV, Cognition and Technology Group at Vanderbilt (1990). Anchored instruction and its relationship to situated cognition, Educational Researcher, 19(6), pp. 2-10.
Lave, J. and Wenger, E. (1991). Situated Learning: Legitimate Peripheral Participation. Cambridge: Cambridge University Press. ISBN 0-521-42374-0.; first published in 1990 as Institute for Research on Learning report 90-0013
Mayrath, M. C. and Clarke-Midura, J. (2012). Introduction to Technology-Based Assessments for 21st Century Skills. In M. Mayrath, J. Clarke-Midura, & D. H. Robinson (Eds.). Technology-based assessments for 21st Century skills: Theoretical and practical implications from modern research (pp. 1-11). Charlotte, NC: Information Age Publishing.
Mislevy, R. J., Steinberg, L. S., & Almond, R. G. (2003). On the structure of educational assessments. Measurement: Interdisciplinary Research and Perspectives, 1, 3-67.
Nihalani, P. K., Mayrath, M. C., & Robinson, D. H. (2011). When feedback harms and collaboration helps in computer simulation environments: An expertise reversal effect. Journal of Educational Psychology. 103(4), Nov 2011, 776-785. doi: 10.1037/a0025276
Quellmalz, E. S., & Pellegrino, J. W. (2009). Technology and testing. Science Magazine, 323, 75-79.
Shute, V. J., Ventura, M., Bauer, M., & Zapata-Rivera, D. (2009). Melding the power of serious games and embedded assessment to monitor and foster learning: Flow and grow. In U. Ritterfeld, M. J. Cody, & P. Vorderer (Eds.), The social science of serious games: Theories and applications (pp. 295-321). Philadelphia, PA: Routledge/LEA.

Log in or sign up for Devpost to join the conversation.