-
-
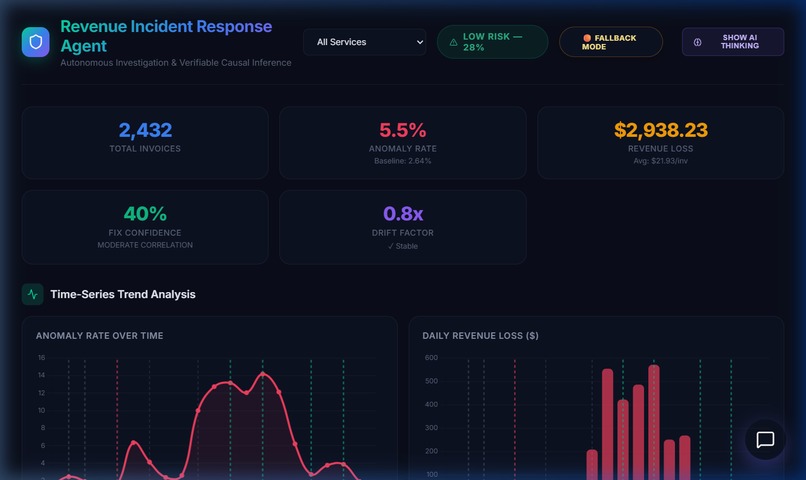
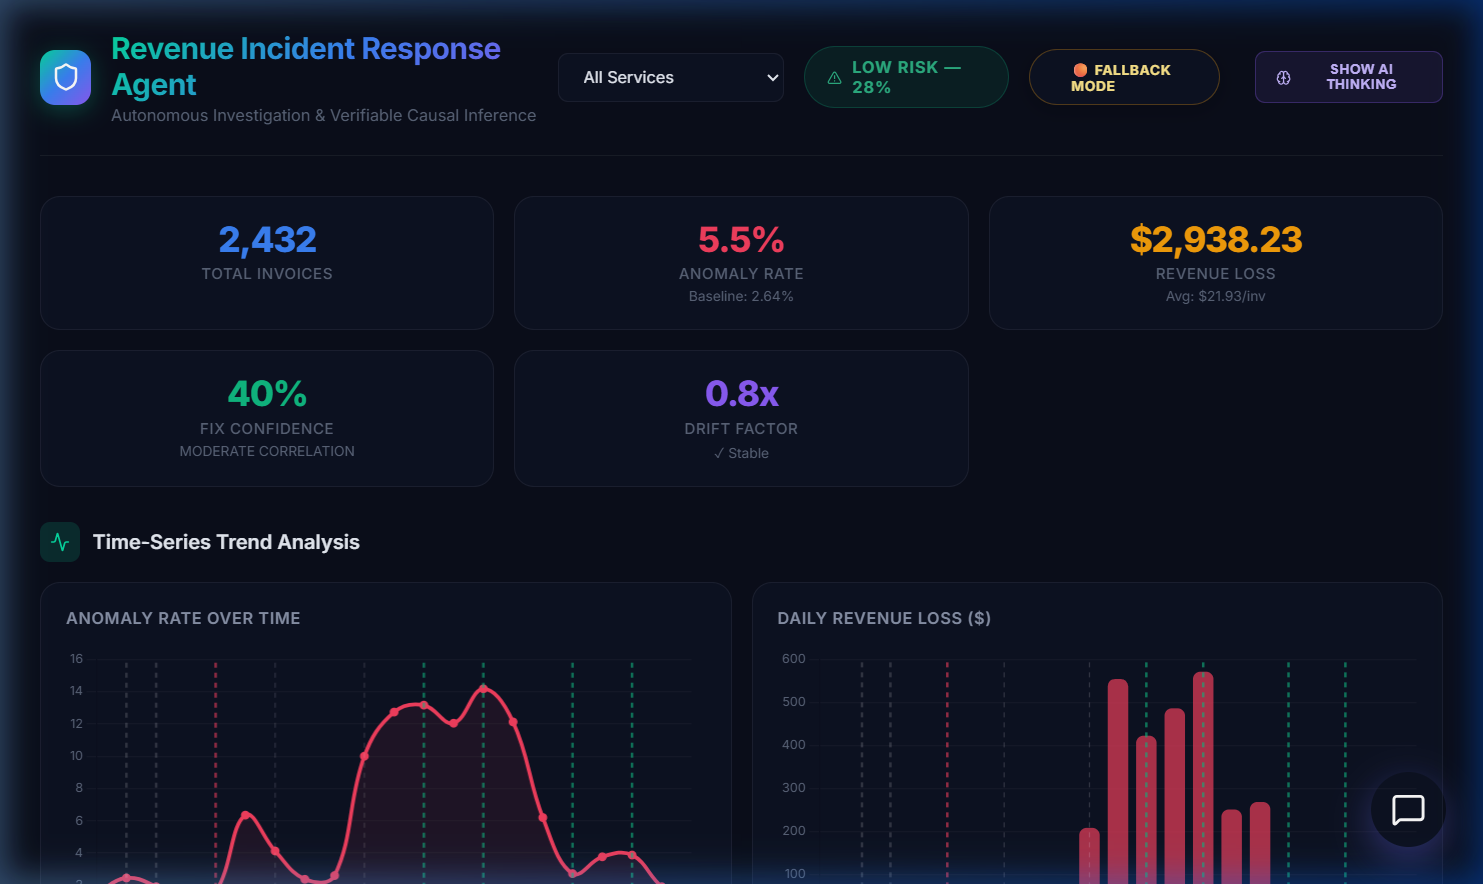
Executive Dashboard — Real-time KPI monitoring with anomaly rate, revenue loss, confidence scoring, and drift analysi
-
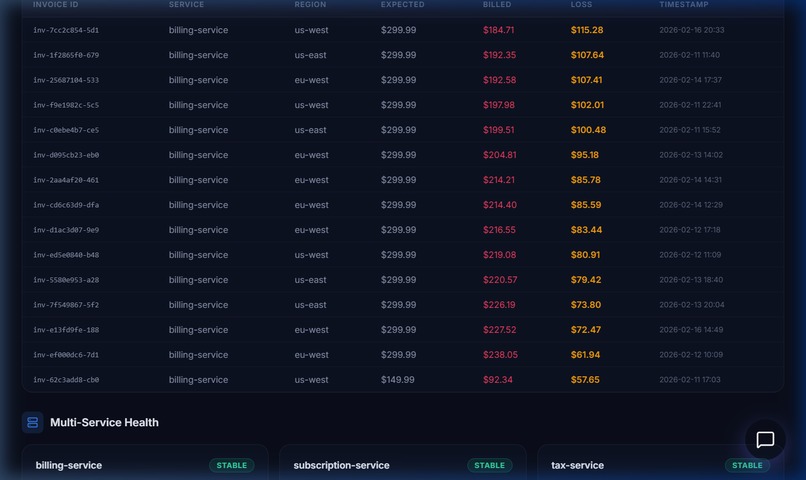
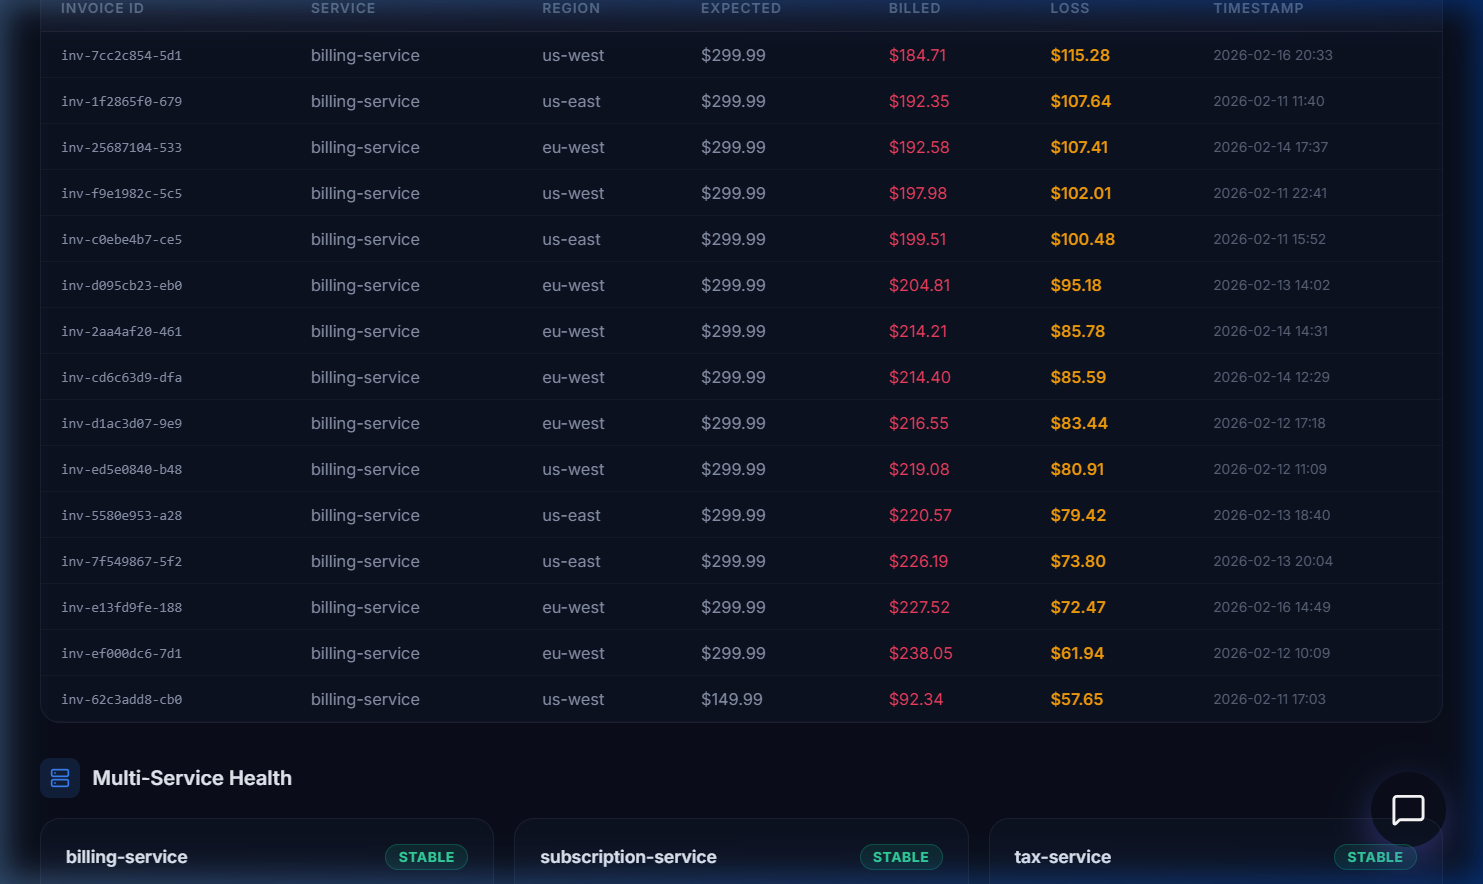
Underbilled invoice forensics with multi-service health monitoring
-
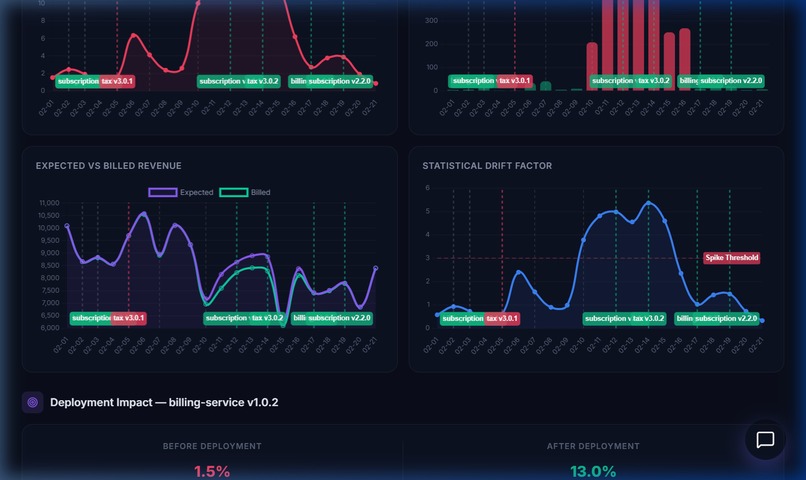
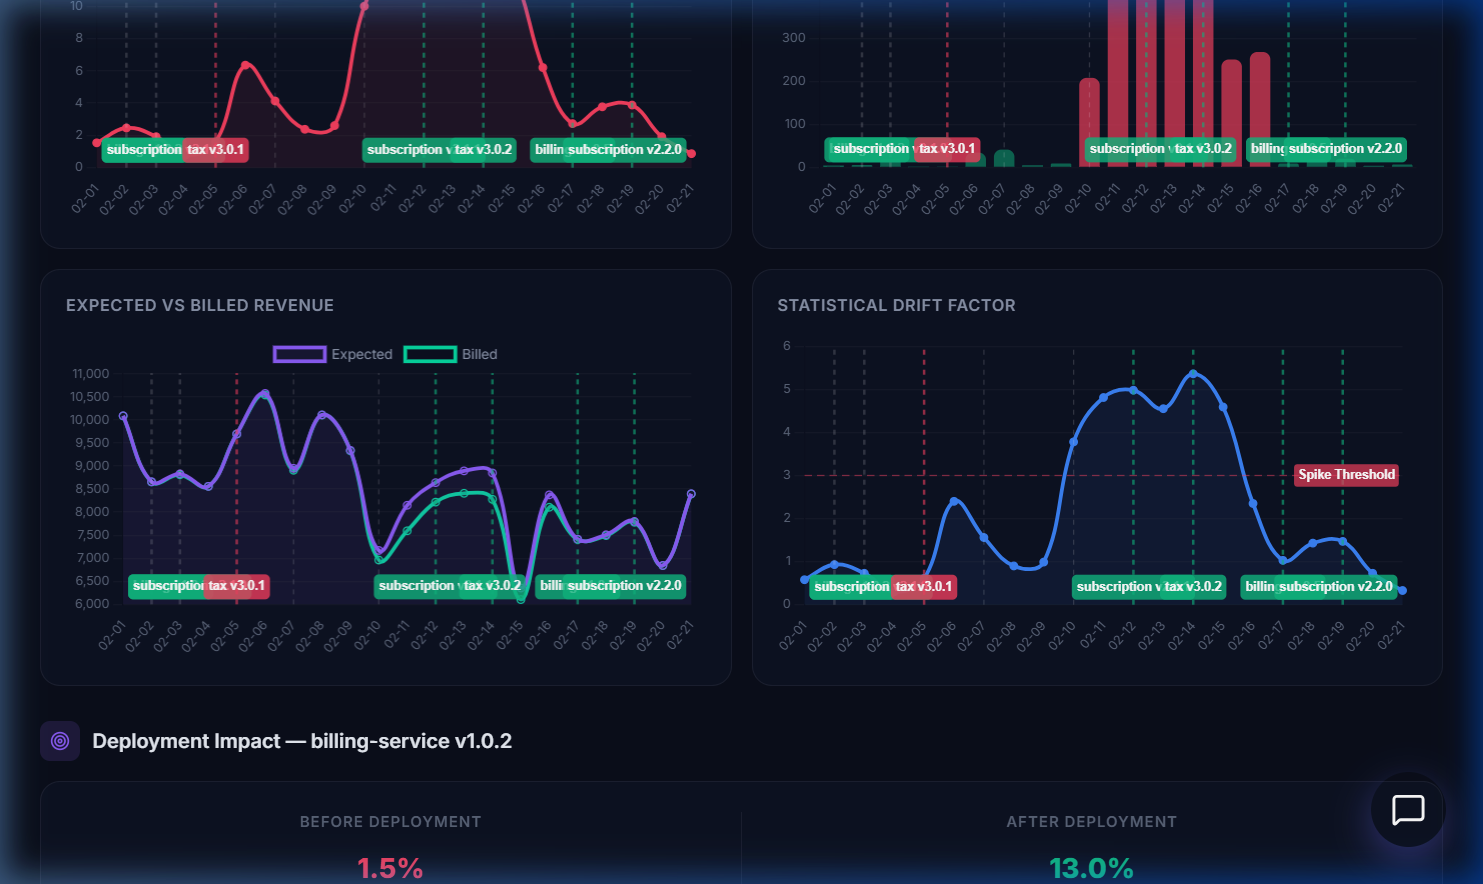
Revenue & Drift Intelligence — Expected vs Billed revenue timeline with deployment markers and statistical drift factor analysis
Inspiration
Revenue loss rarely announces itself through catastrophic failure.
More often, it begins quietly — through unnoticed transaction drops, minor deployment side effects, or subtle user disengagement.
By the time leadership recognizes the decline, the damage has already compounded.
Modern organizations are highly capable of monitoring system health. Yet very few can understand how small technical deviations silently translate into financial impact.
Engineering teams observe anomalies. Finance teams observe declining numbers. No system connects the two in time to act.
This disconnect inspired the Revenue Incident Response Agent — an autonomous intelligence layer designed to bridge operational signals with business reality.
The motivation was simple:
Detect risk before it becomes loss.
What it does
The Revenue Incident Response Agent continuously monitors operational, transactional, and behavioral signals to identify early indicators of revenue instability.
It goes beyond alerting.
The agent:
- Detects anomalies across real-time data streams
- Investigates deployment timelines and system drift
- Correlates transaction instability with churn indicators
- Estimates potential revenue exposure through multi-horizon projections
- Produces explainable, decision-ready insights via a real-time executive dashboard
Rather than requiring teams to manually interpret fragmented dashboards, the agent autonomously determines whether a signal represents technical noise or meaningful business risk.
A mathematically grounded confidence score is generated using:
$$ C = (W_s \cdot S + W_t \cdot T + W_d \cdot D + W_h \cdot H) \times 100 $$
Where:
- \( S \) = Signal strength
- \( T \) = Temporal alignment
- \( D \) = Cross-signal validation
- \( H \) = Historical deviation
This transforms raw anomalies into interpretable business risk.
How we built it
The system uses Elasticsearch as its intelligence backbone, indexing invoices, transactions, deployments, and churn indicators in real time.
Instead of isolated monitoring, the agent follows a structured six-stage reasoning workflow:
Detect → Investigate → Correlate Transactions → Correlate Churn → Quantify Impact → Decide
Custom analytical tools evaluate:
- Anomaly metrics
- Deployment history
- Failure patterns
- Behavioral churn signals
- Forecasted revenue impact
Tech Stack
- Elasticsearch 8.x — Real-time anomaly detection & aggregation
- Node.js + Express — Agent orchestration
- React 19 + Vite — Executive decision dashboard
- Custom Intelligence Engines — Z-score drift detection, confidence scoring, composite risk modeling
The result is not just awareness — but causal understanding.
Challenges we ran into
The hardest challenge was distinguishing between technical anomalies and financially meaningful incidents.
Not every failure leads to churn. Not every deployment leads to loss.
Capturing this nuance required temporal reasoning across multiple signal types.
We implemented rolling baseline drift detection:
$$ z = \frac{x - \mu}{\sigma} $$
Values exceeding \( z > 3.0 \) initiate investigation — but conclusions are only drawn after correlating deployment timing and churn patterns.
Another key challenge was transparency.
The system needed to explain its conclusions, not merely predict them. Every investigation produces a complete reasoning trace that is auditable and understandable by non-technical stakeholders.
We also engineered a dual-mode architecture (Elasticsearch + JSON fallback) to ensure demo reliability across environments.
Accomplishments that we're proud of
We built a system that:
- Connects technical events directly to financial impact
- Autonomously investigates across 5,000+ invoice records
- Quantifies potential loss in monetary terms
- Produces fully explainable reasoning traces
- Completes a six-stage investigation in under 100ms
This shifts observability from a technical safeguard into a strategic business defense.
What we learned
We discovered that the real problem is not the lack of data — but the delay in understanding it.
Revenue loss rarely occurs because teams are negligent. It occurs because signals are buried inside systems no human can continuously interpret.
We learned that:
- Detection alone does not create value — interpretation does
- Speed without clarity does not enable action
- Automation should not replace human judgment — it should protect it
Most importantly:
Revenue incidents are not technical glitches.
They are moments of business vulnerability.
AI's true role is not just analysis — but protection.
What's next for Revenue Incident Response Agent
This project is the foundation of a broader vision.
Next, we aim to evolve the agent from a reactive responder into a predictive decision partner.
Future directions include:
- Predictive incident prevention through behavioral anomaly modeling
- Multi-source observability beyond Elasticsearch
- Business-context awareness (SLA impact, customer tier risk, financial scoring)
- Self-healing workflows enabling automated resolution
- Explainable reasoning to strengthen organizational trust
Our long-term vision is simple:
Revenue-critical systems should not merely be monitored — they should be actively protected.
So organizations do not discover loss after it happens,
but prevent it before it begins.

Log in or sign up for Devpost to join the conversation.