-
-

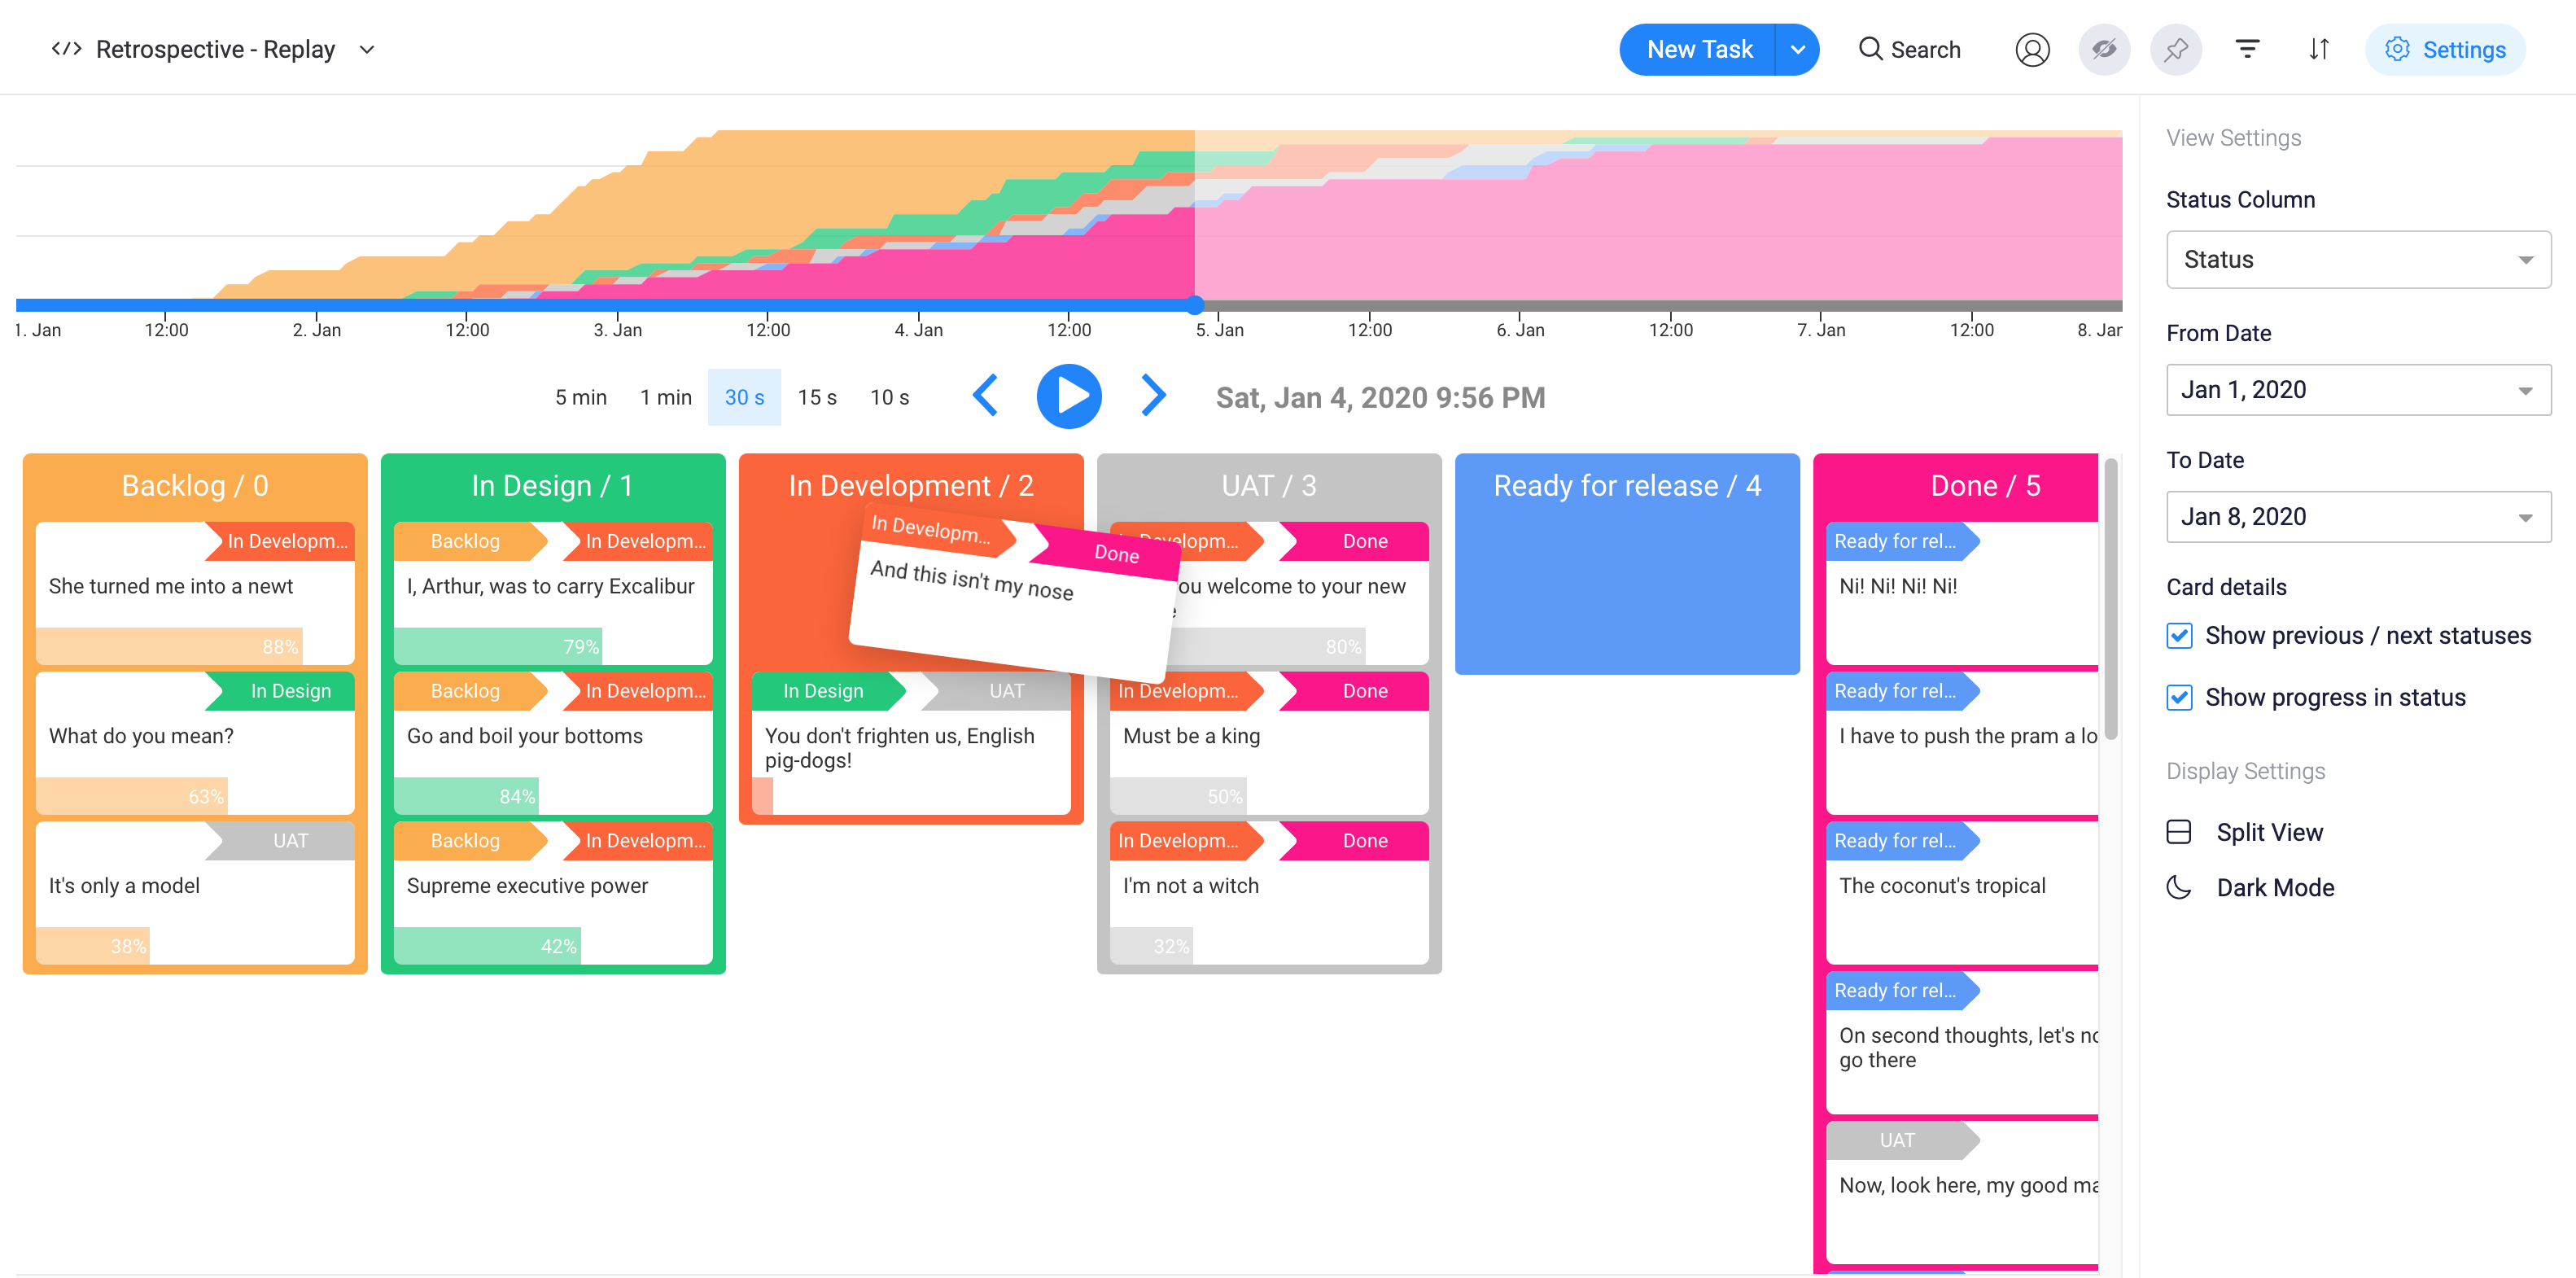
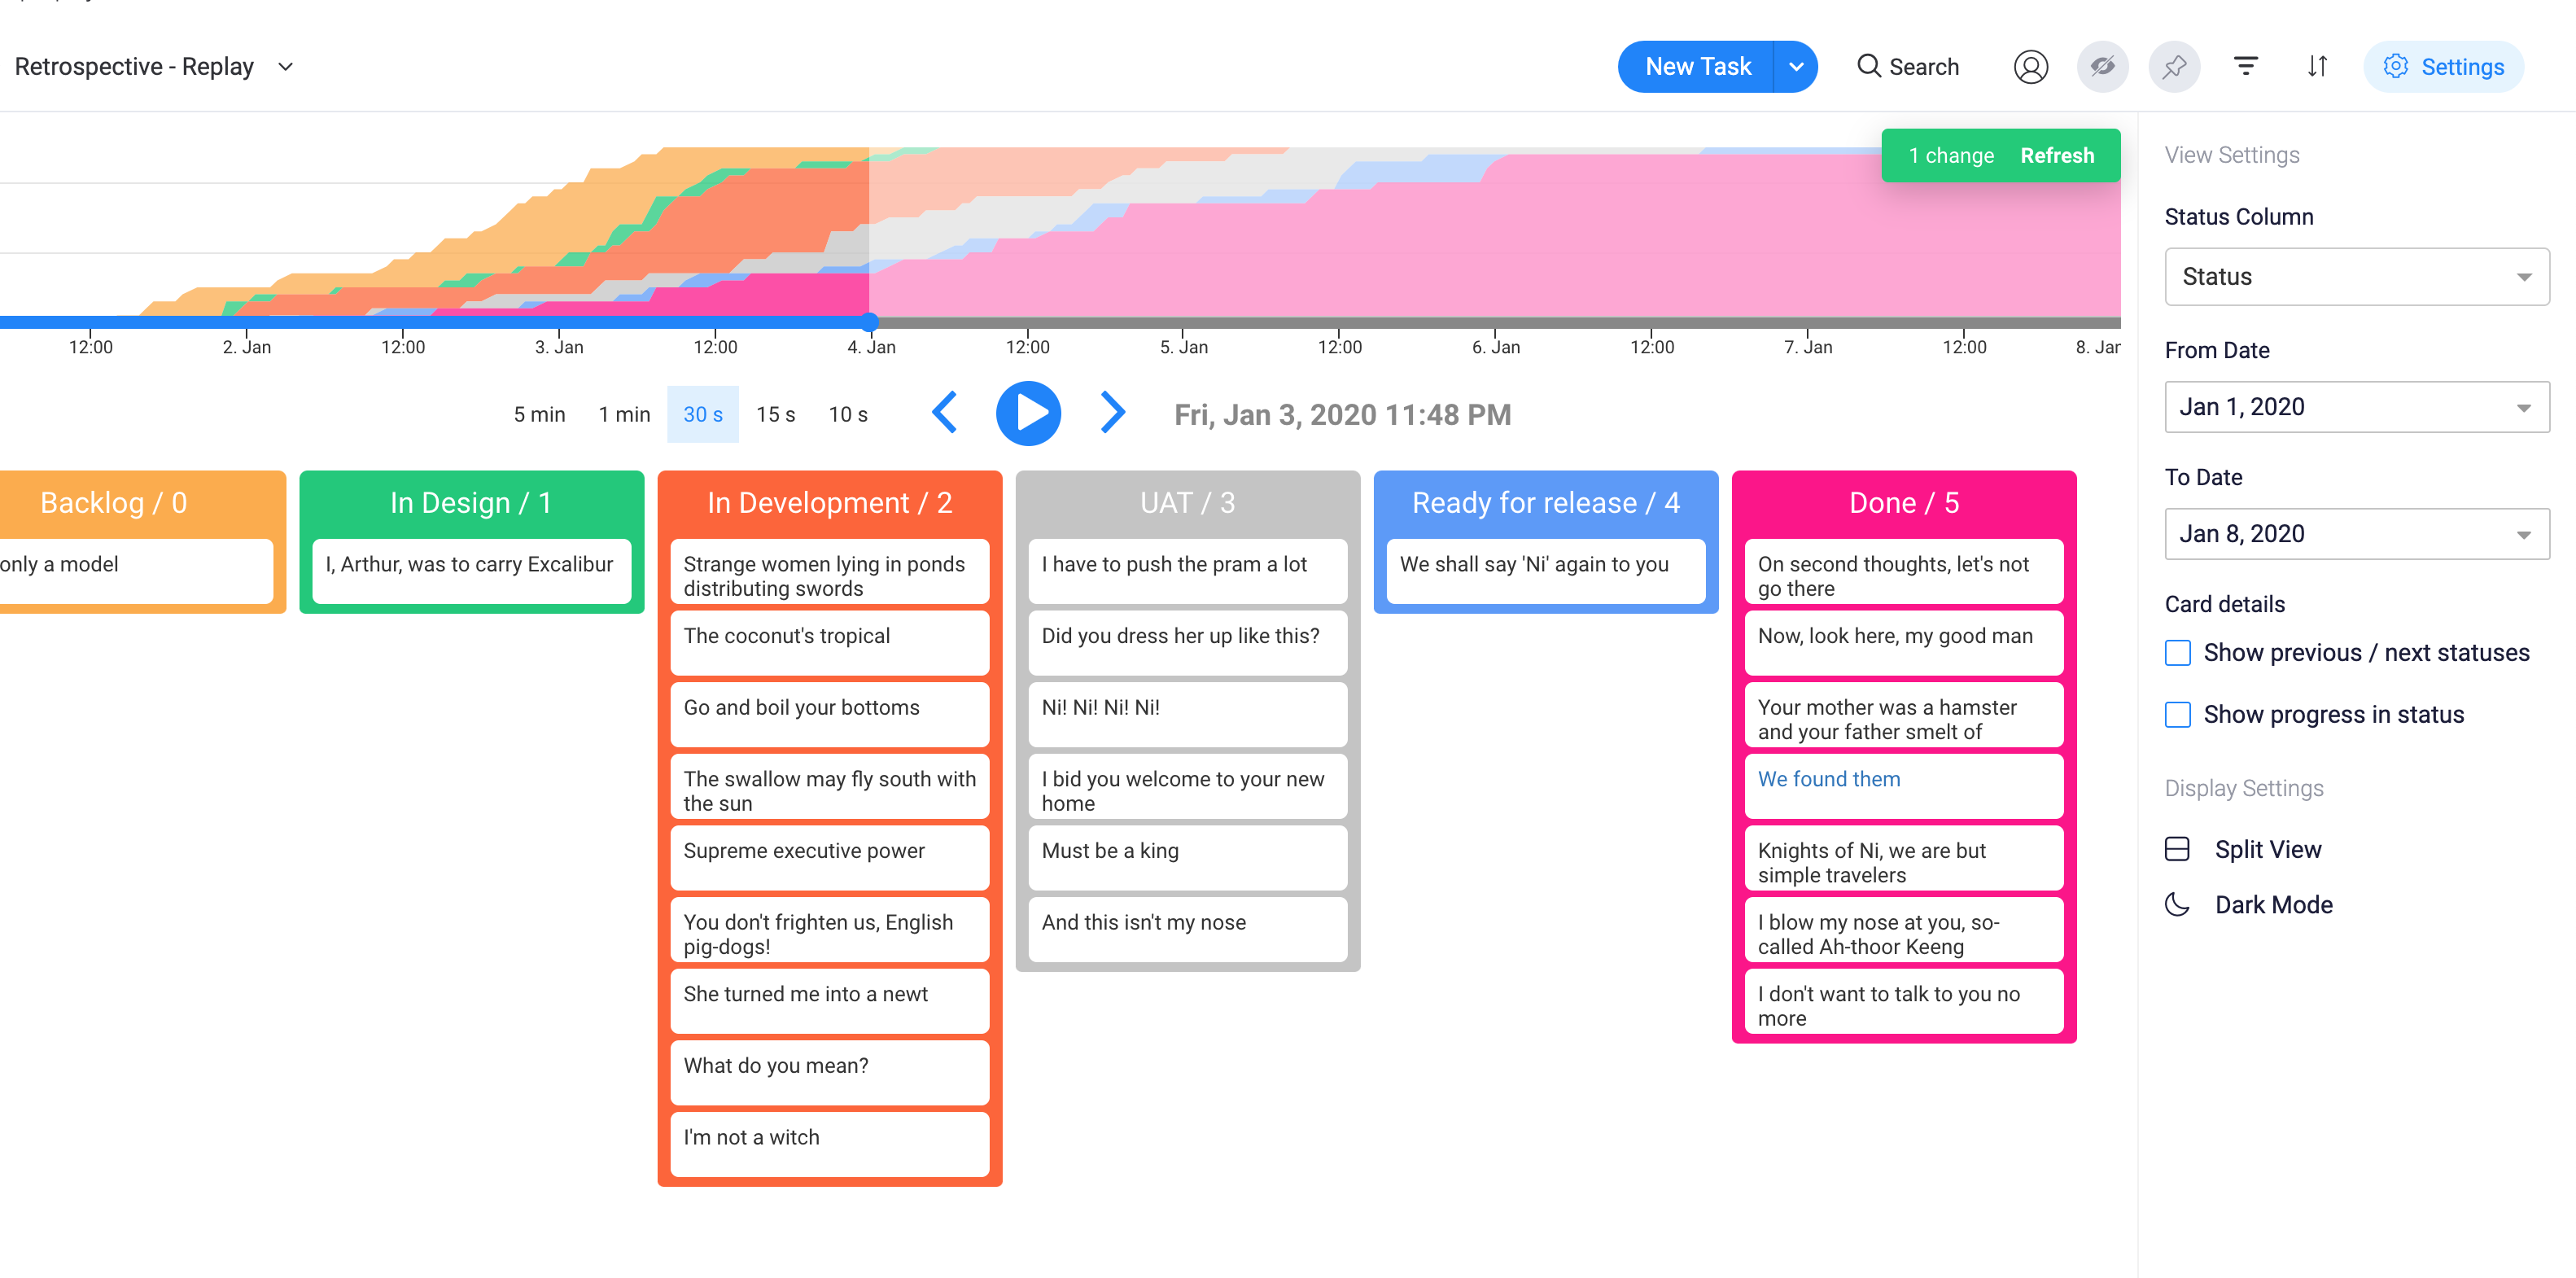
Retrospective Tools - Replay View - inspect and animate history of project
-

Retrospective Tools - Statistics View - see statistics and times in statuses for items / tasks
-

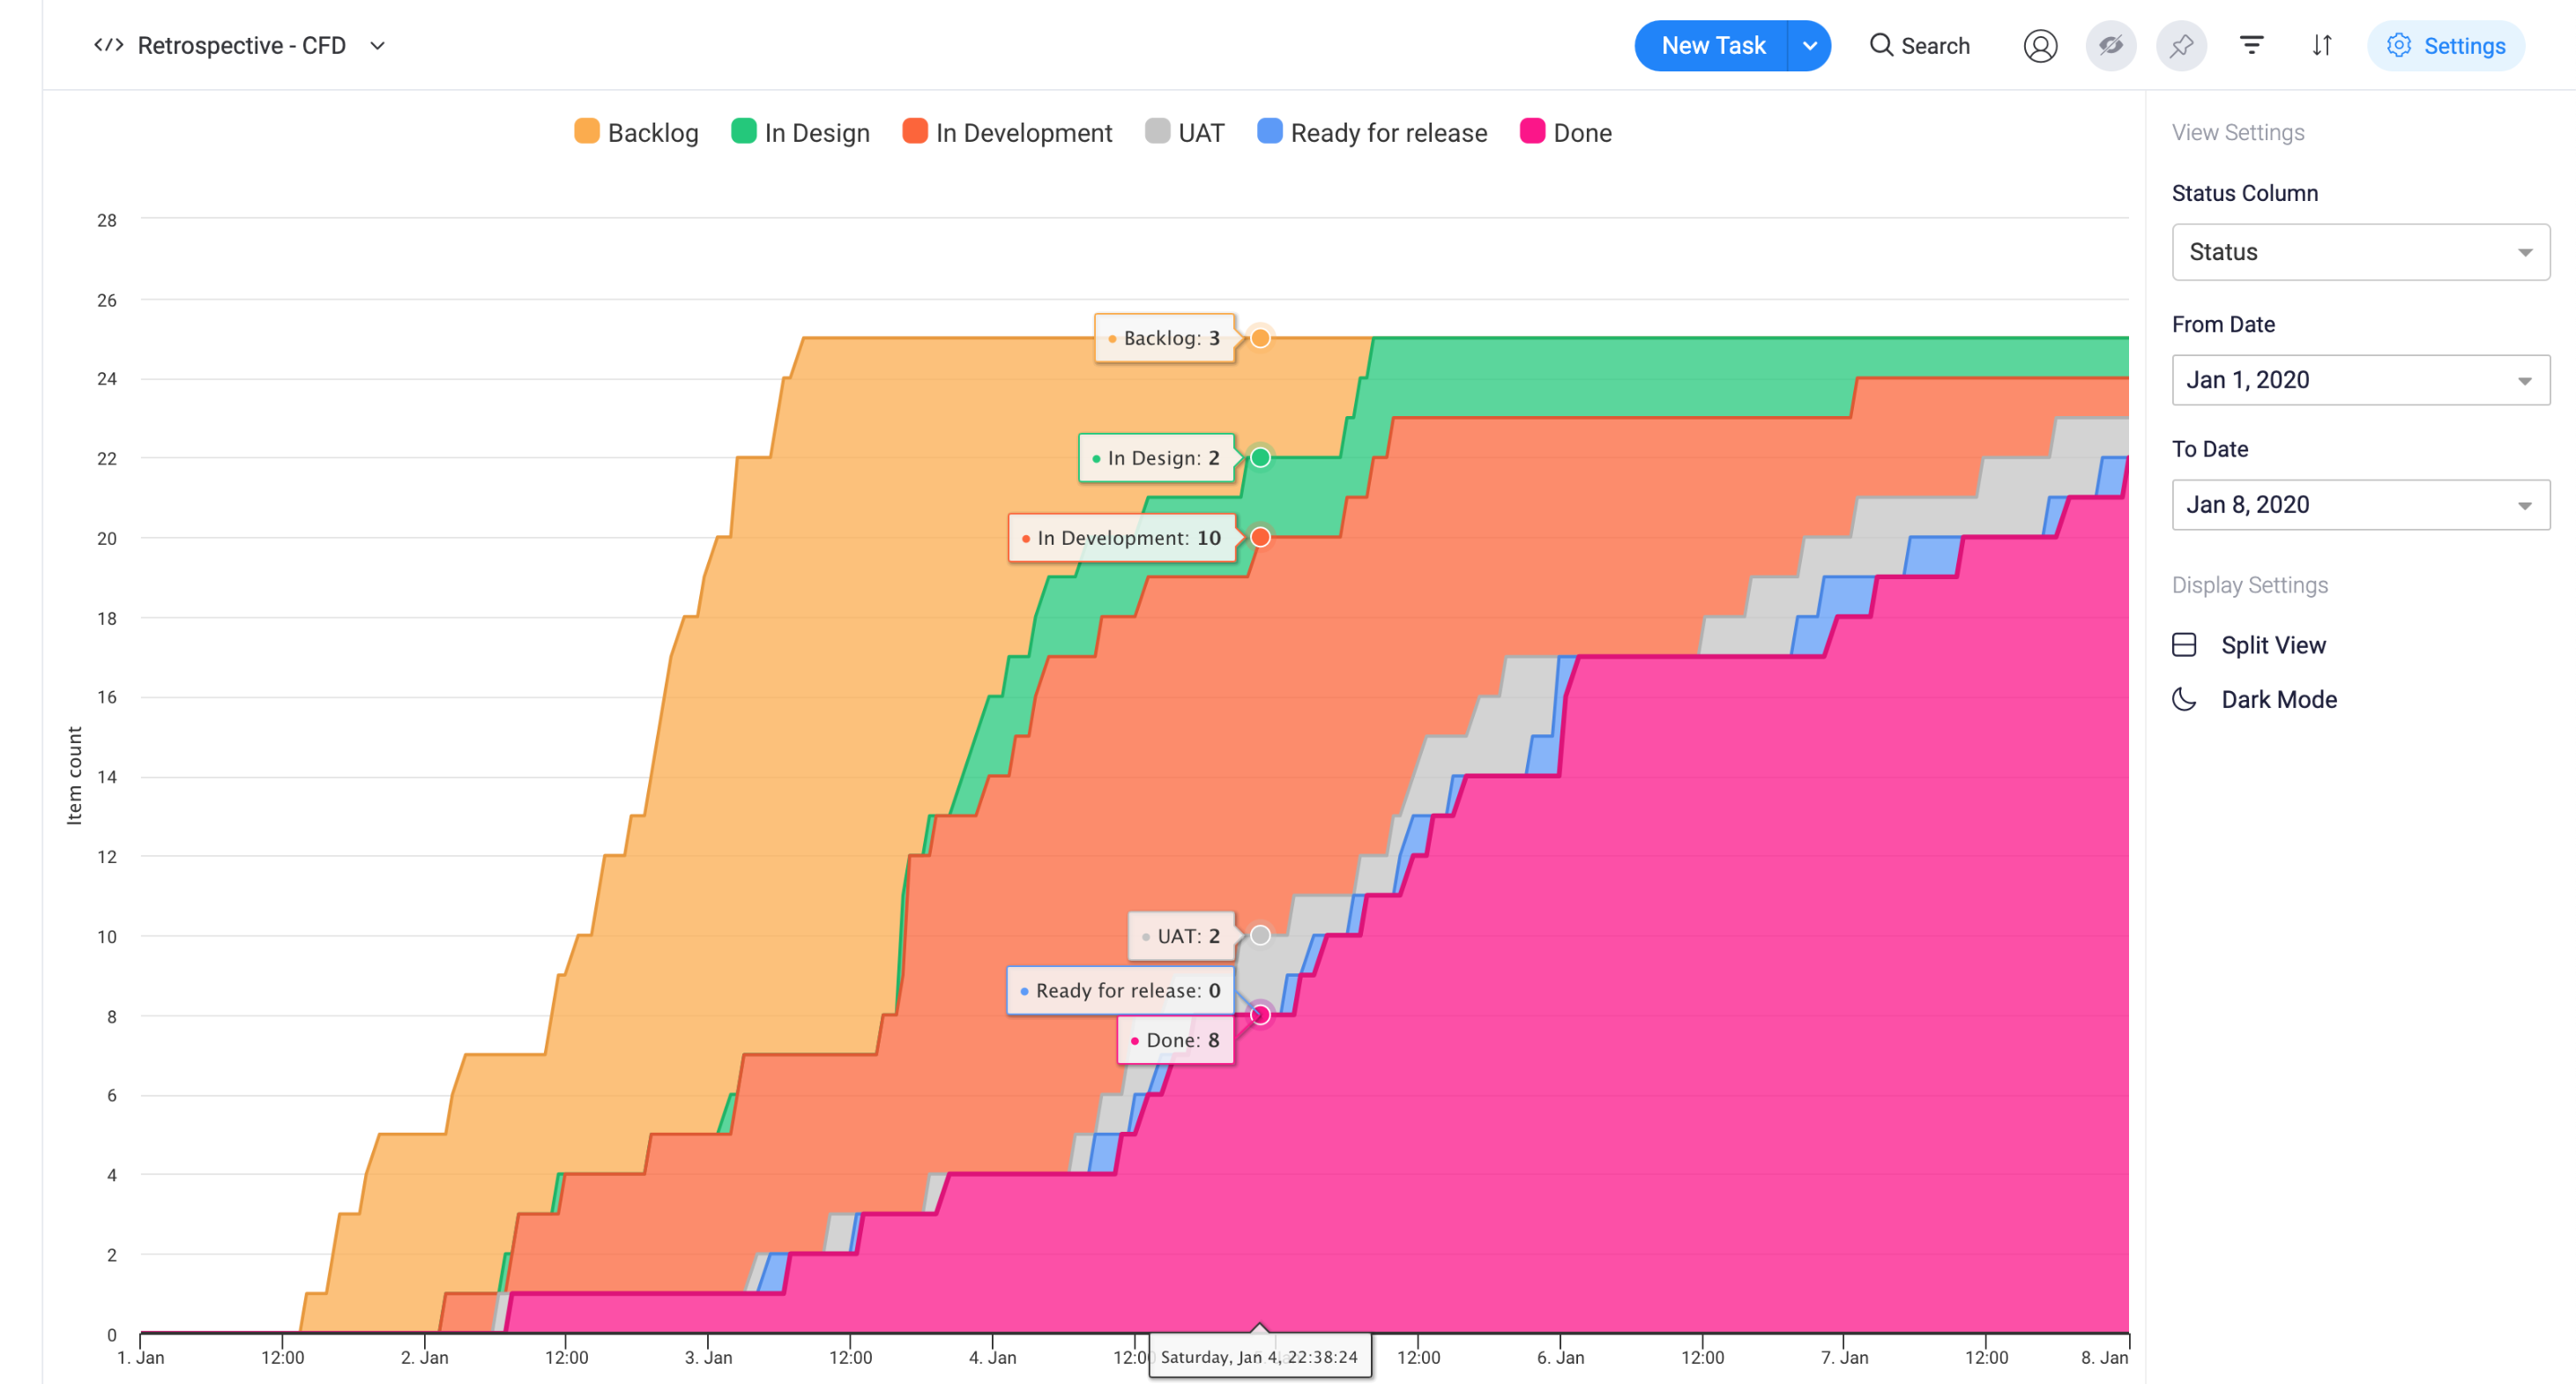
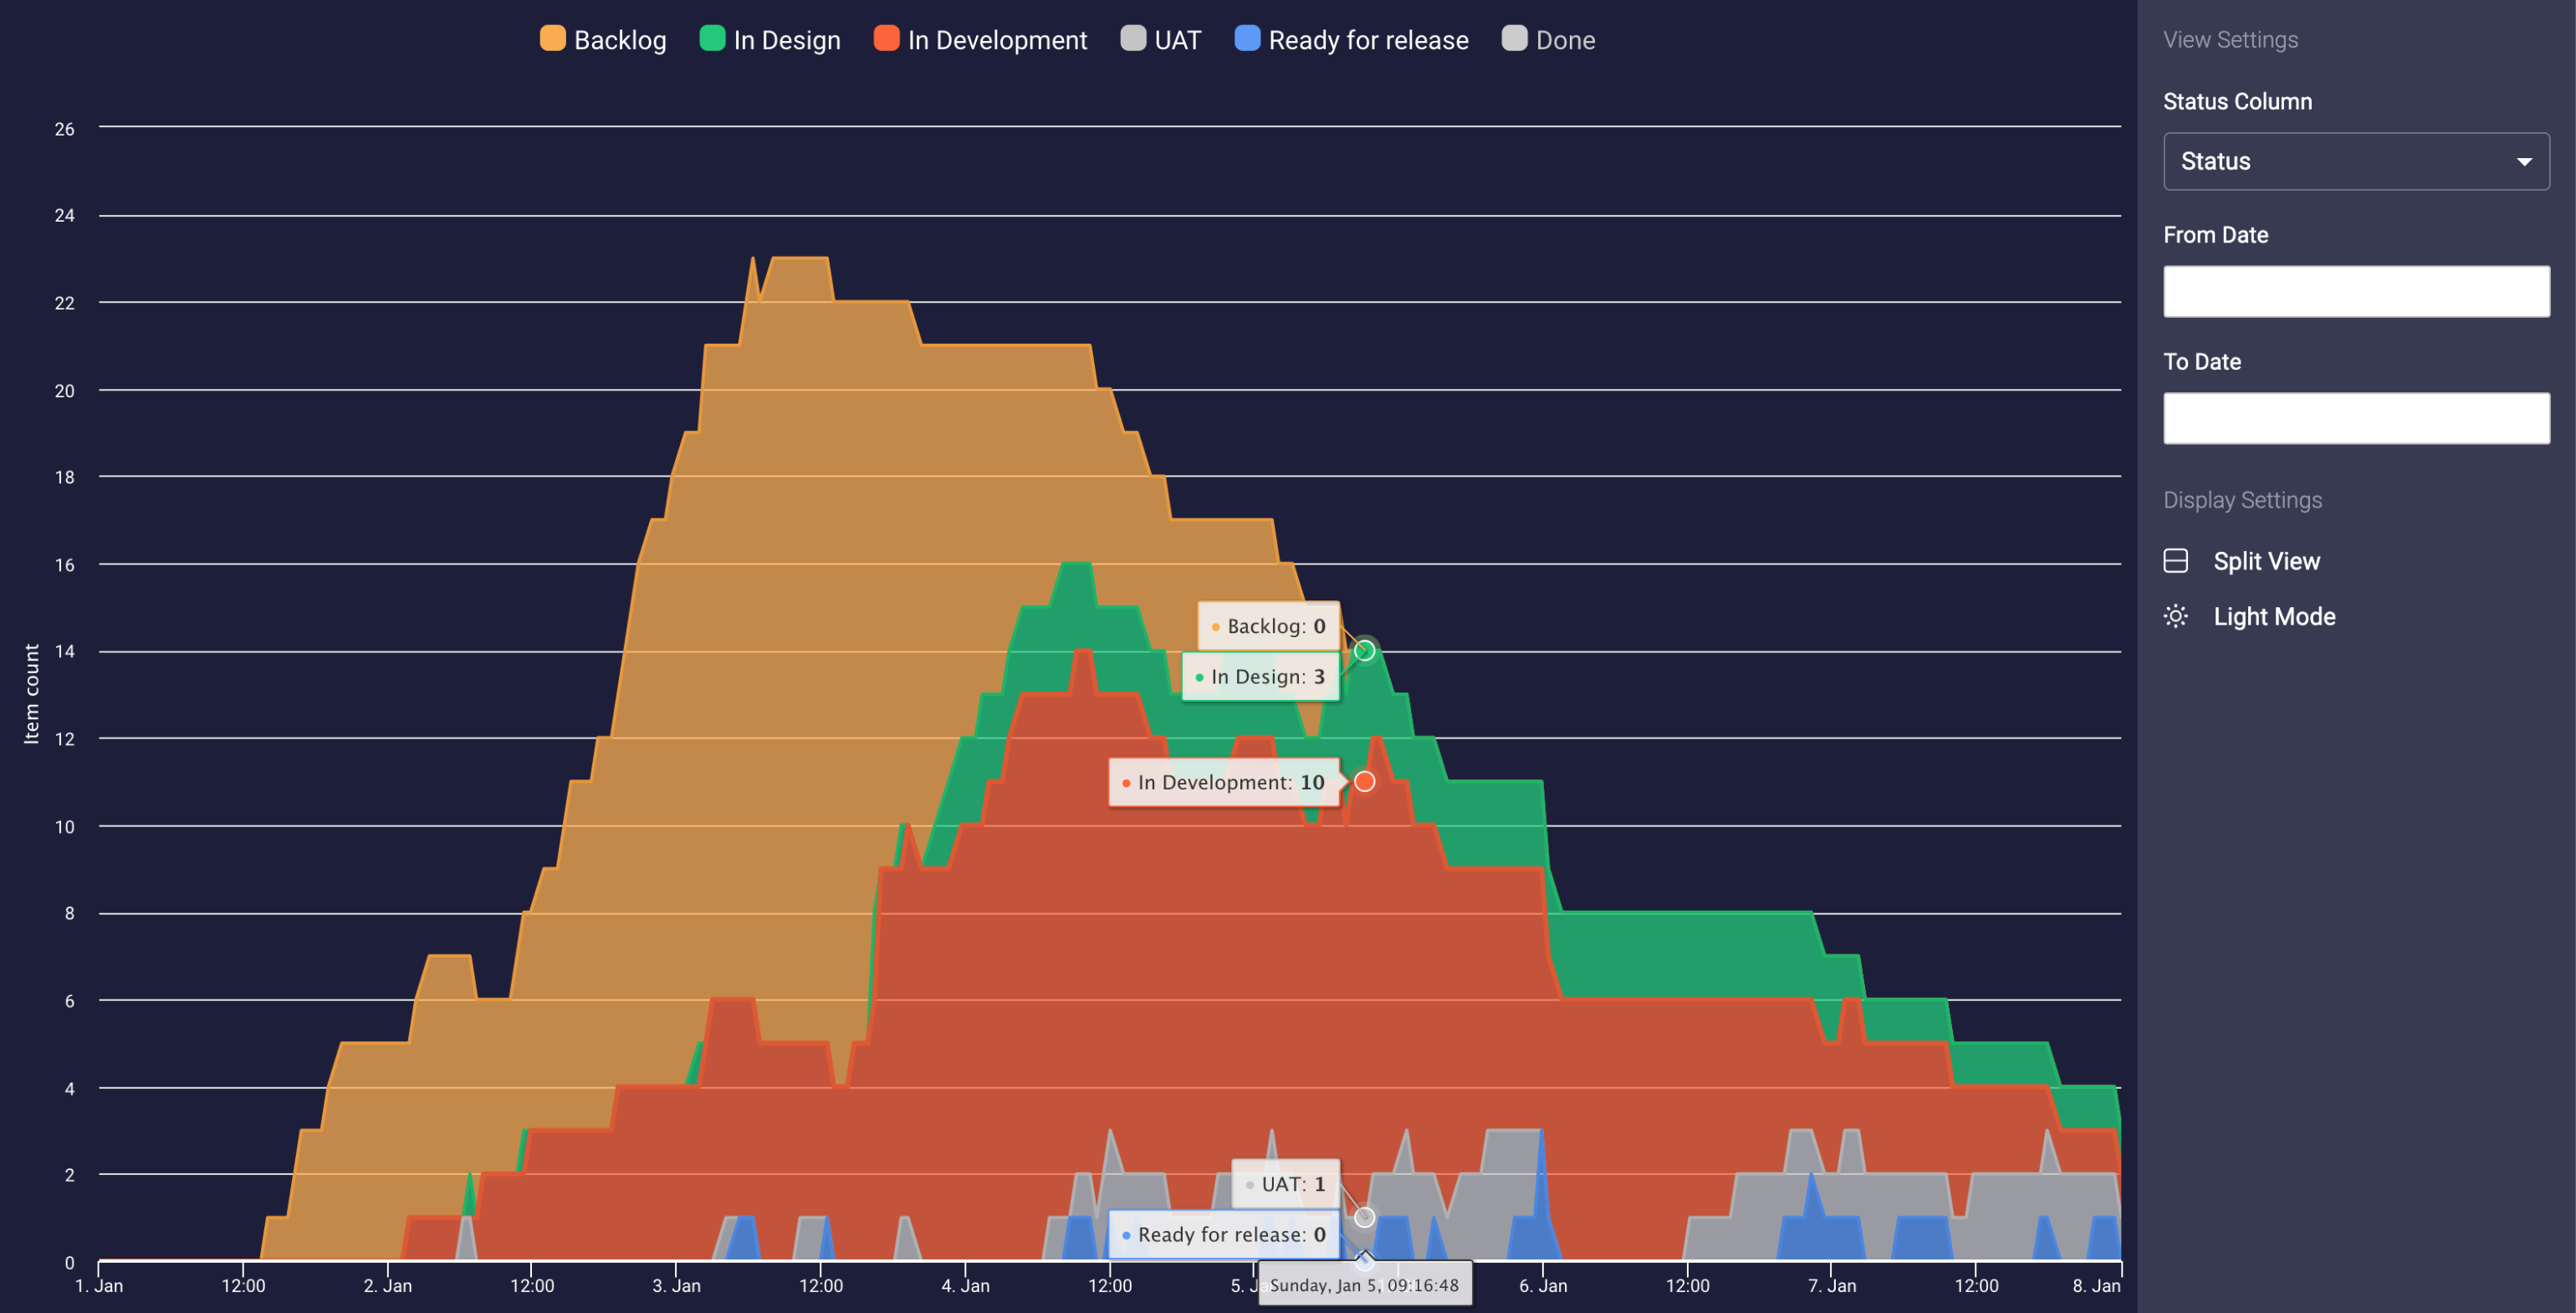
Retrospective Tools - Cumulative Flow Diagram
-

Retrospective Tools - Replay View - inspect and animate history of project
-

Retrospective Tools - Statistics View - see statistics and times in statuses for items / tasks
-

Retrospective Tools - Cumulative Flow Diagram
-

Retrospective Tools - Replay View - inspect and animate history of project
-

Retrospective Tools - Statistics View - see statistics and times in statuses for items / tasks


Inspiration
I take inspiration from my work as a Software Project Manager for companies like Shazam or Imagination Technologies and basically implement tools we were missing at the time which would help improve teams' performance, well being and output. I'm a big fan of simple, beautiful UIs and data driven project management and decision making.
What it does
Visualises progress of project in a way that is visually attractive (pretty graphs and animations) and easy to understand for both management and team members (e.g. engineers).
It's focused on software development since that's my background, but can be used in any project based on Kanban board or where tasks/items change statuses.
App consists of 3 views:
Replay - Animated Kanban board. Great conversation starter for Retrospective meetings. You investigate status of the board at any given moment in the past, progress by single event (Status change), or you can just turn the Play button on and watch how your project unfolded in animation.
Statistics - Calculates various time statistics for selected Statuses. This way you can e.g. check data for a single column (Status) on your Kanban board or see your Lead Times by selecting all the columns (Statuses). Shows average, median, 80th/90th percentiles, max, standard deviation etc. This view also lists tasks/items sorted by times spent in selected statuses, which is useful for identifying outliers.
Cumulative Flow Diagram - classic diagram, hugely useful diagram if you need to find and address bottlenecks in your process. Uses any Status field and from - to dates.
How I built it
I used Monday.com React boilerplate generator and took it from there. Project uses Typescript. I also use Rollbar for error monitoring, Snyk for dependency security checks.
Challenges I ran into
Understanding and using monday.com API. There are some undocumented features which I decided to use once the monday.com team confirmed they can be used. Namely,
columns.settings_strdata which contains some useful info about order of Statuses etc.Analysing activity logs in performant way. Activity logs are used to generate historical data which is then visualised as CFD, various statistics, and animated Kanban board.
Animation of Kanban board. It has proven to be challenging to animate changes to Statuses in a way which is performant and visually attractive. I had to strike the balance between the two and make sure browser resources are not strained. I used react-virtualized, dynamically generated CSS animation keyframes, efficient algorithms for processing activity log event and few other techniques to make the animation as smooth as possible.
Generation of example projects with large number of tasks changing statuses. I ended up creating project generator which simulates data returned from monday.com API.
Accomplishments that I'm proud of
- Kanban board animations. "Replay" view is the bit I'm most proud of in this product.
- I focused on usability and simplicity. I wanted to limit number of confusing View Settings.
- Keeping in line with original monday.com UX to make the experience of using Views in this application seamless for users.
What I learned
- monday.com API and GraphQL are cool. Haven't worked with GraphQL before.
- Some libraries I haven't used before, e.g. react-virtualized
- CSS Animations
What's next for Retrospective Tools
- getting feedback from end users and taking it from there
- optimisation (there wasn't enough time to do that unfortunately, but end product will definitely be speedier as there are some algorithms which could improved)


Log in or sign up for Devpost to join the conversation.