-
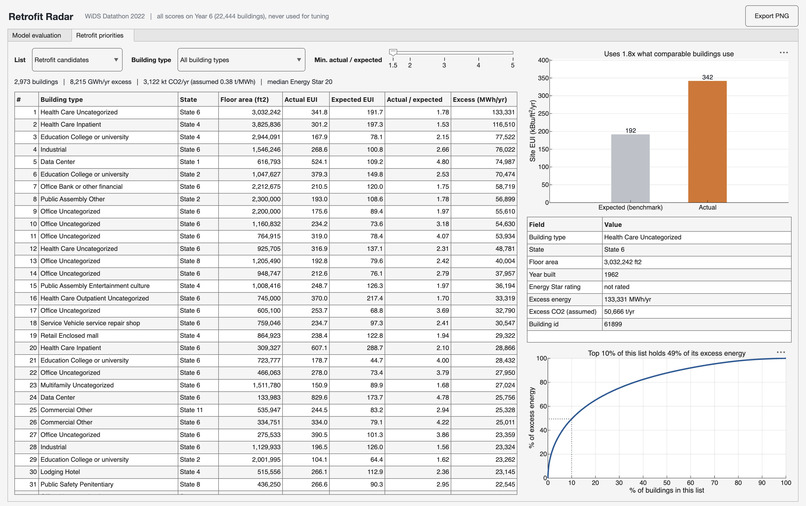
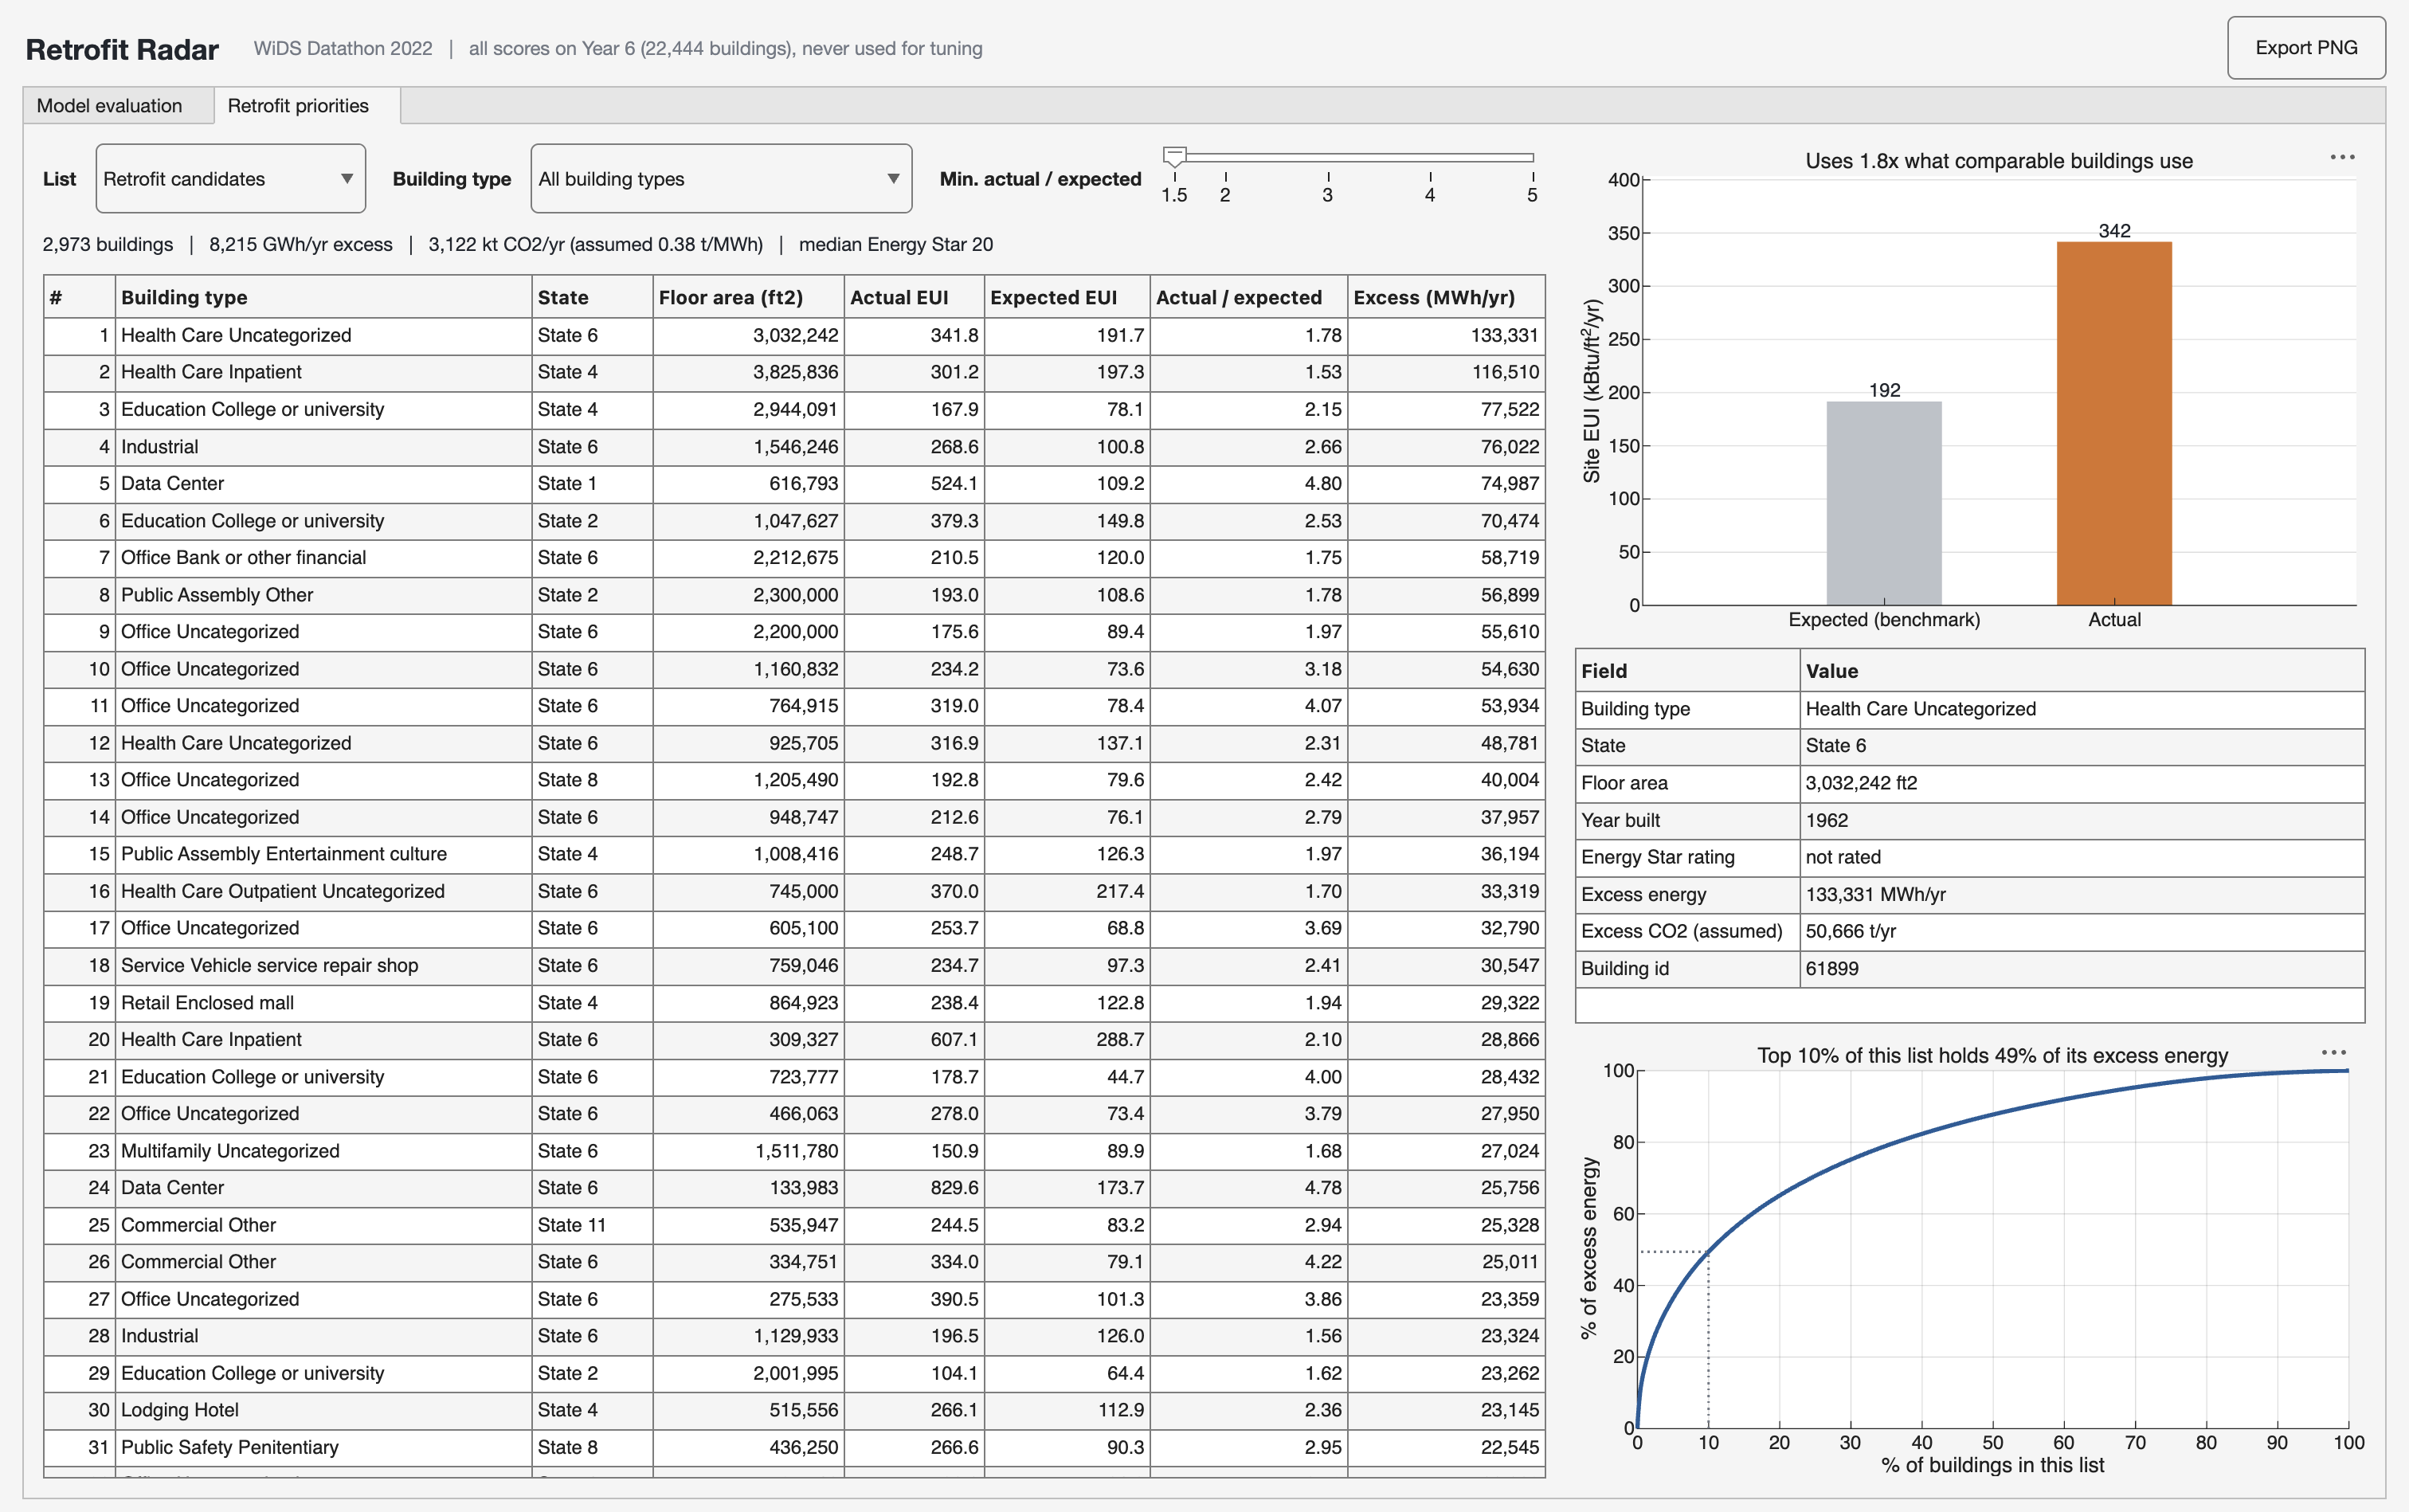
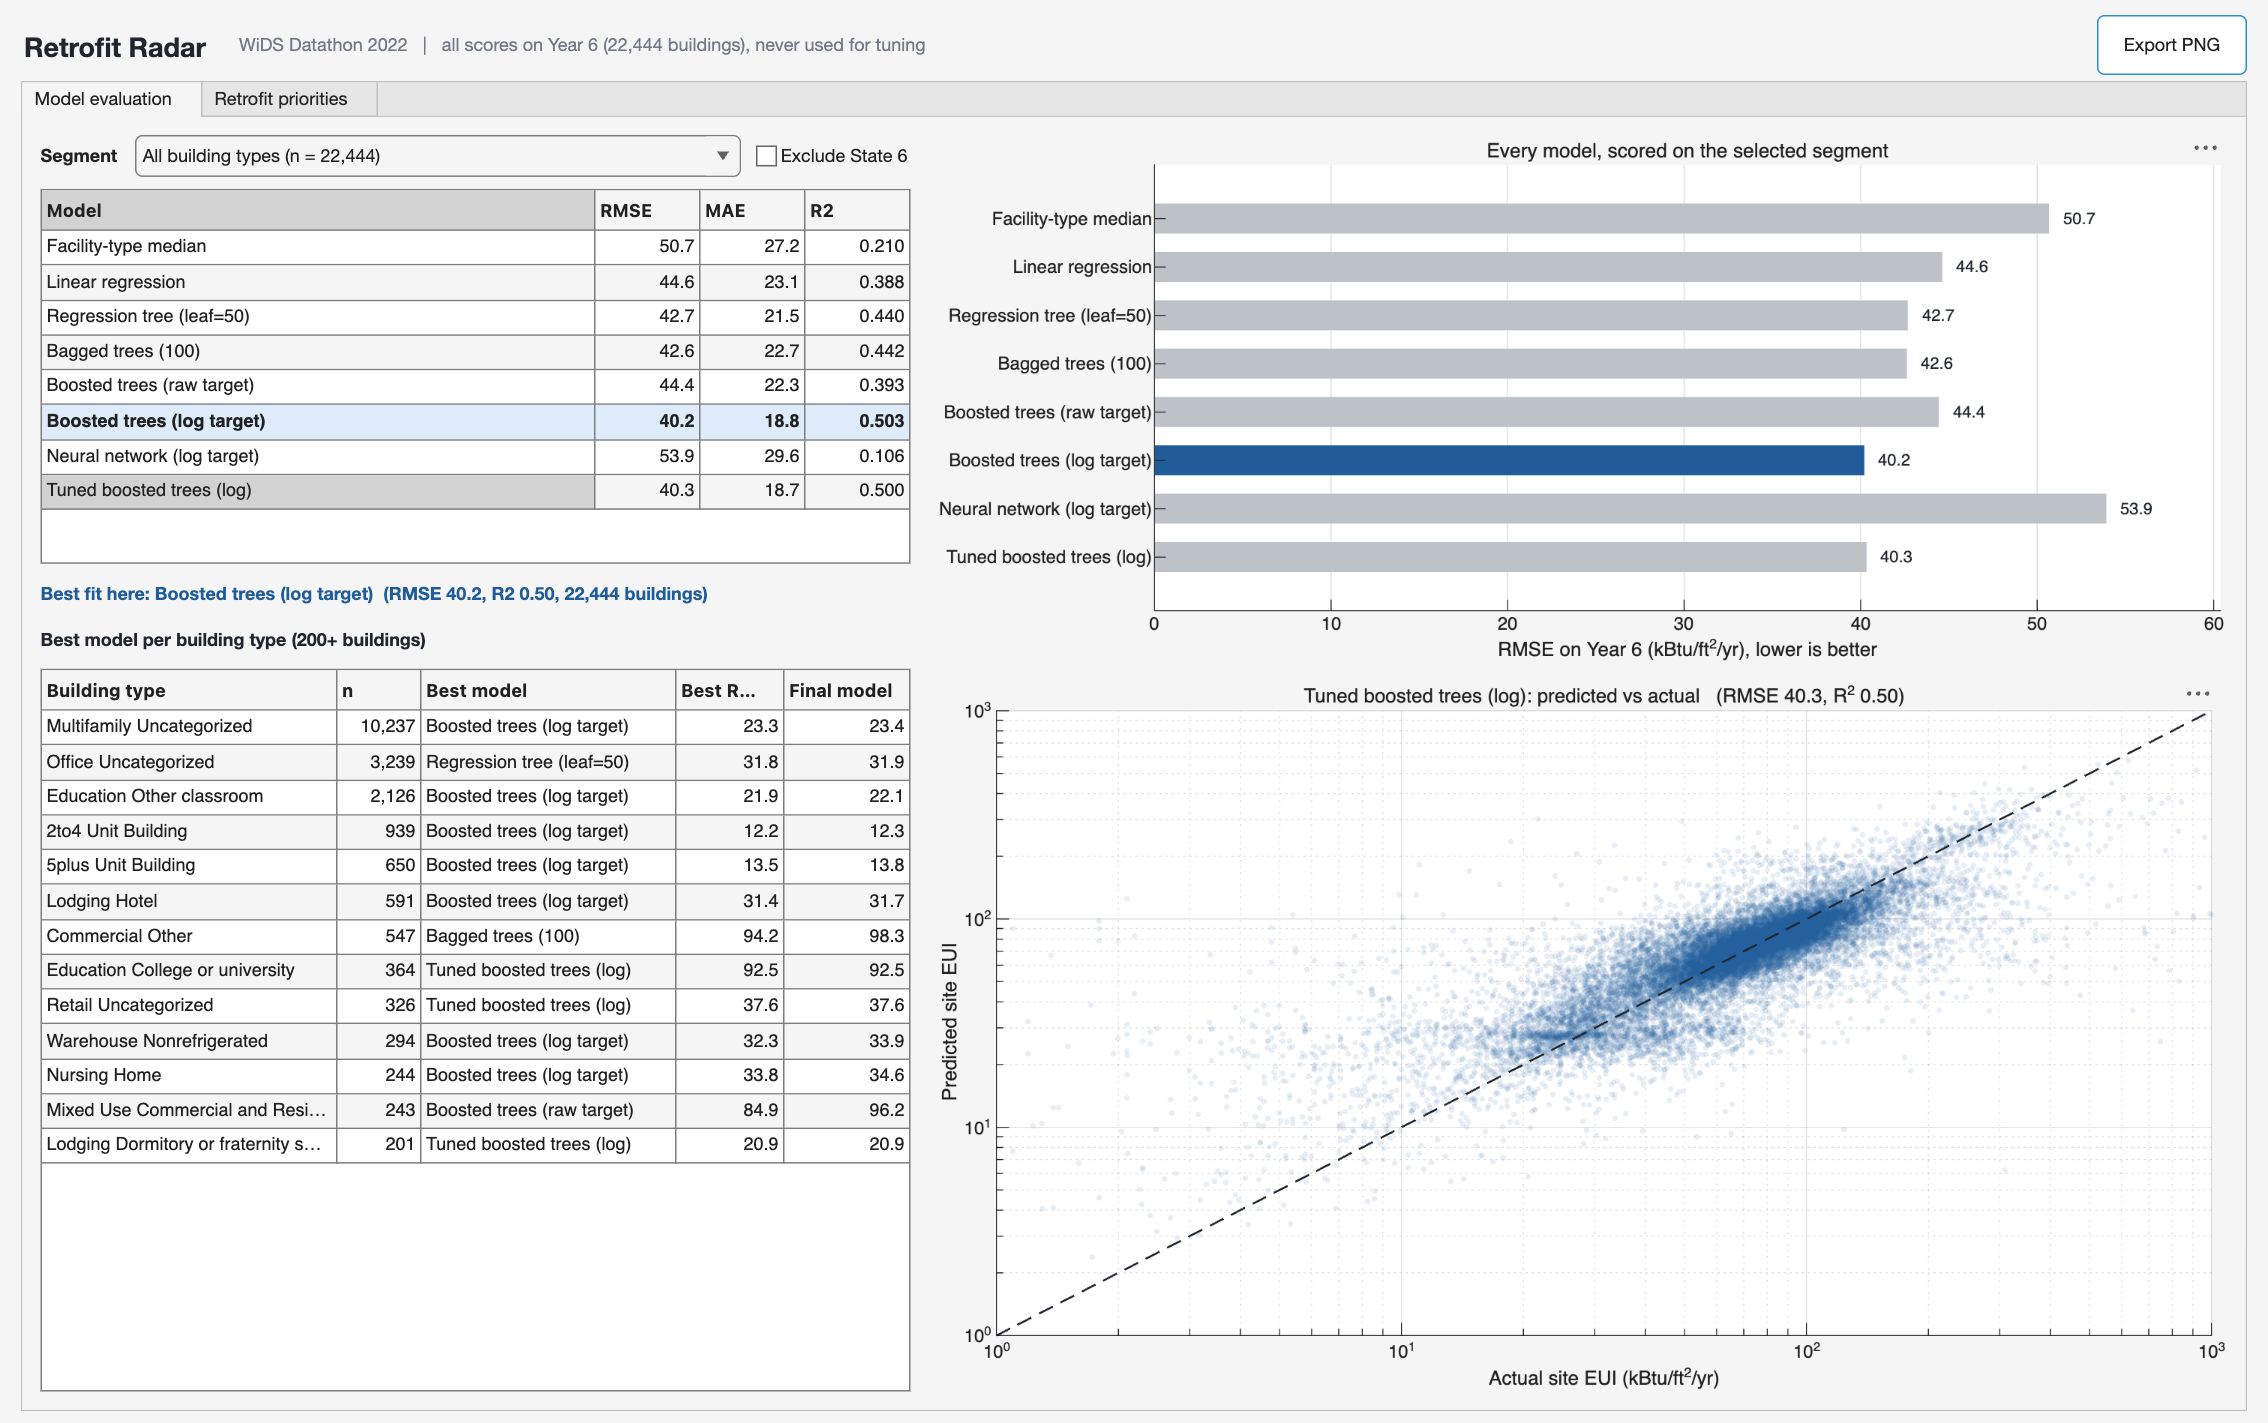
Retrofit Radar dashboard view page 2
-
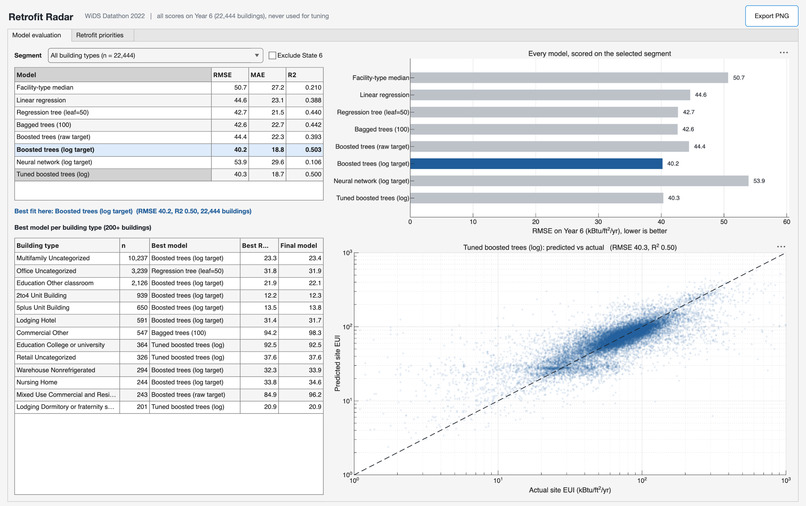
Retrofit Radar dashboard view page 1
-
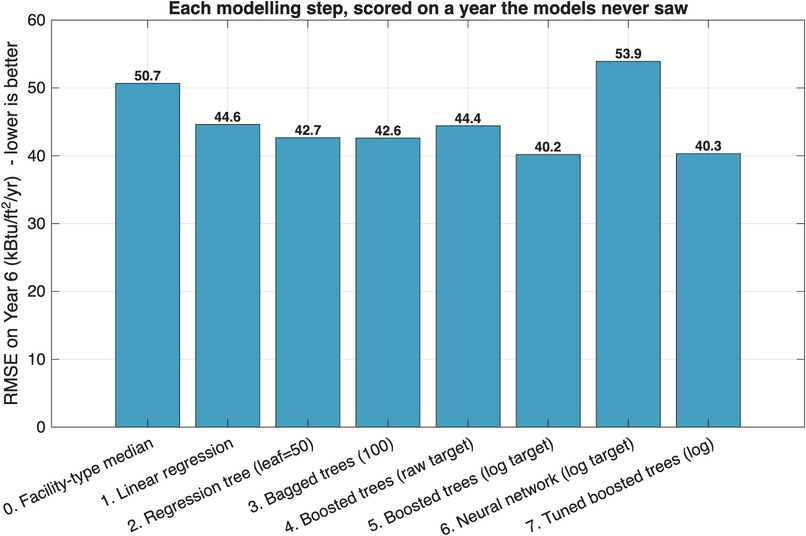
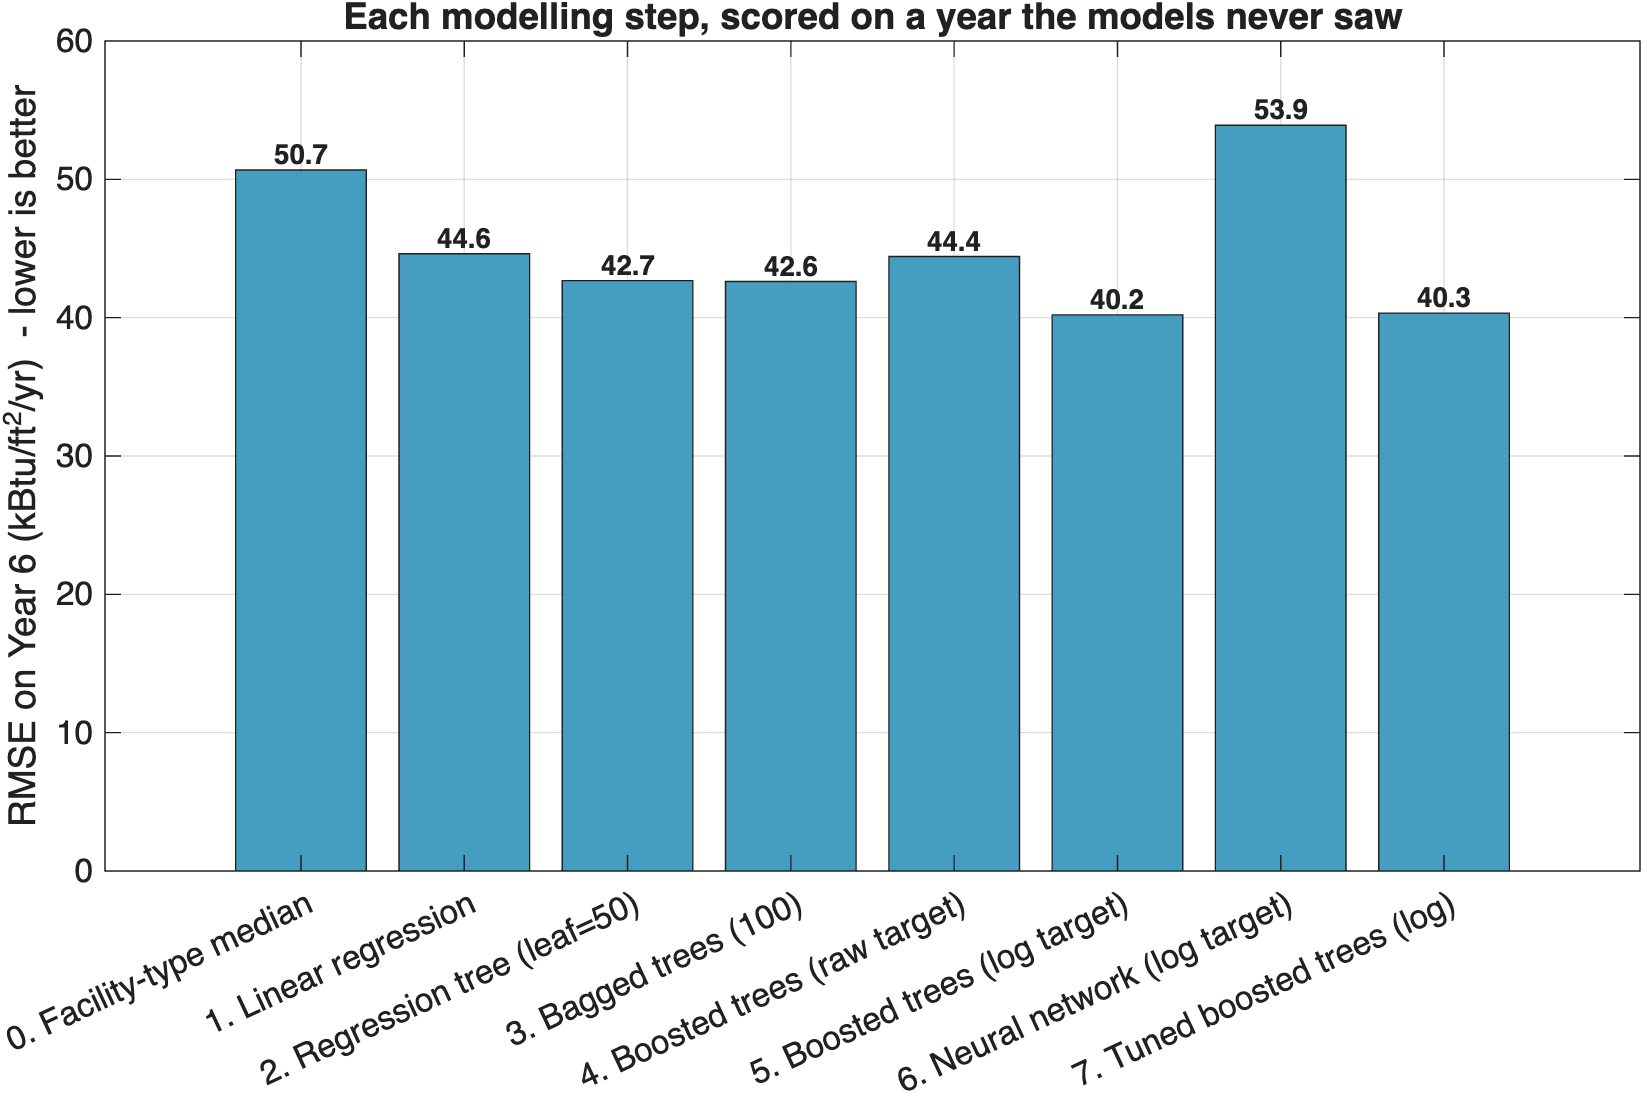
Comparison of the RMSE of each modelling step
-
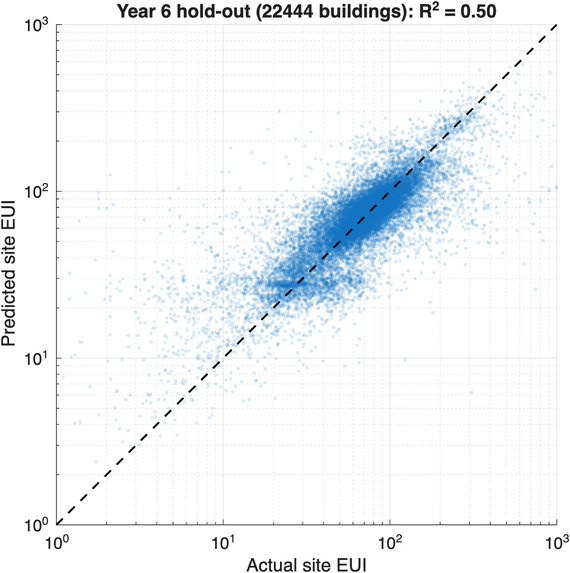
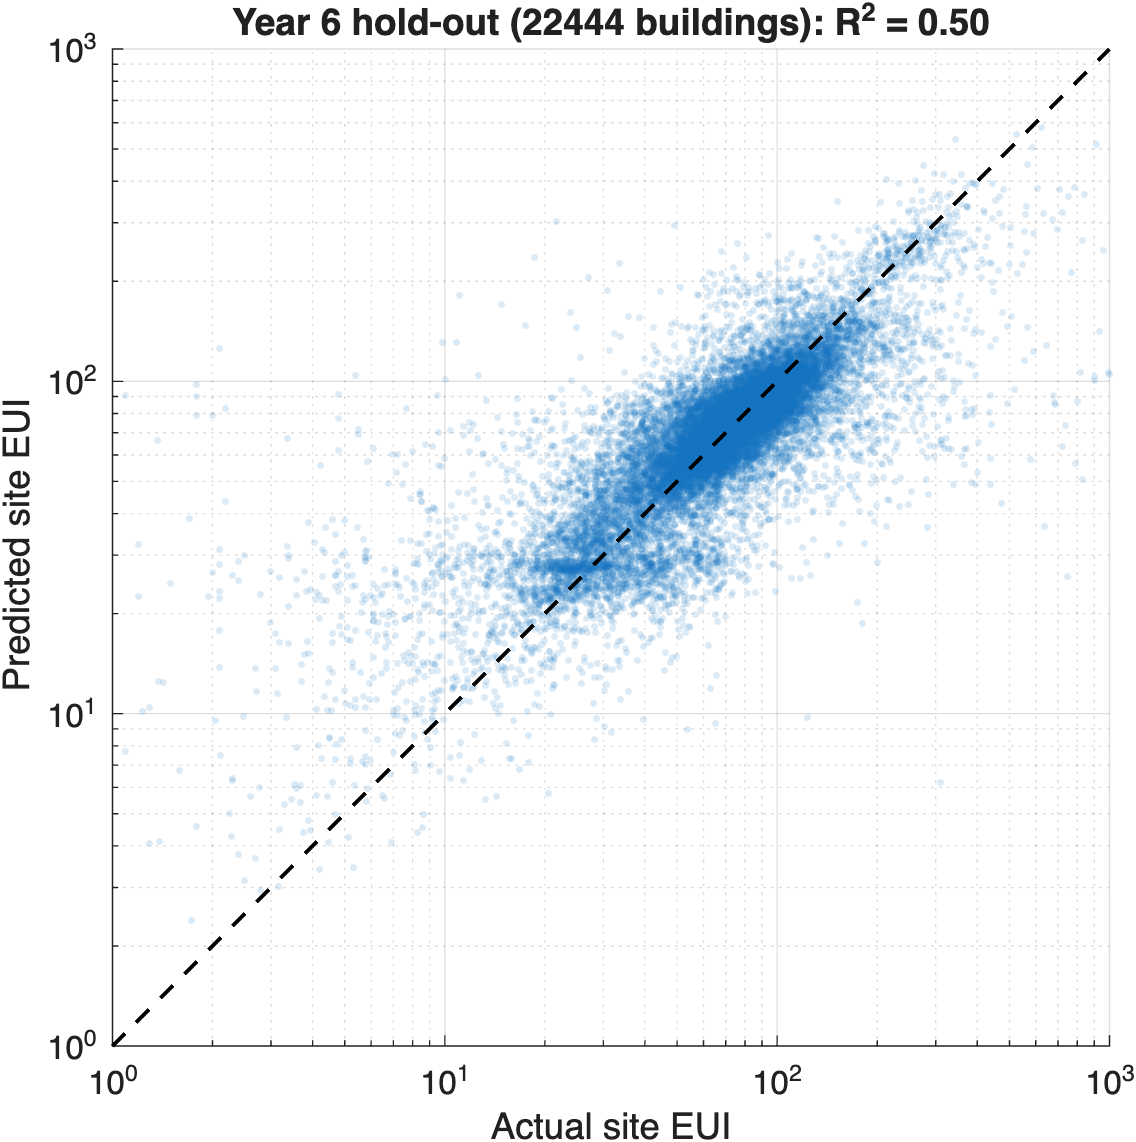
Actual vs predicted site EUI based on test data from Year 6
-
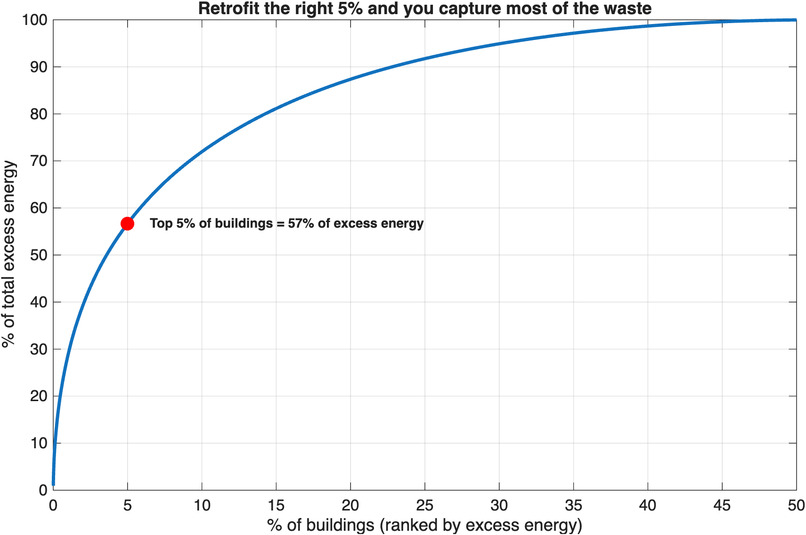
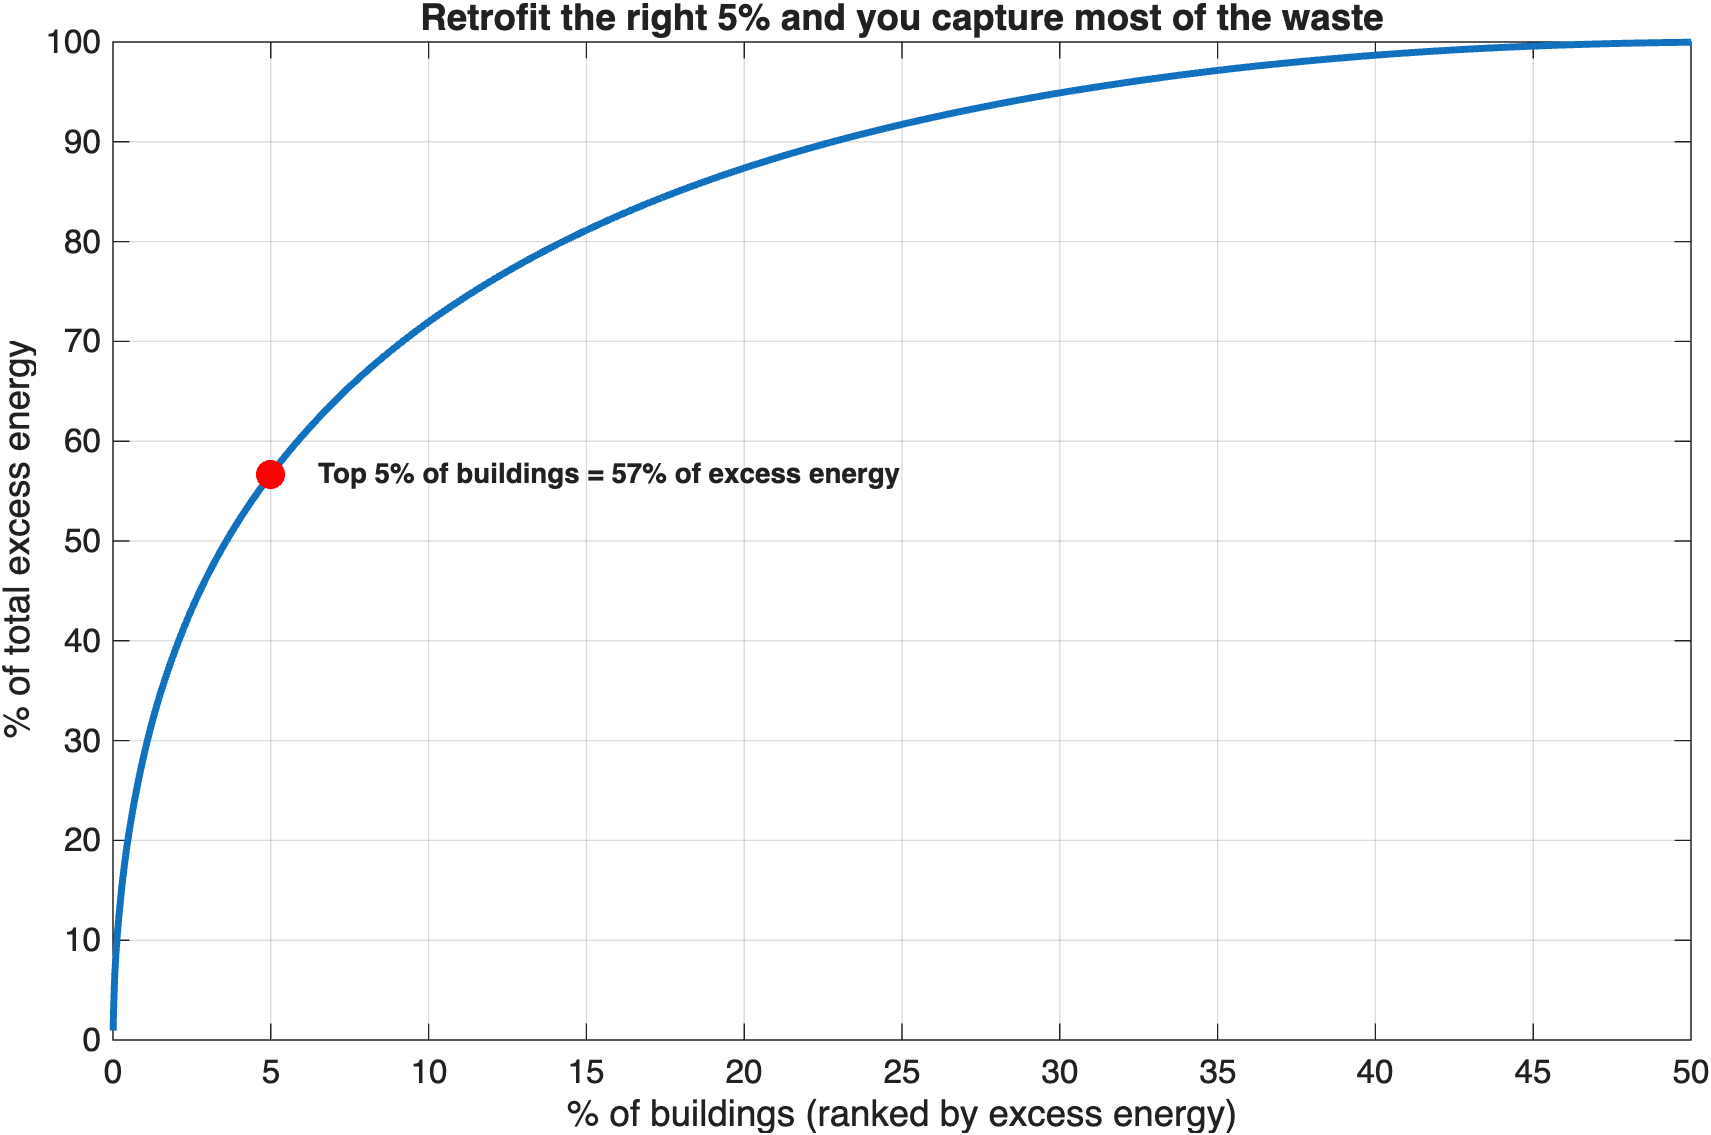
Percentage of buildings needed to retrofit plotted against percentage of savings
-
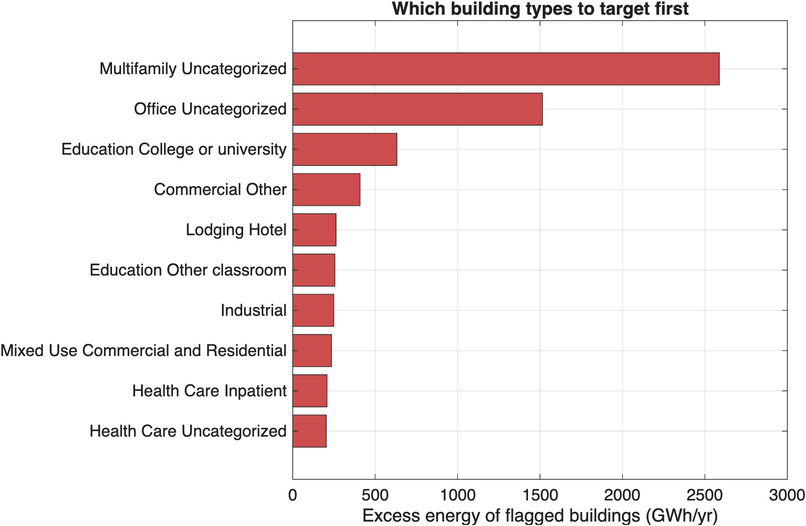
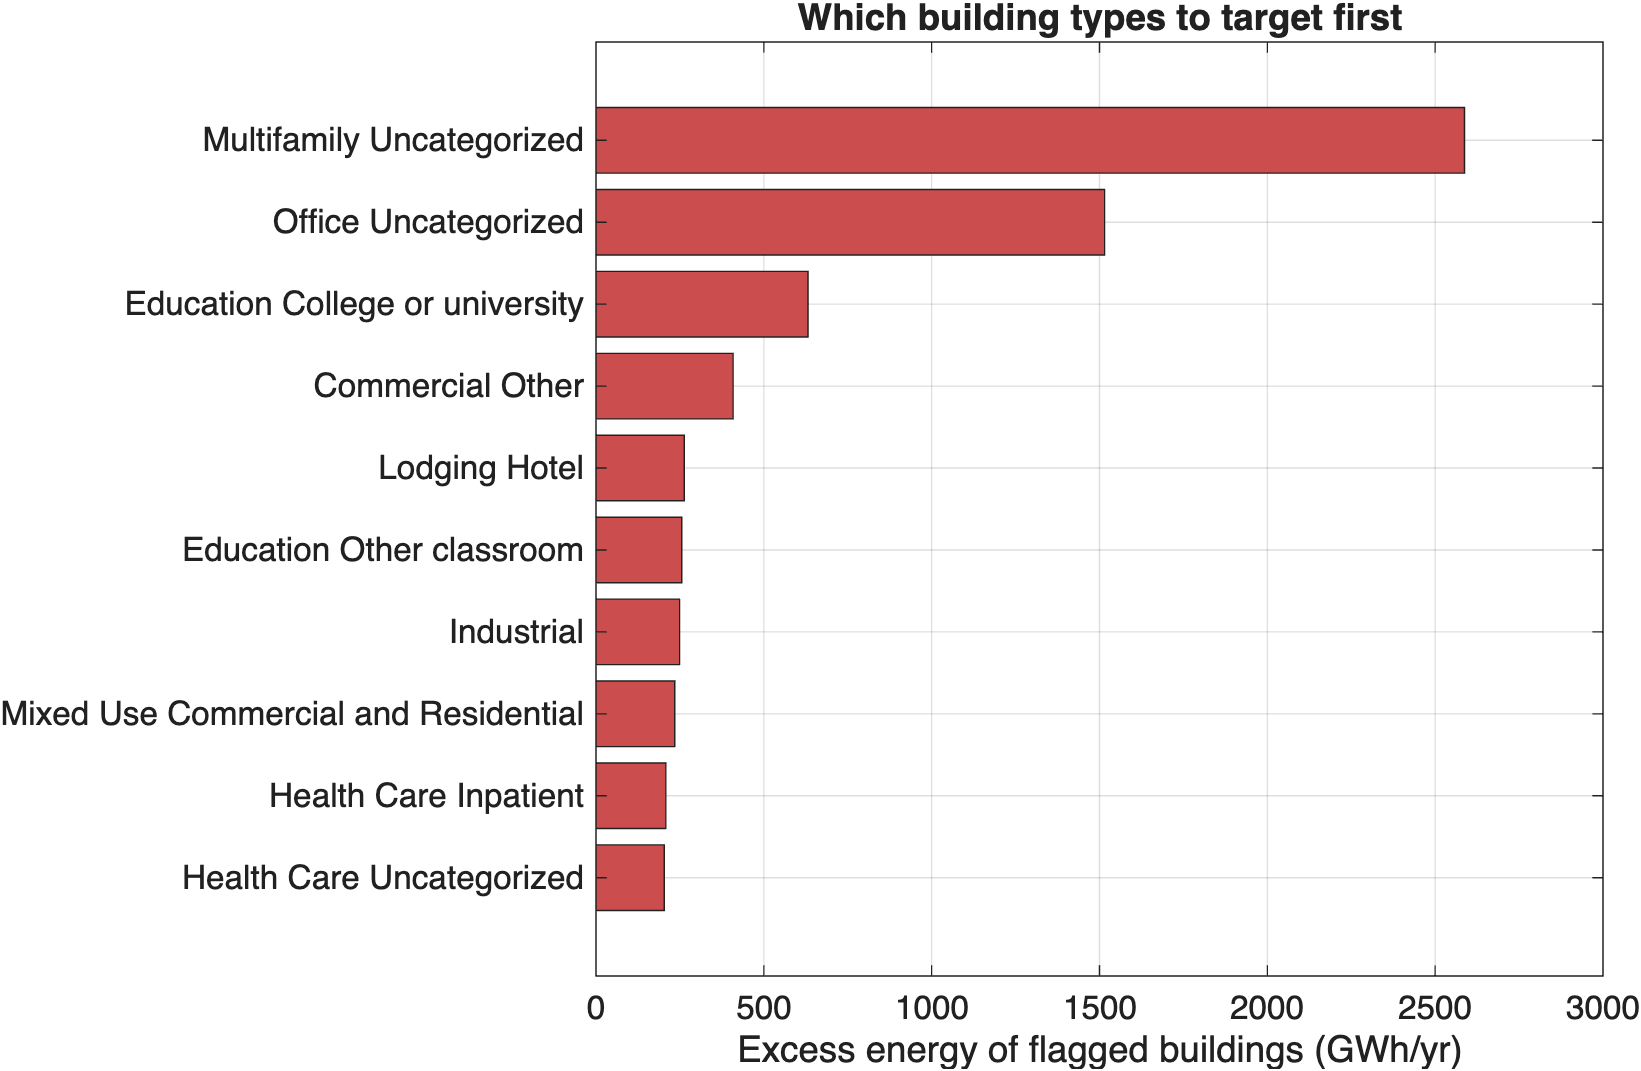
Building types to target first
-
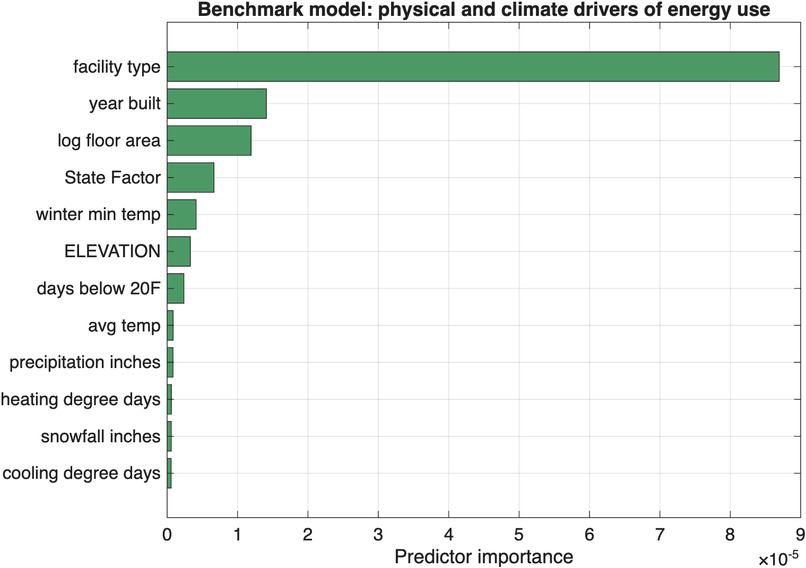
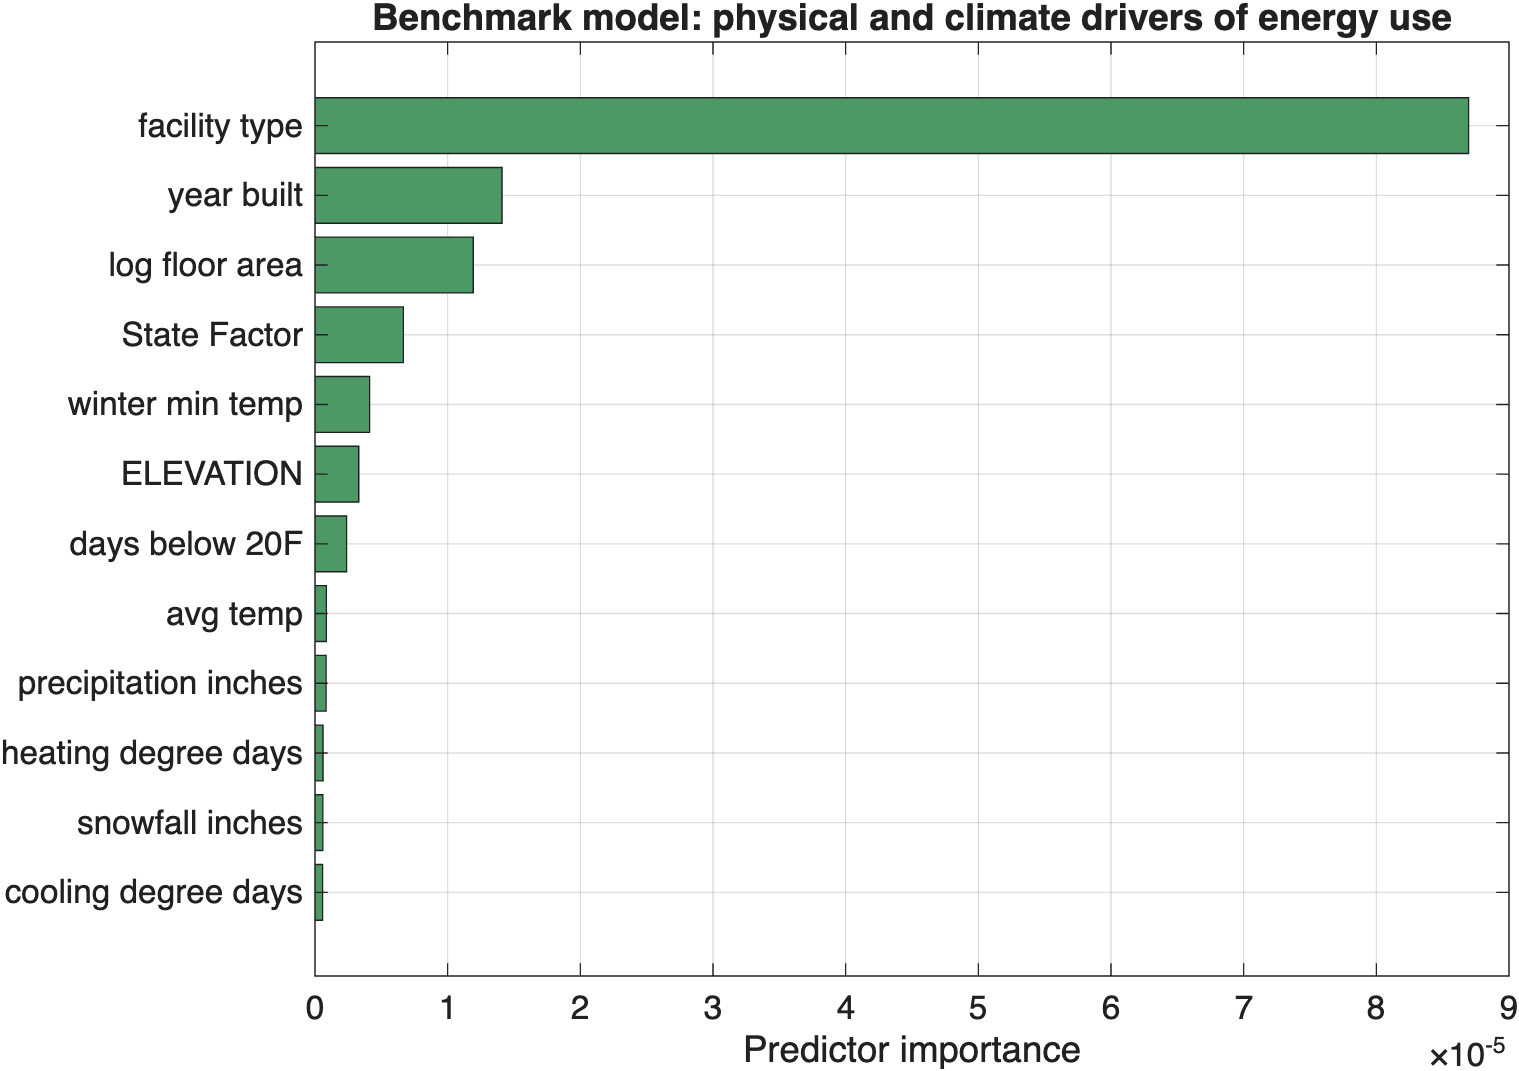
Importance of predictor in energy use
Retrofit Radar: Data-Driven Building Retrofit Prioritisation
Targeting high-impact building decarbonisation using machine learning benchmarks and interactive MATLAB analytics.
Inspiration
Buildings account for roughly one-third of global energy use and \(\text{CO}_2\) emissions. While retrofits (heat pumps, insulation, HVAC upgrades) curb waste, budgets are finite. Building owners cannot retrofit everything at once.
Ranking by raw energy consumption fails—hospitals naturally consume more than warehouses, and cold climates demand more heating. The real question is: which buildings consume significantly more energy than comparable peers in the same climate? We built Retrofit Radar to turn building data into actionable retrofit triage.
What It Does
Built on the WiDS Datathon 2022 dataset (75,757 building-years across 60 facility types), Retrofit Radar predicts Site Energy Use Intensity (EUI, \(\text{kBtu}/\text{ft}^2/\text{yr}\)) and powers a decision-support platform:
- Fair Benchmarking: Predicts expected consumption strictly from physical and climate features (type, size, age, weather extremes), withholding efficiency ratings and past history so chronic waste is never normalised.
- Triage & Anomaly Detection:
- Retrofit Candidates (\(1.5\times\text{ to } 5\times\text{ expected EUI}\)): Flagged and ranked by excess \(\text{MWh}\) and avoided \(\text{CO}_2\).
- Telemetry Check (\(\ge 5\times\)): Separates implausible meter errors so teams avoid auditing bad data.
- Interactive MATLAB App: A dashboard built in MATLAB allowing managers to filter sectors, evaluate segment-level errors, inspect individual assets, and view cumulative waste curves.
How We Built It
- Data Leakage & Temporal Splits: We discovered models memorise repeat buildings (\(\text{RMSE } 29.7\) on seen vs \(45.6\) on unseen). We rejected random splits and enforced strict temporal validation (train Years 1–5, test Year 6).
- Target Engineering: Site EUI is heavily right-skewed (median 75 vs max 998). Modelling \(\log(\text{EUI})\) prevented extreme outliers from distorting gradients—the single biggest performance leap.
- Model Progression: We benchmarked eight models. Tuned gradient-boosted trees (
fitrensemble, LSBoost) selected via multi-year time-series cross-validation achieved the best performance (298 trees, 60 splits, learning rate 0.05).
Key Accomplishments & Results
- 20% Error Reduction: Achieved hold-out Year 6 \(\text{RMSE of } 40.3\), \(\text{MAE of } 18.7\), and \(R^2 \text{ of } 0.50\).
- Pareto Concentration: The top 5% of buildings hold 57% of all excess energy (\(\sim 8,215\text{ GWh/yr}\) and \(3.1\text{M tonnes CO}_2\) upper-bound potential). Auditing just this top tier captures the majority of impact.
- Blind Independent Validation: While our benchmark model never saw Energy Star ratings, flagged candidates had a median Energy Star rating of 20, compared to 73 for unflagged buildings.

Log in or sign up for Devpost to join the conversation.