-
-
Screenshot
-

Screenshot
-
Screenshot
-

Screenshot
-
Screenshot
-

Screenshot


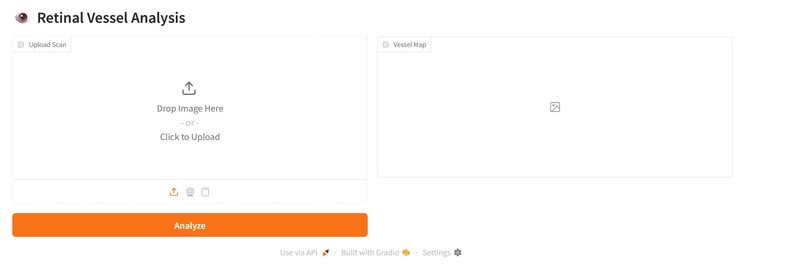
The Vision: Retinal Vessel AI Analyzer
What it does (About the Project)
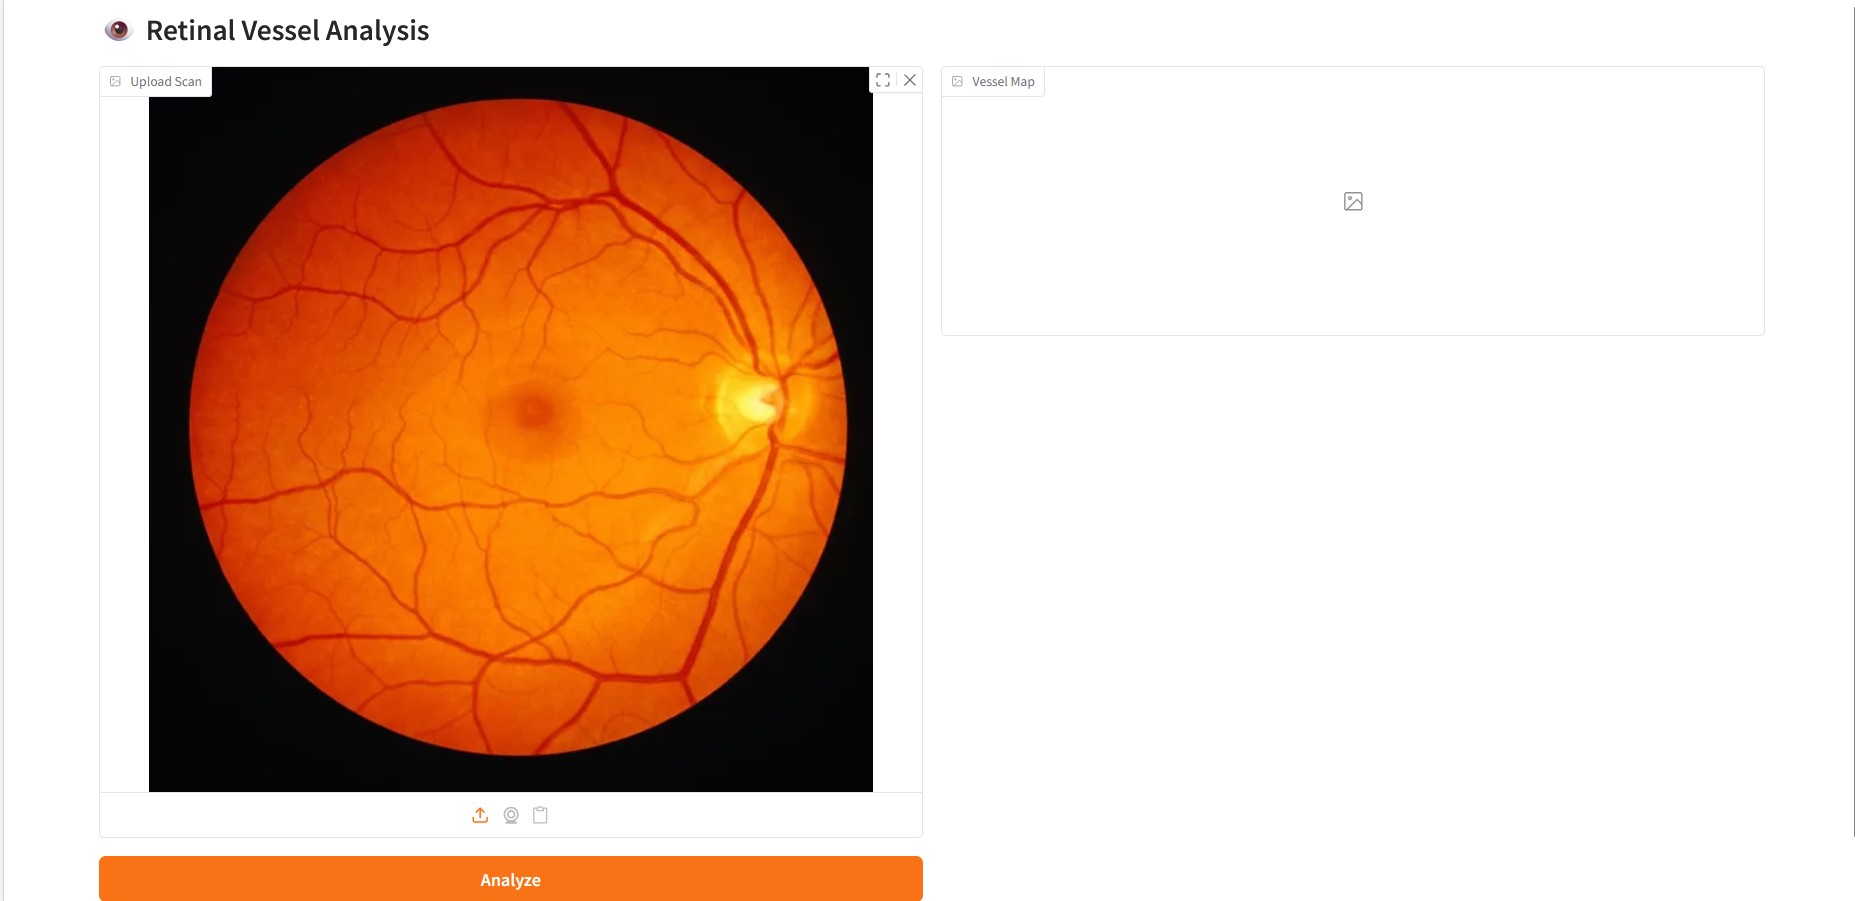
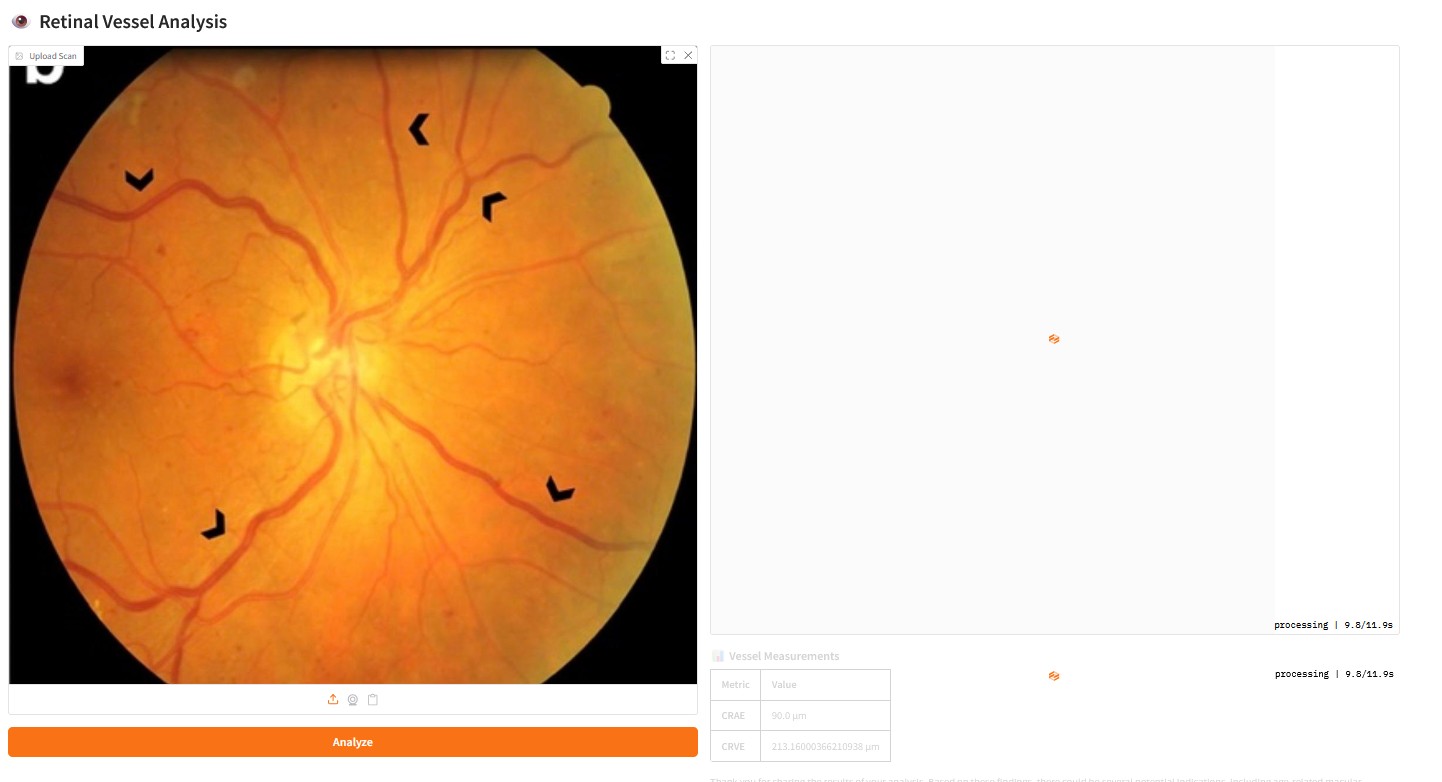
The Retinal Vessel AI Analyzer is a diagnostic support tool designed to quantify cardiovascular risk through the "window" of the human eye. By analyzing the morphology of retinal blood vessels, the system calculates critical biomarkers—Central Retinal Arteriolar Equivalent (CRAE) and Central Retinal Venular Equivalent (CRVE)—which are established clinical indicators of hypertension, stroke risk, and systemic inflammation.
Inspiration
As a professional with a background in Six Sigma and Risk Compliance, I have always been fascinated by how statistical variance in biological data can predict large-scale health outcomes. I was inspired by the fact that the retina is the only place in the human body where we can non-invasively observe live microvasculature. I wanted to create a tool that removes the subjectivity of manual observation and replaces it with mathematical precision, making early diagnostic insights accessible at the point of care.
How I built it
The project is built on a modular pipeline that combines traditional Computer Vision with modern Generative AI:
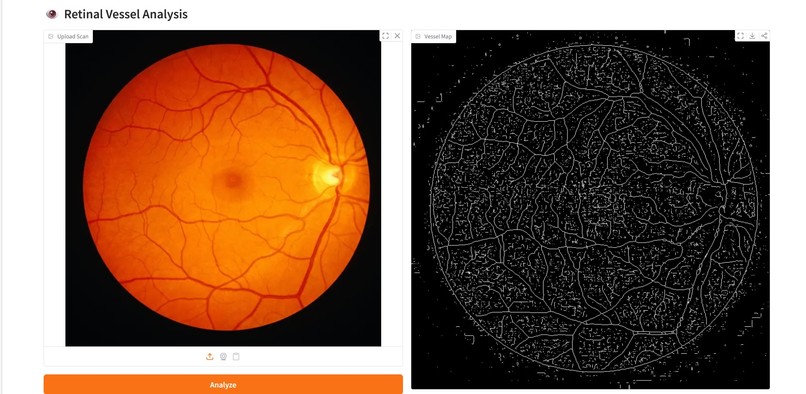
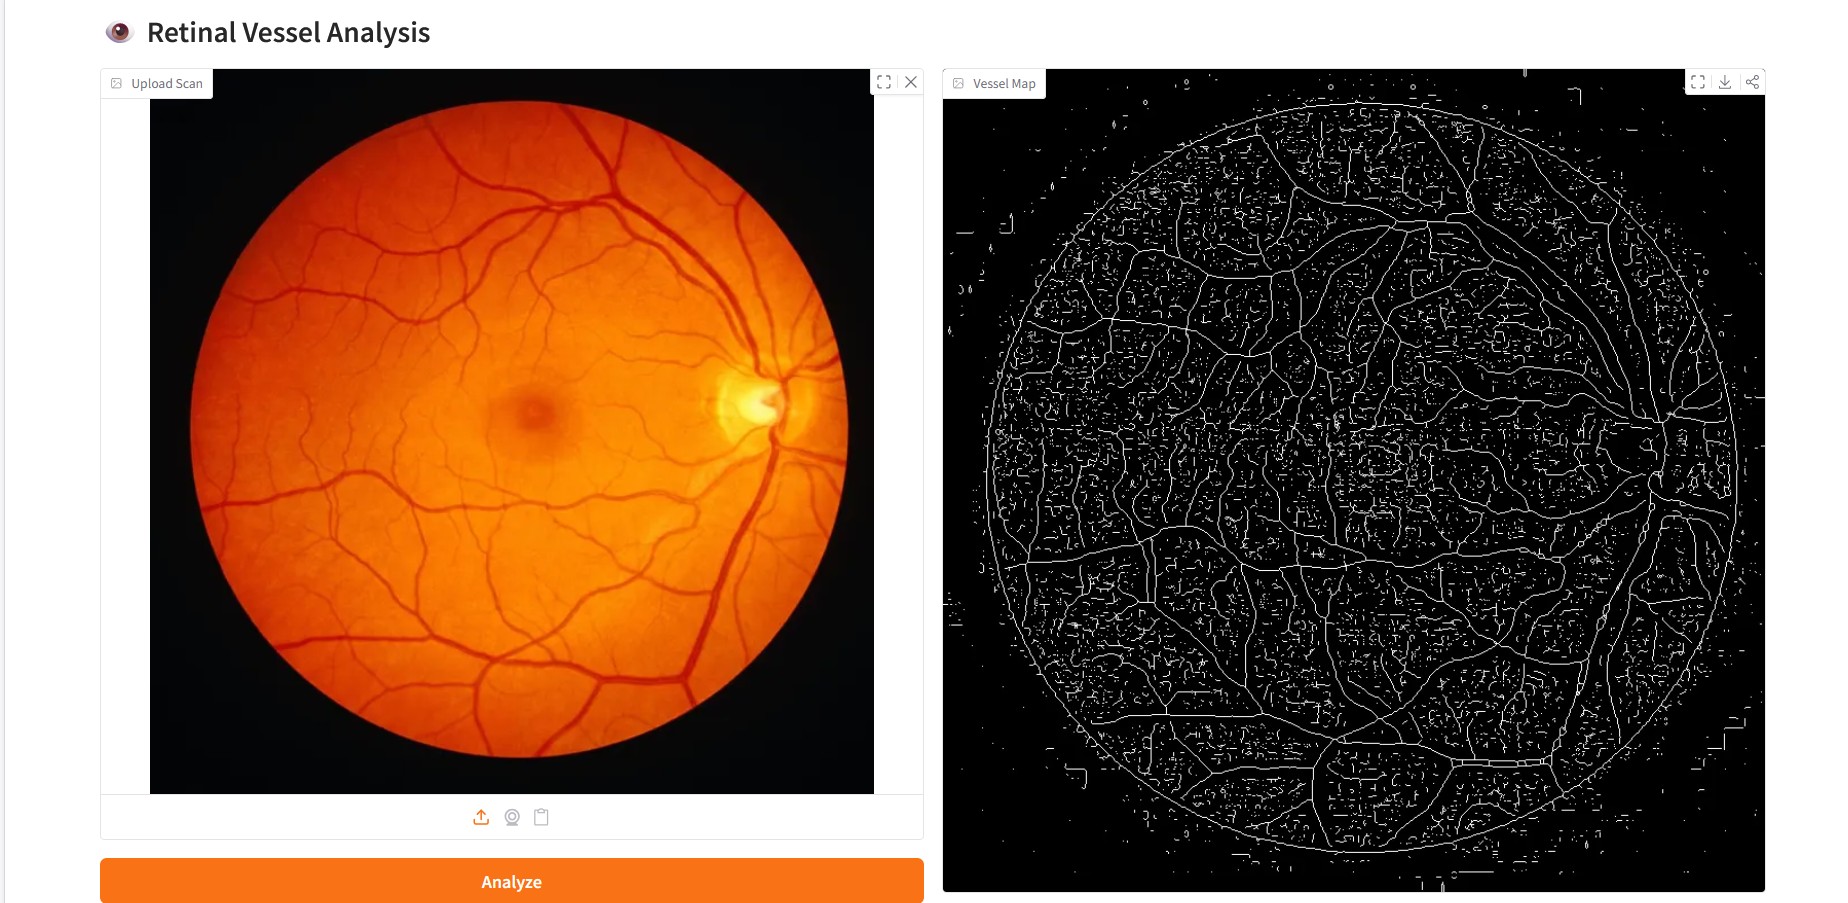
- Image Processing (OpenCV & Scikit-Image): To ensure high-quality data, I implemented CLAHE (Contrast Limited Adaptive Histogram Equalization) on the green channel of fundus images to maximize vessel contrast.
- The Skeletonization Engine: The core logic uses the Zhang-Suen thinning algorithm. This ensures that every vessel is reduced to a 1-pixel wide centerline, preserving the vascular topology.
- Mathematical Quantification: I used a Euclidean Distance Transform to measure the distance from the vessel's skeleton to its edge. The diameter is calculated as: $$D = 2 \times \text{dist}(\text{skeleton}, \text{edge}) \times \text{CalibrationFactor}$$
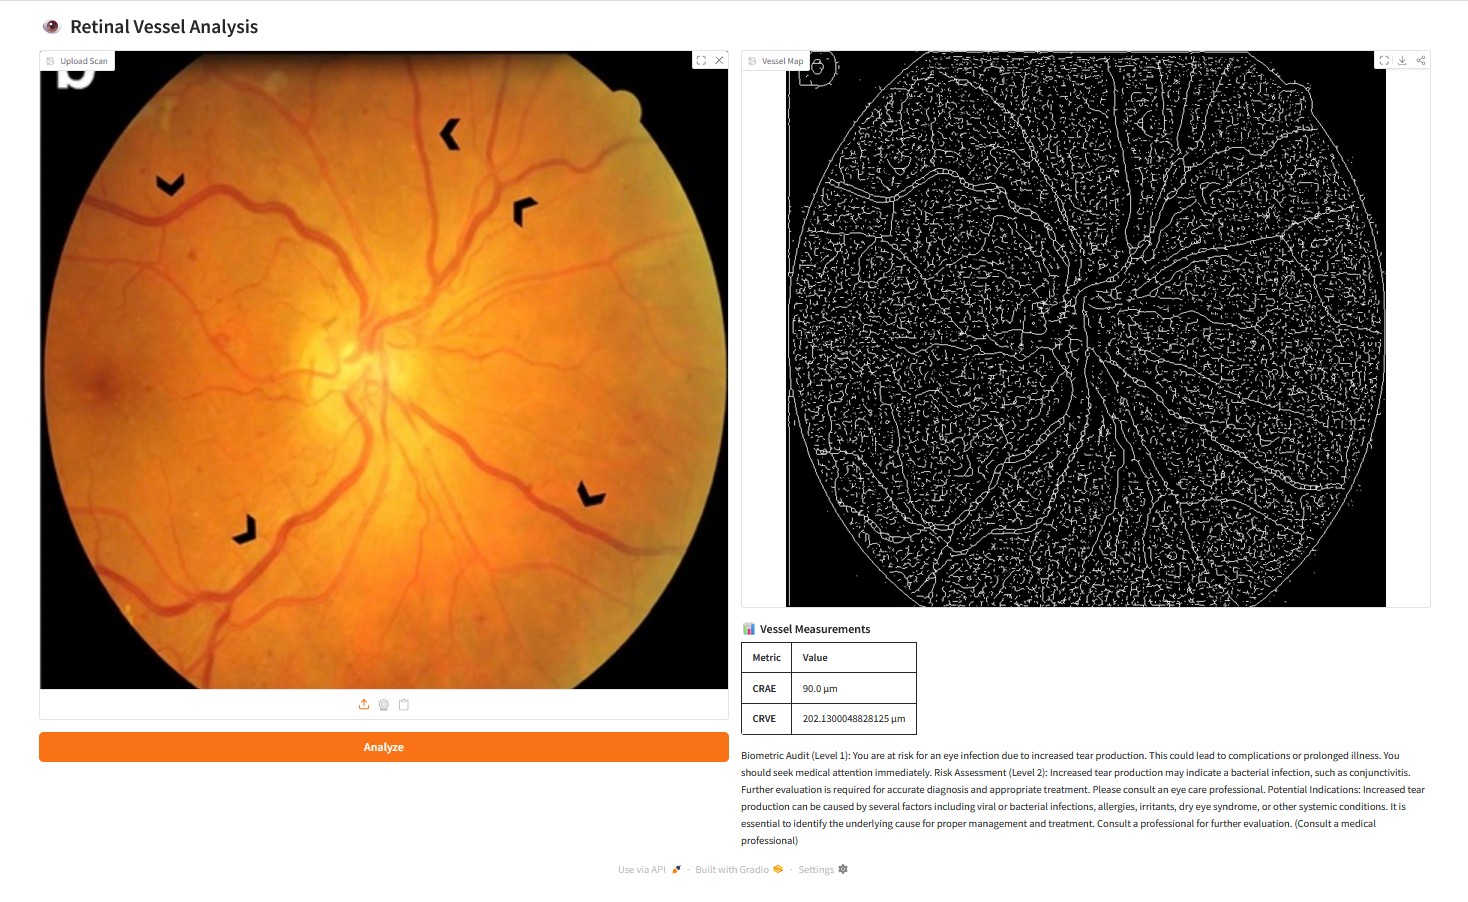
- Local AI Interpretation (Ollama & MedLLaMA2): To maintain patient privacy (Data Sovereignty), the numerical outputs are fed into a locally hosted MedLLaMA2 model. The AI acts as a clinical auditor, comparing the measured CRAE and CRVE against reference normals: o Normal CRAE: $196 \pm 13 \mu m$ o Normal CRVE: $220 \pm 15 \mu m$
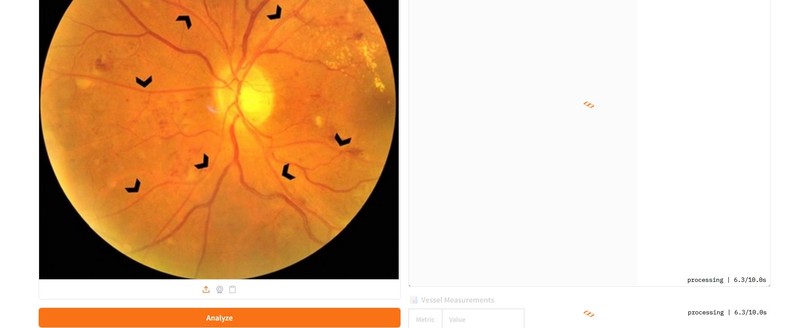
- User Interface: A streamlined dashboard was created using Gradio for real-time analysis and visualization. ## Challenges we ran into • The Skeletonization Hurdle: Initially, using simple morphological erosion caused "breaks" in the vascular map, leading to inaccurate zero-width readings. Switching to the Zhang-Suen algorithm via skimage resolved this by maintaining connectivity. • Artery/Vein Differentiation: Distinguishing between arteries and veins in a static 2D image is notoriously difficult. I overcame this by implementing a heuristic statistical split (analyzing the 30% thinnest vs. 30% thickest vessels), which provided a reliable proxy for CRAE and CRVE calculation in a hackathon environment. • Local AI Integration: Ensuring the Python environment could communicate seamlessly with the Ollama server required robust exception handling to prevent the pipeline from crashing during high-resolution image processing. ## What I learned This project taught me the importance of Edge AI. By running the entire diagnostic pipeline locally, I learned that we can achieve clinical utility without compromising patient data security. It also deepened my understanding of how Six Sigma principles—specifically reducing measurement system error—apply directly to medical image analysis. ## What's next for Retina-Vessel-AI-Analyzer Looking forward to scale it into the medical field to be utilized by doctors and other medical professionals
Built With
- medllama
- numpy
- ollama
- opencv
- python
- scikit-learn

Log in or sign up for Devpost to join the conversation.