-
-
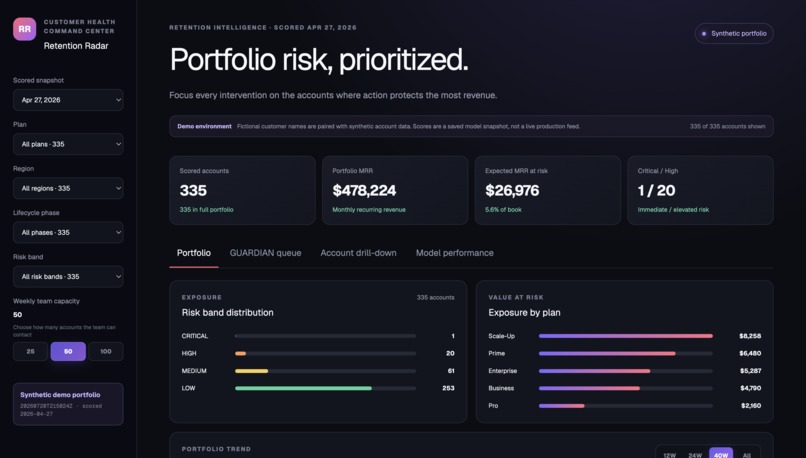
Retention Radar UI
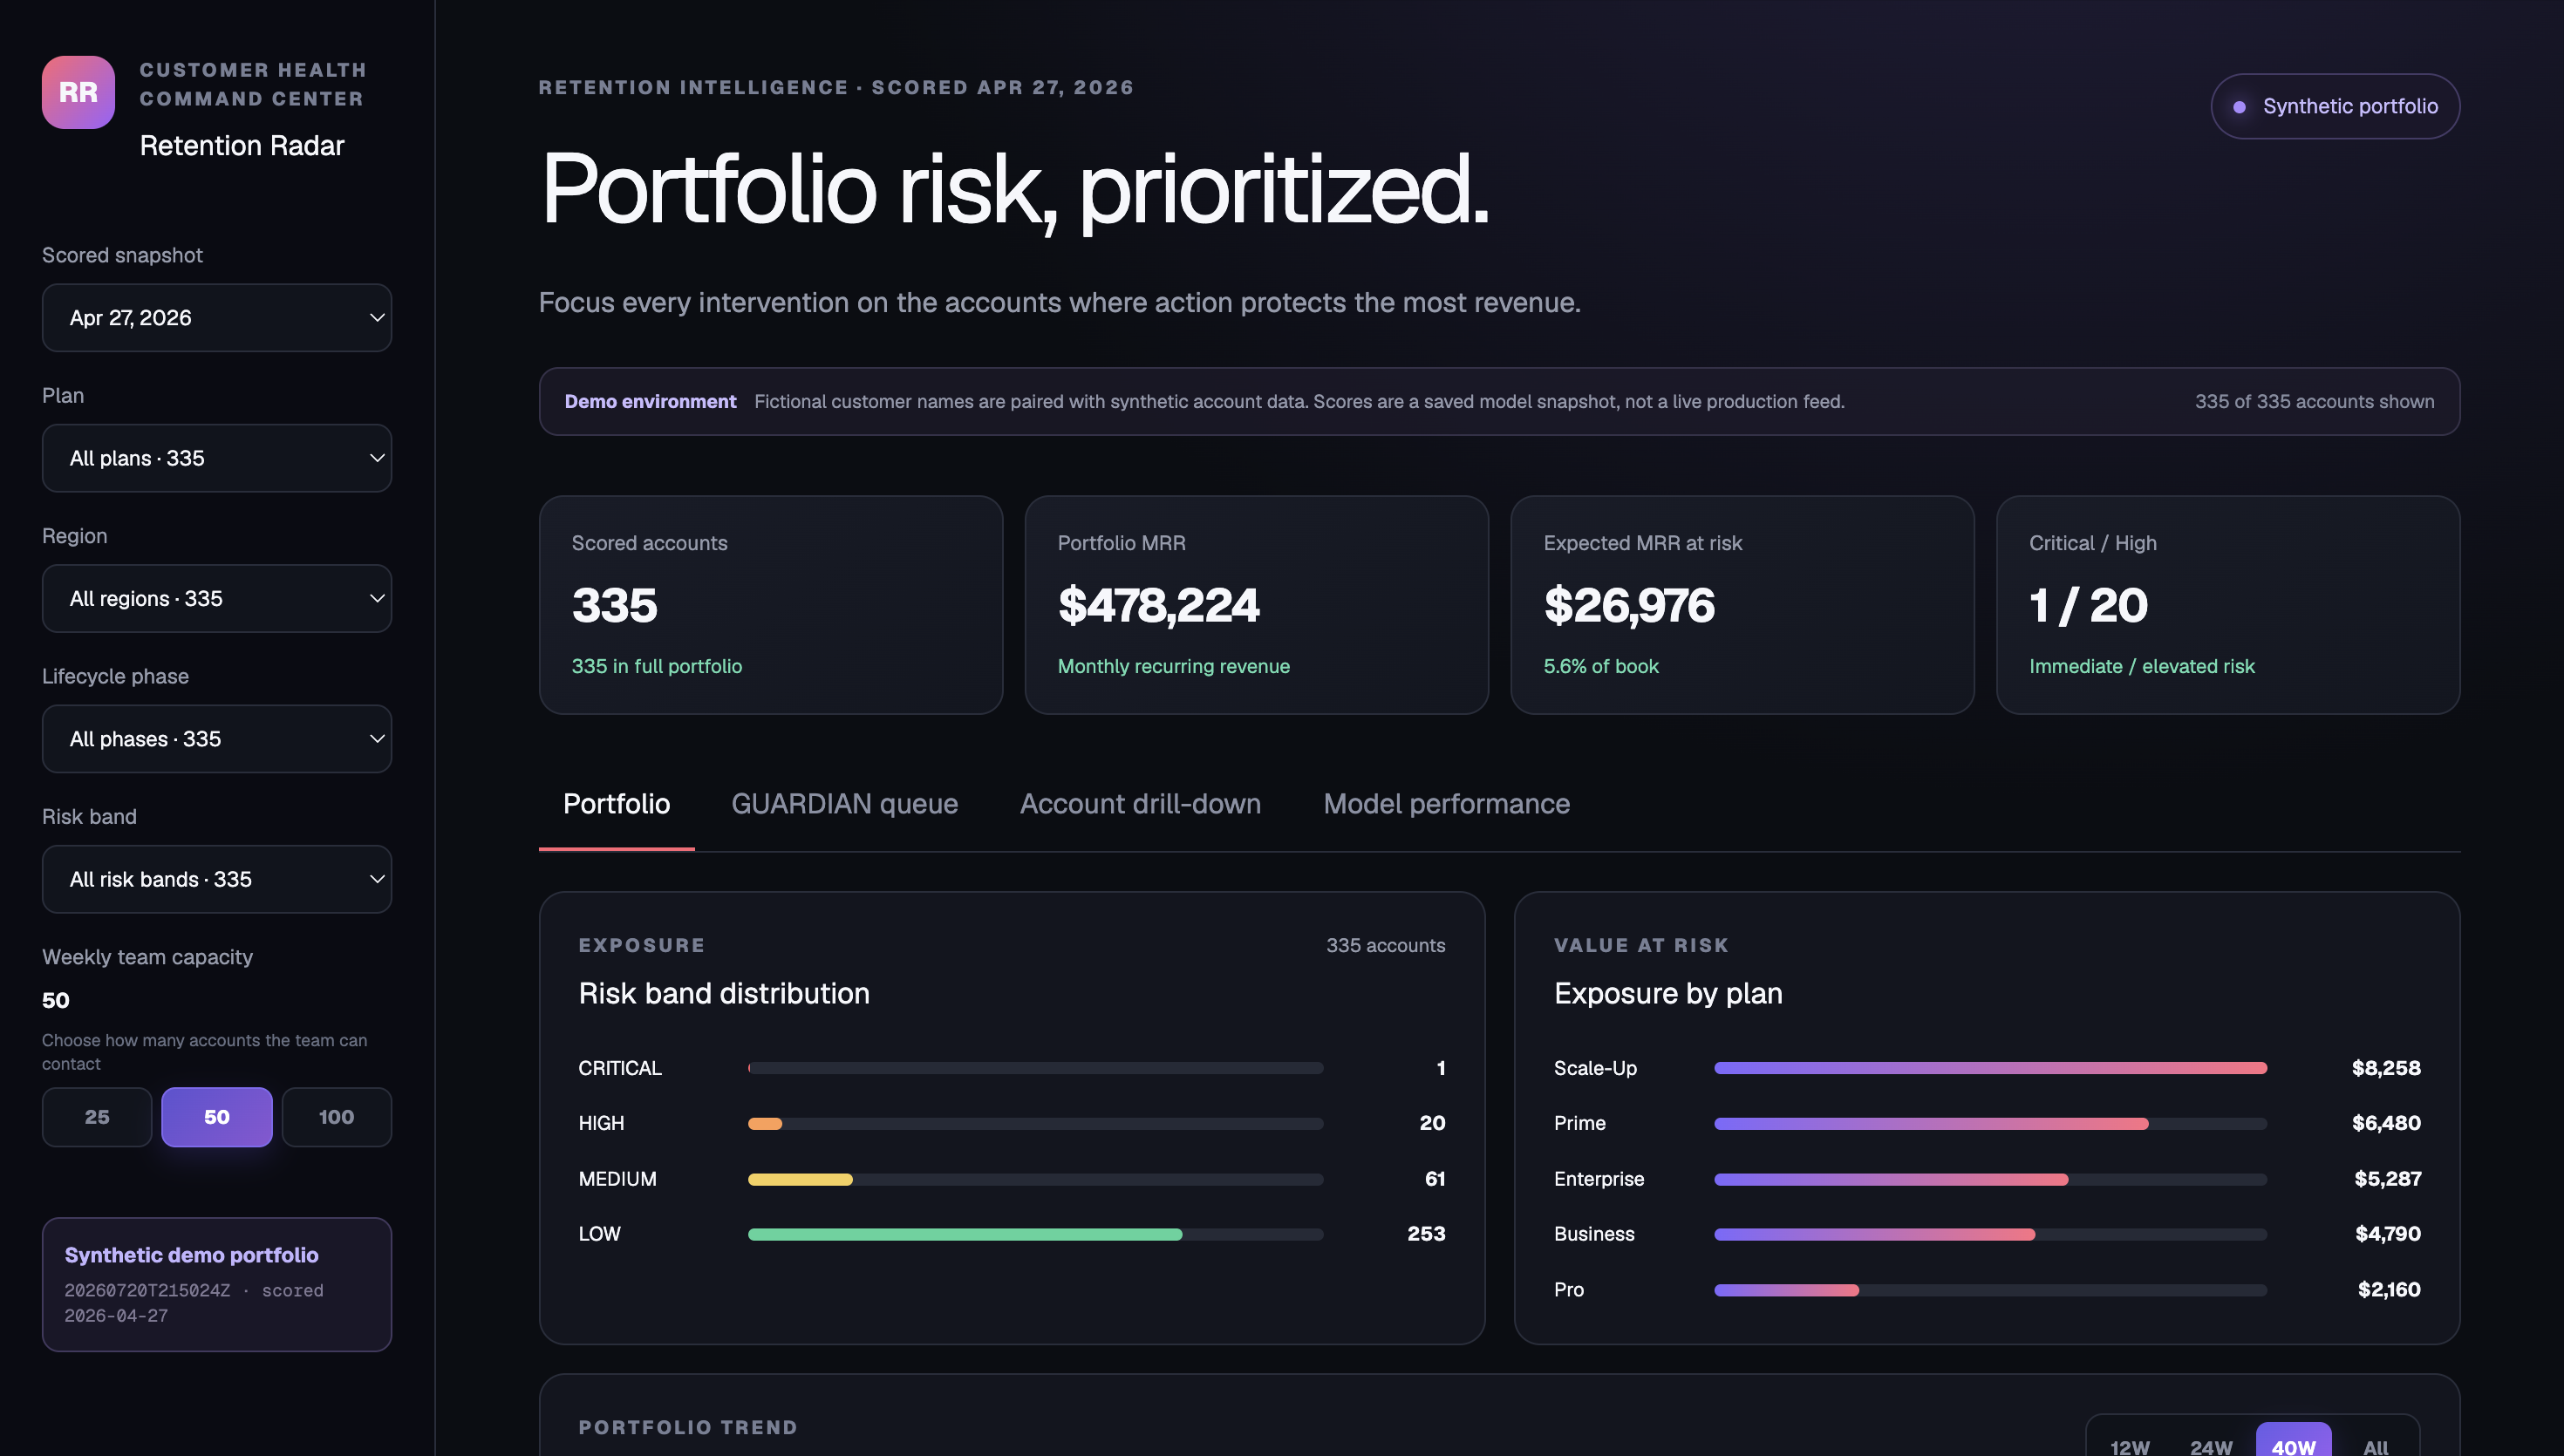
Churn Radar Inspiration Every SaaS team has the same fear: a customer who has already decided to leave, sitting in the portfolio looking perfectly healthy, until the cancellation email lands. Retention teams can only call so many accounts a week. So the real question was never "who might churn?" It was "which fifty accounts should someone actually pick up the phone about on Monday?"
What it does Churn Radar scores every account's chance of cancelling in the next 30 days and turns those scores into a ranked worklist, with the reasons attached. A dashboard shows portfolio risk, the priority queue, per-account history, and an honest view of where the model works and where it doesn't.
How I built it Python, SQLite, pandas, XGBoost, and Streamlit. No server, no cloud. One command goes from an empty database to a live dashboard in about 30 seconds.
Since the real data lives inside a company I can't touch, I wrote a generator that simulates it. Each account carries a hidden weekly health score, and every visible signal is a noisy function of it, so the pattern is real but never handed to the model directly.
The metric that matters isn't accuracy. At a 5% churn rate, predicting "nobody leaves" is 95% accurate and useless. What counts is precision inside the accounts you actually work:
Precision@K = (real churners in your top K) / K
Challenges I ran into Almost everything I learned came from something breaking.
The queue was optimising the wrong thing. It ranked purely by probability, so it kept prioritising cheap accounts that were nearly gone over expensive accounts that were merely likely to leave. Ranking by expected value instead (priority = probability × MRR) protected 31% more revenue for the same effort.
The probabilities were lying. To handle imbalance I'd weighted the positive class, which quietly inflated the scores by about 2.5x. Accounts the model called 82% likely were really leaving 24% of the time. Ranking hid the problem perfectly, right up until I started turning those probabilities into dollar figures. Calibrating them fixed it and cut the error nearly in half.
A bug hiding in the random seed. Results weren't reproducible even with a fixed seed, because the account IDs were generated from OS randomness that ignored it. Since IDs decide the data split, every run scored differently.
Tests that tested nothing. When I deliberately reintroduced old bugs to check the tests would catch them, one passed anyway. It had built its own checklist from the code it was supposed to be checking, so breaking the code broke the test too.
What I learned Once a probability becomes a sort key or a dollar amount, it has to mean what it says. A test that has never failed is unproven, so I broke things on purpose to trust it. And the honest failure is worth more than a padded number: the model is near useless on "surprise churn," customers who hit their targets and leave anyway, and pretending otherwise would just be fitting noise.
What's next Two ideas the data is already set up for: choosing the queue size by expected profit rather than a slider, and switching from predicting churn to predicting who a retention call would actually persuade.
All data is synthetic, so the whole thing runs offline. Around 3,500 lines, 67 tests, one command from empty to dashboard.
Built With
- gboost-(gradient-boosted-trees)
- groupkfold
- isotonicregression
- machine-learning
- numpy
- pandas
- python
- roc/pr-auc
- sql
- with-a-scikit-learn-histgradientboostingclassifier-fallback-if-xgboost-isn't-installed-calibration-&-metrics-scikit-learn-(isotonicregression
- xgboost


Log in or sign up for Devpost to join the conversation.