-
-
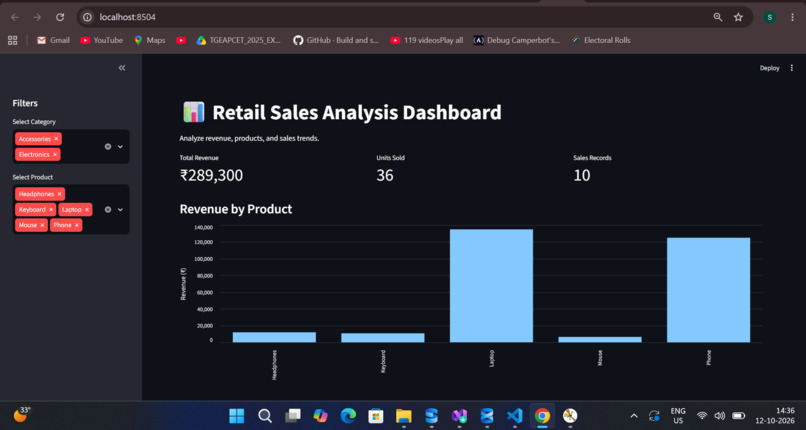
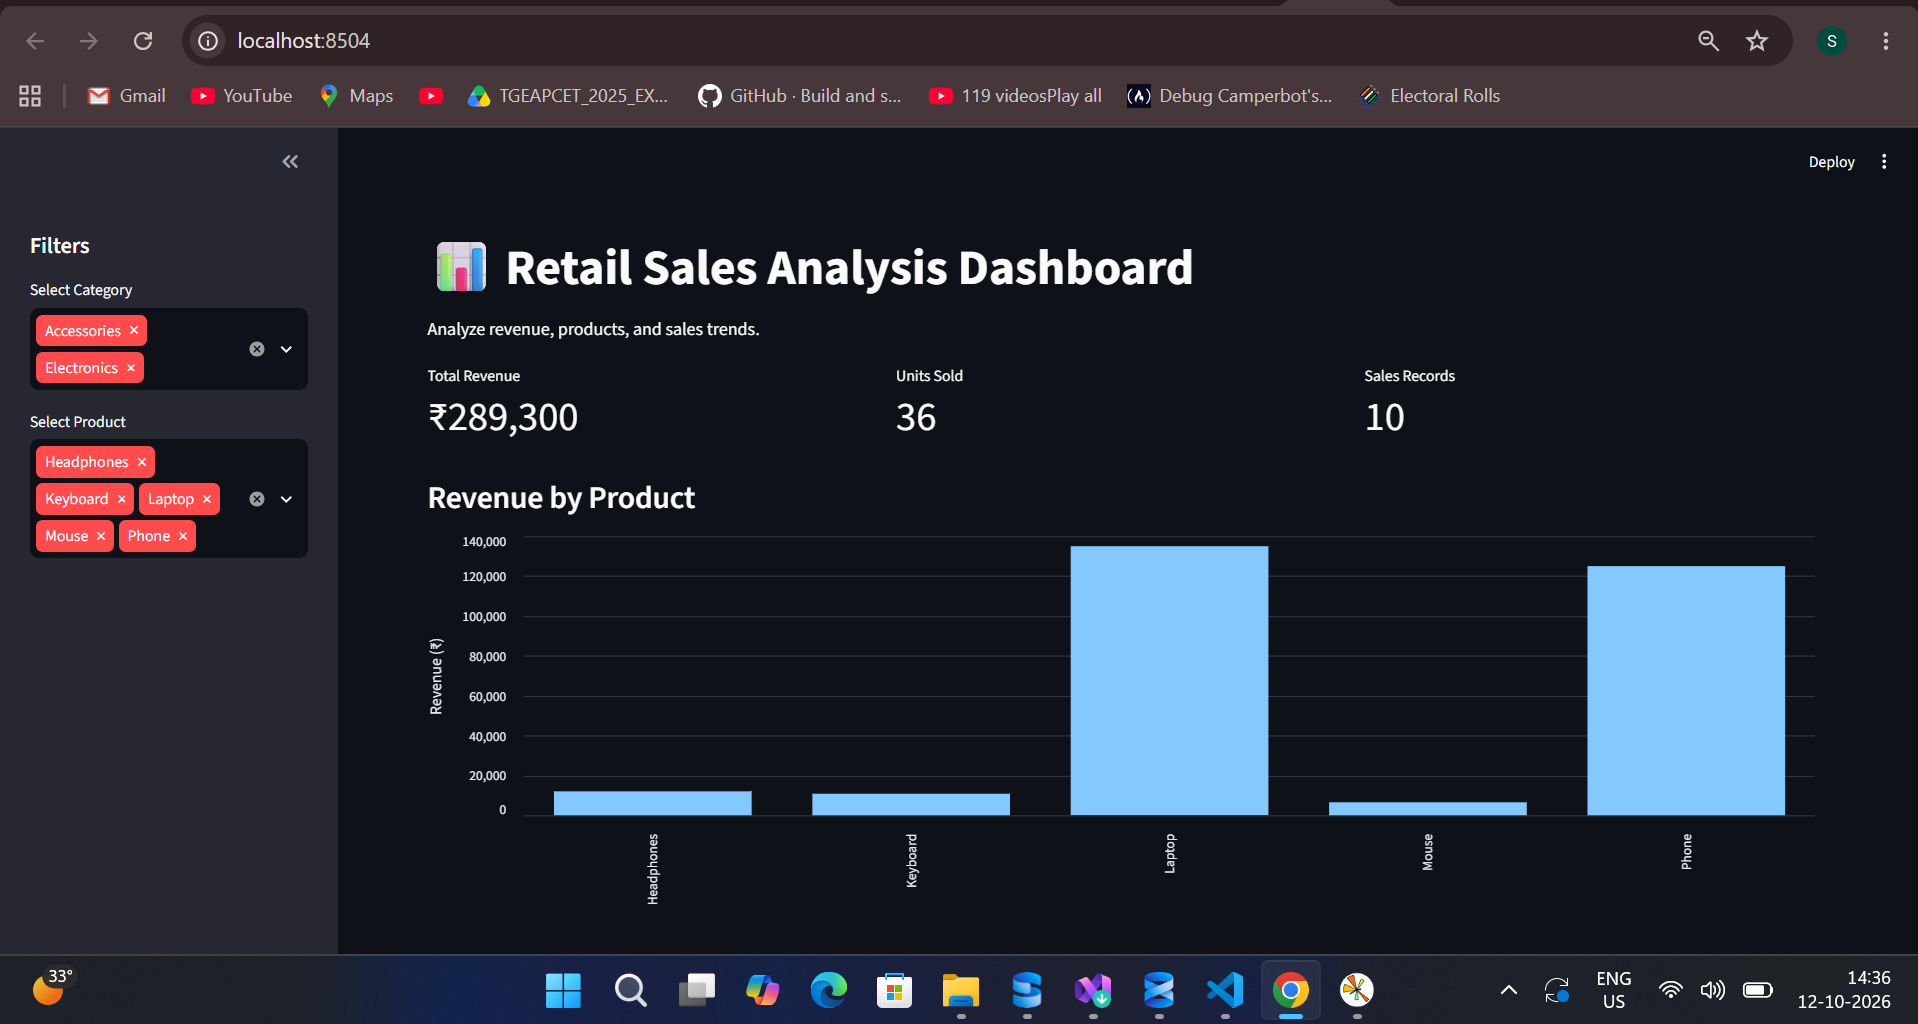
Retail Sales Analysis dashboard built with Streamlit.
-
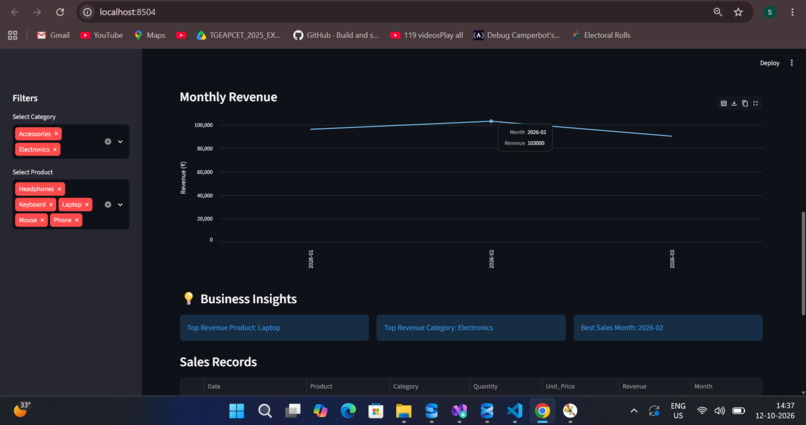
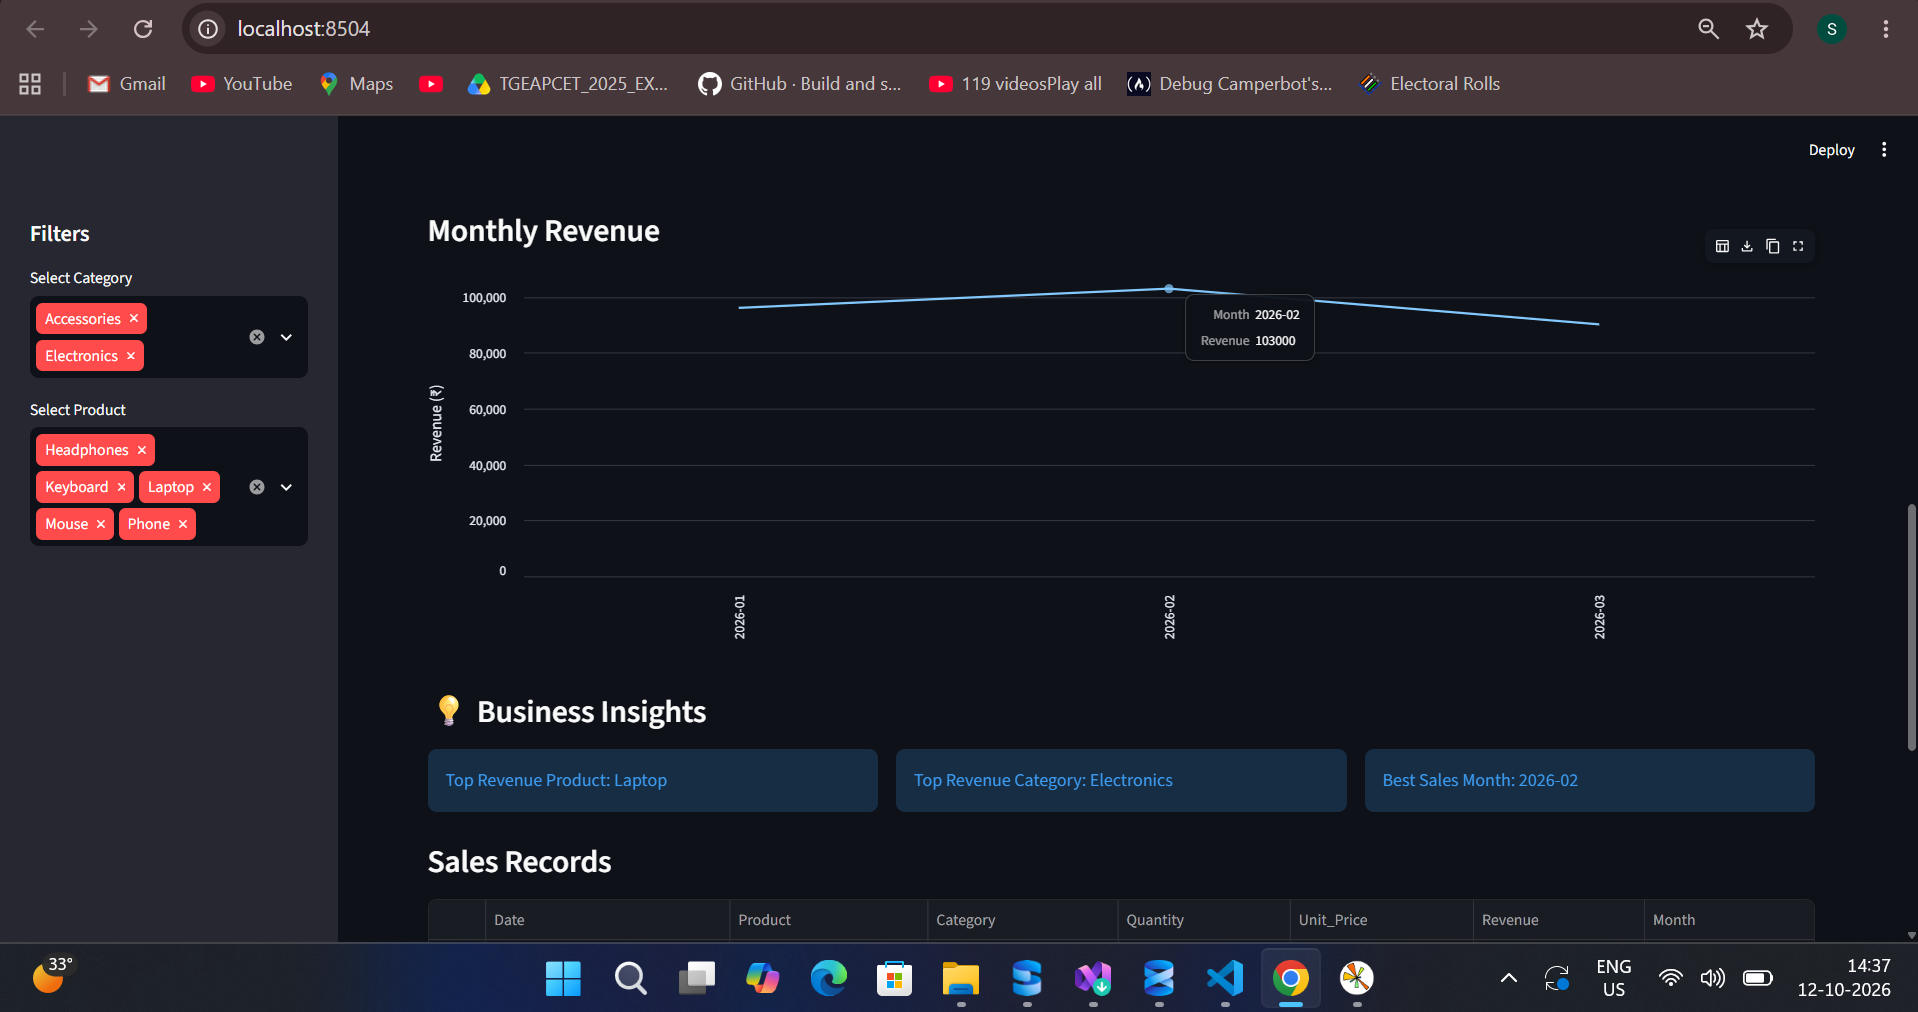
Monthly revenue trends and sales performance.
-
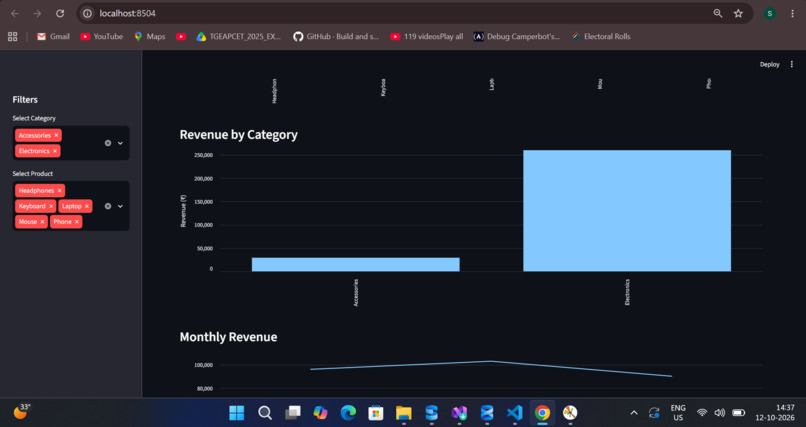
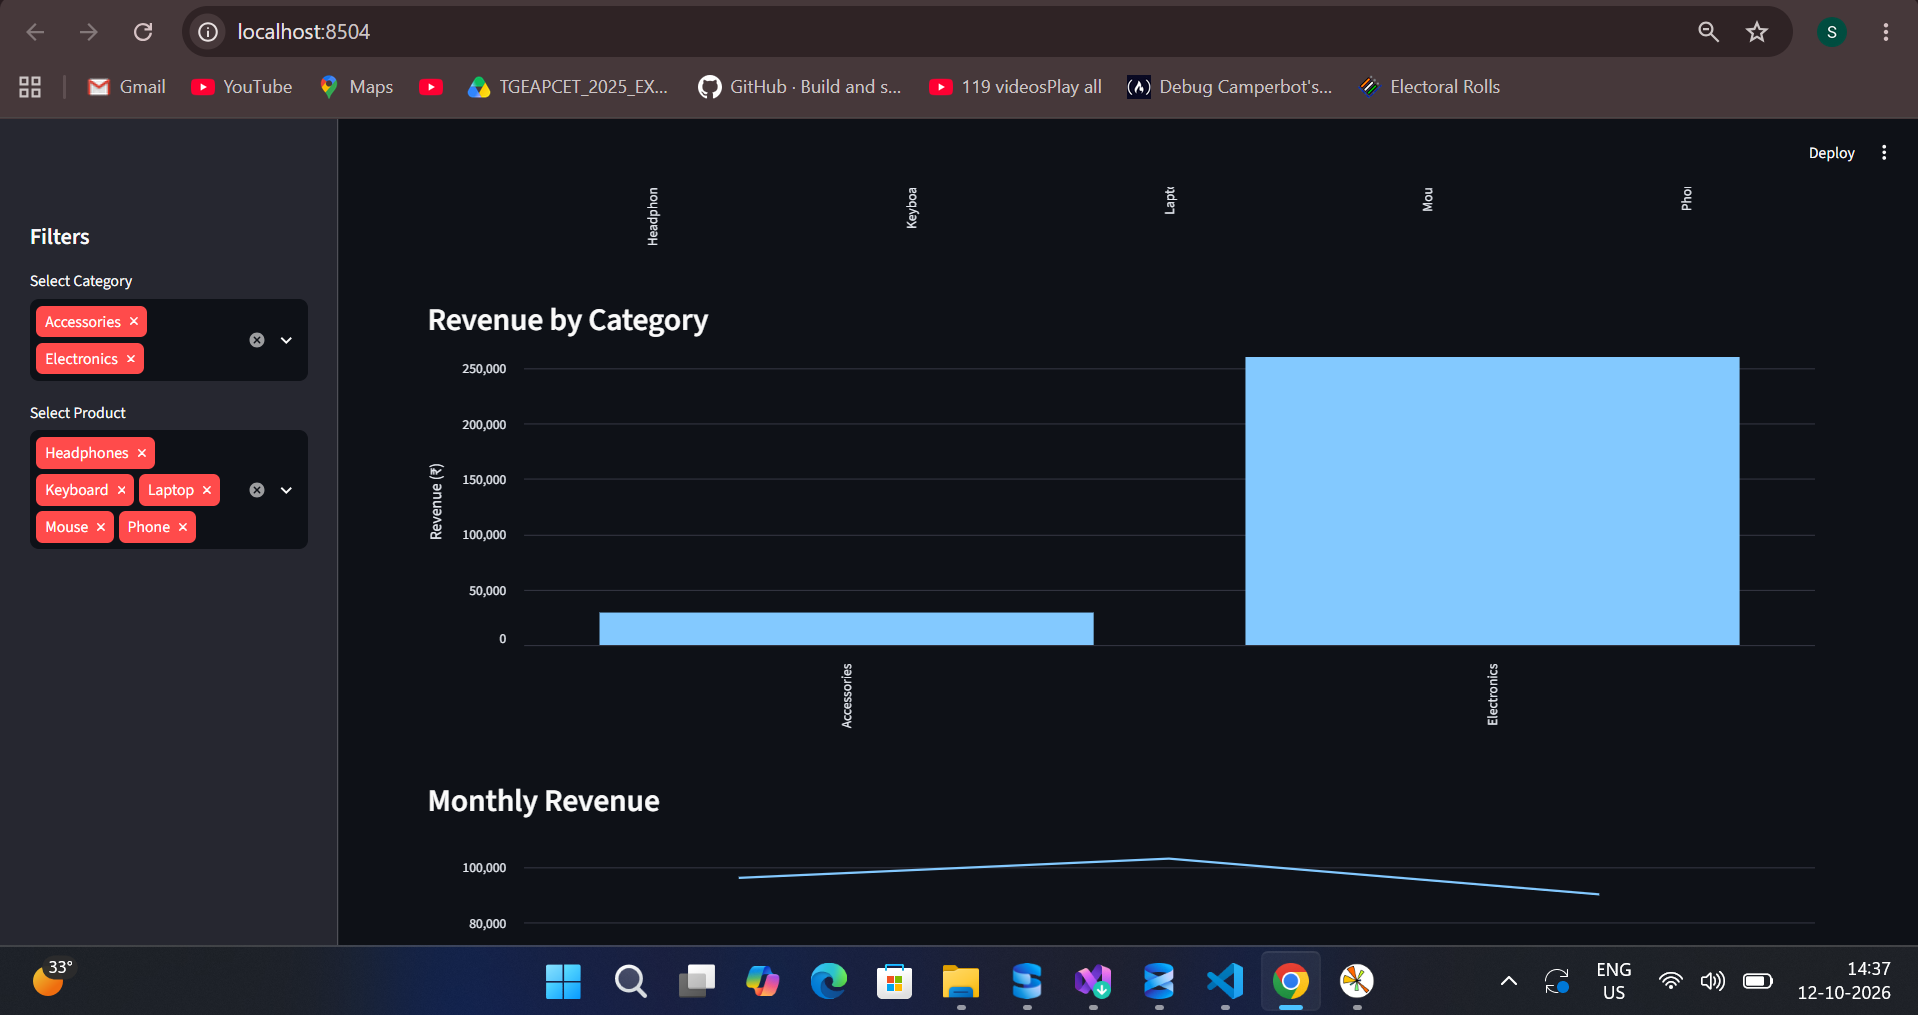
Category-wise revenue analysis and visualization.
-
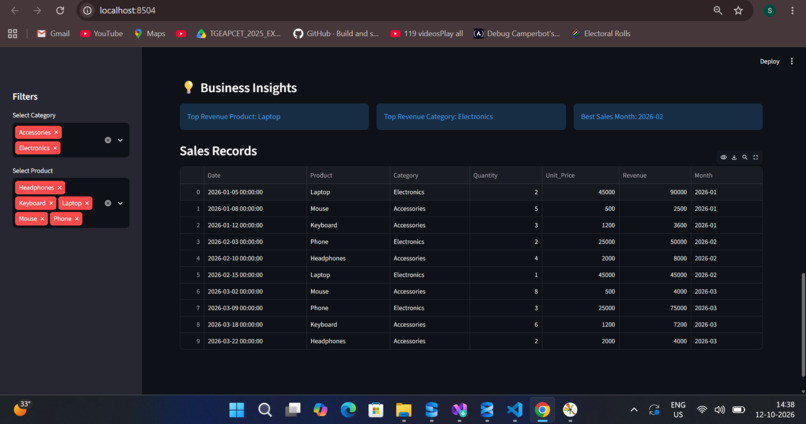
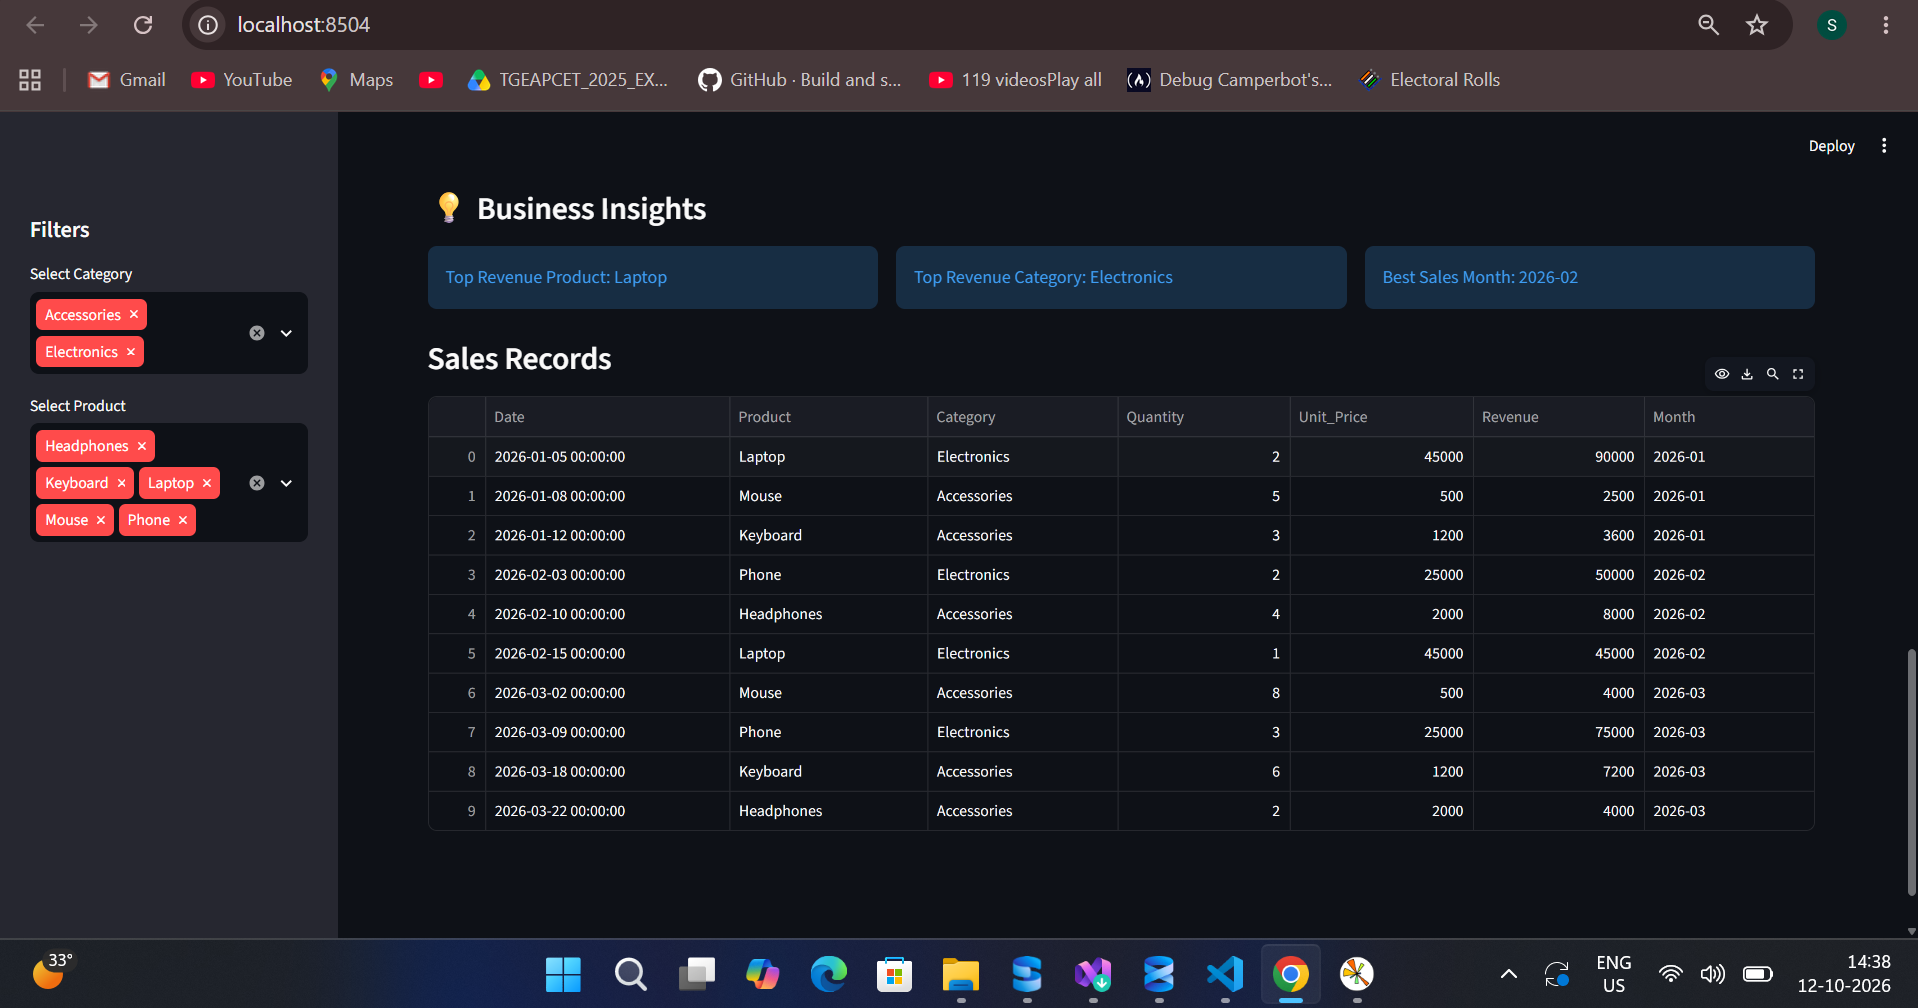
Best-selling products and sales insights.
About the Project
Inspiration
I wanted to understand how data analysis can help businesses track sales performance and make better decisions.
What It Does
Retail Sales Analysis is an interactive dashboard that displays total revenue, units sold, monthly sales trends, category-wise revenue, and best-selling products.
How I Built It
I used Python, Pandas, Matplotlib, and Streamlit to process sales data, create visualizations, and build an interactive dashboard.
Challenges I Faced
I worked on organizing the dataset, calculating accurate sales metrics, and presenting the results through clear and meaningful visualizations.
What I Learned
This project helped me gain practical experience in data cleaning, data analysis, visualization, and building dashboards using Python.

Log in or sign up for Devpost to join the conversation.