Inspiration
Restaurant owners have large amounts of sales data, but raw transactions are difficult to turn into clear business decisions. RestaurantIQ was created to make restaurant sales analysis easier by combining data analytics, machine learning, visualization, and AI-powered recommendations.
What it does
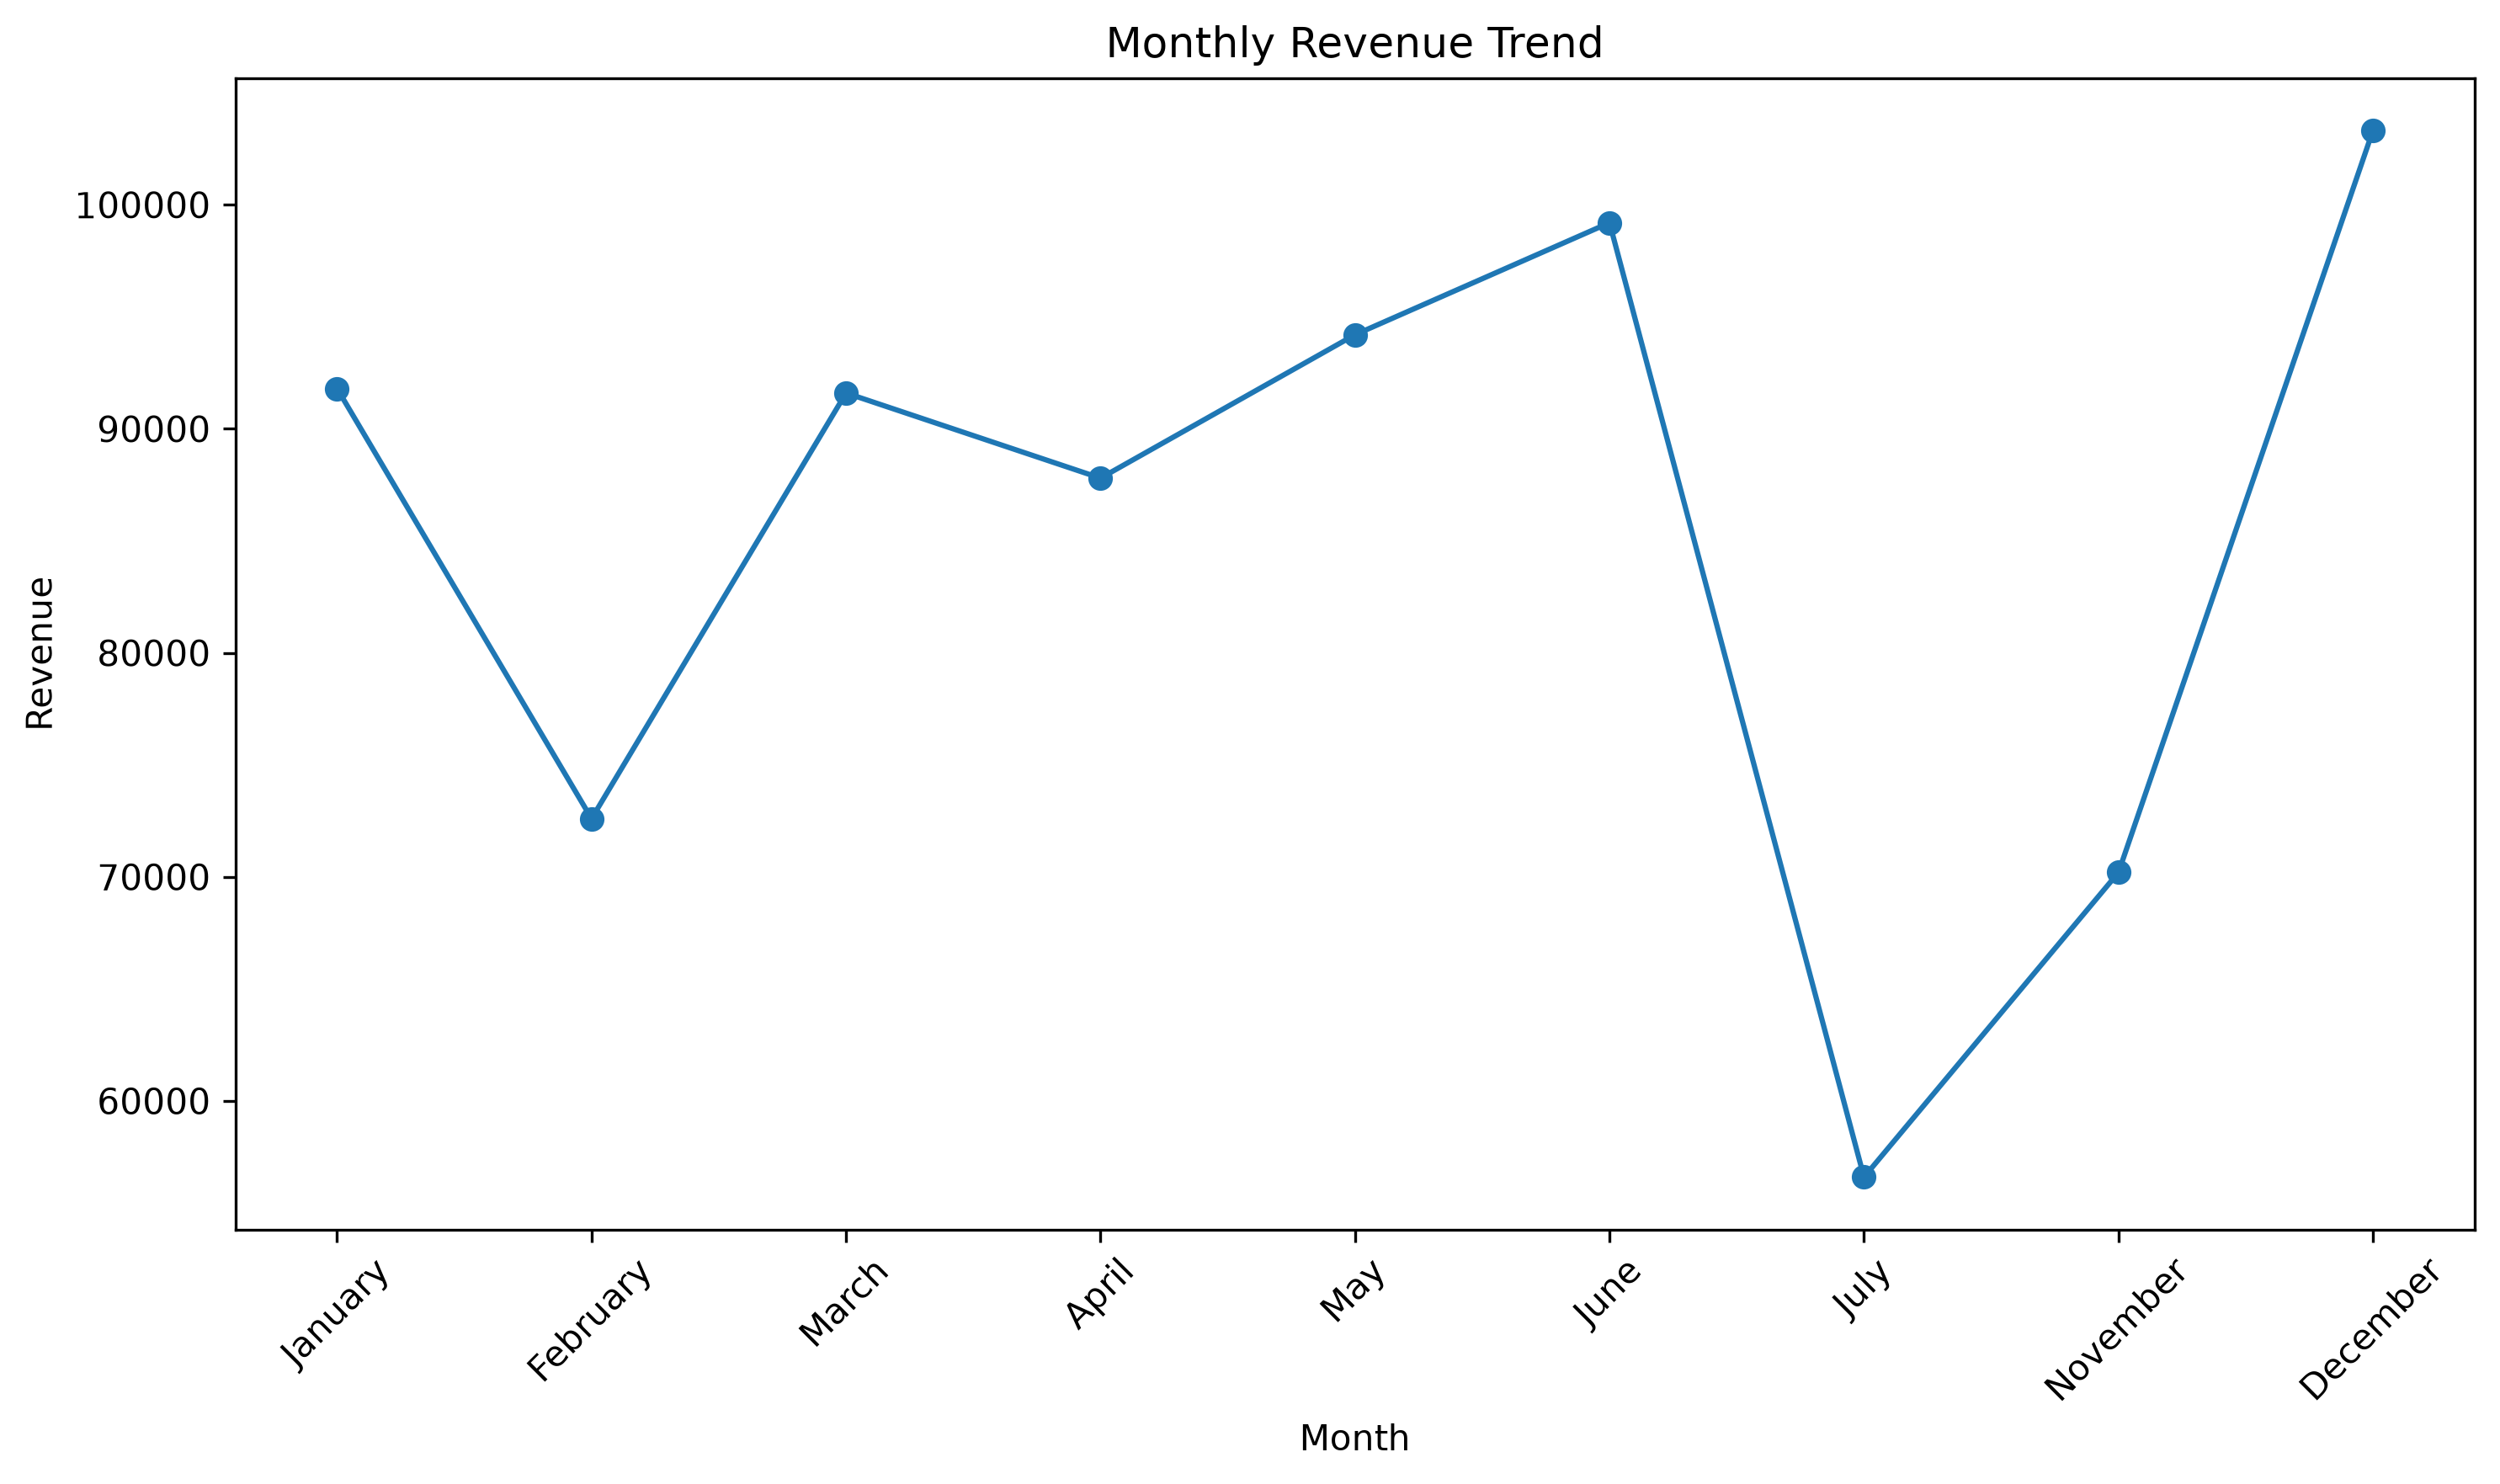
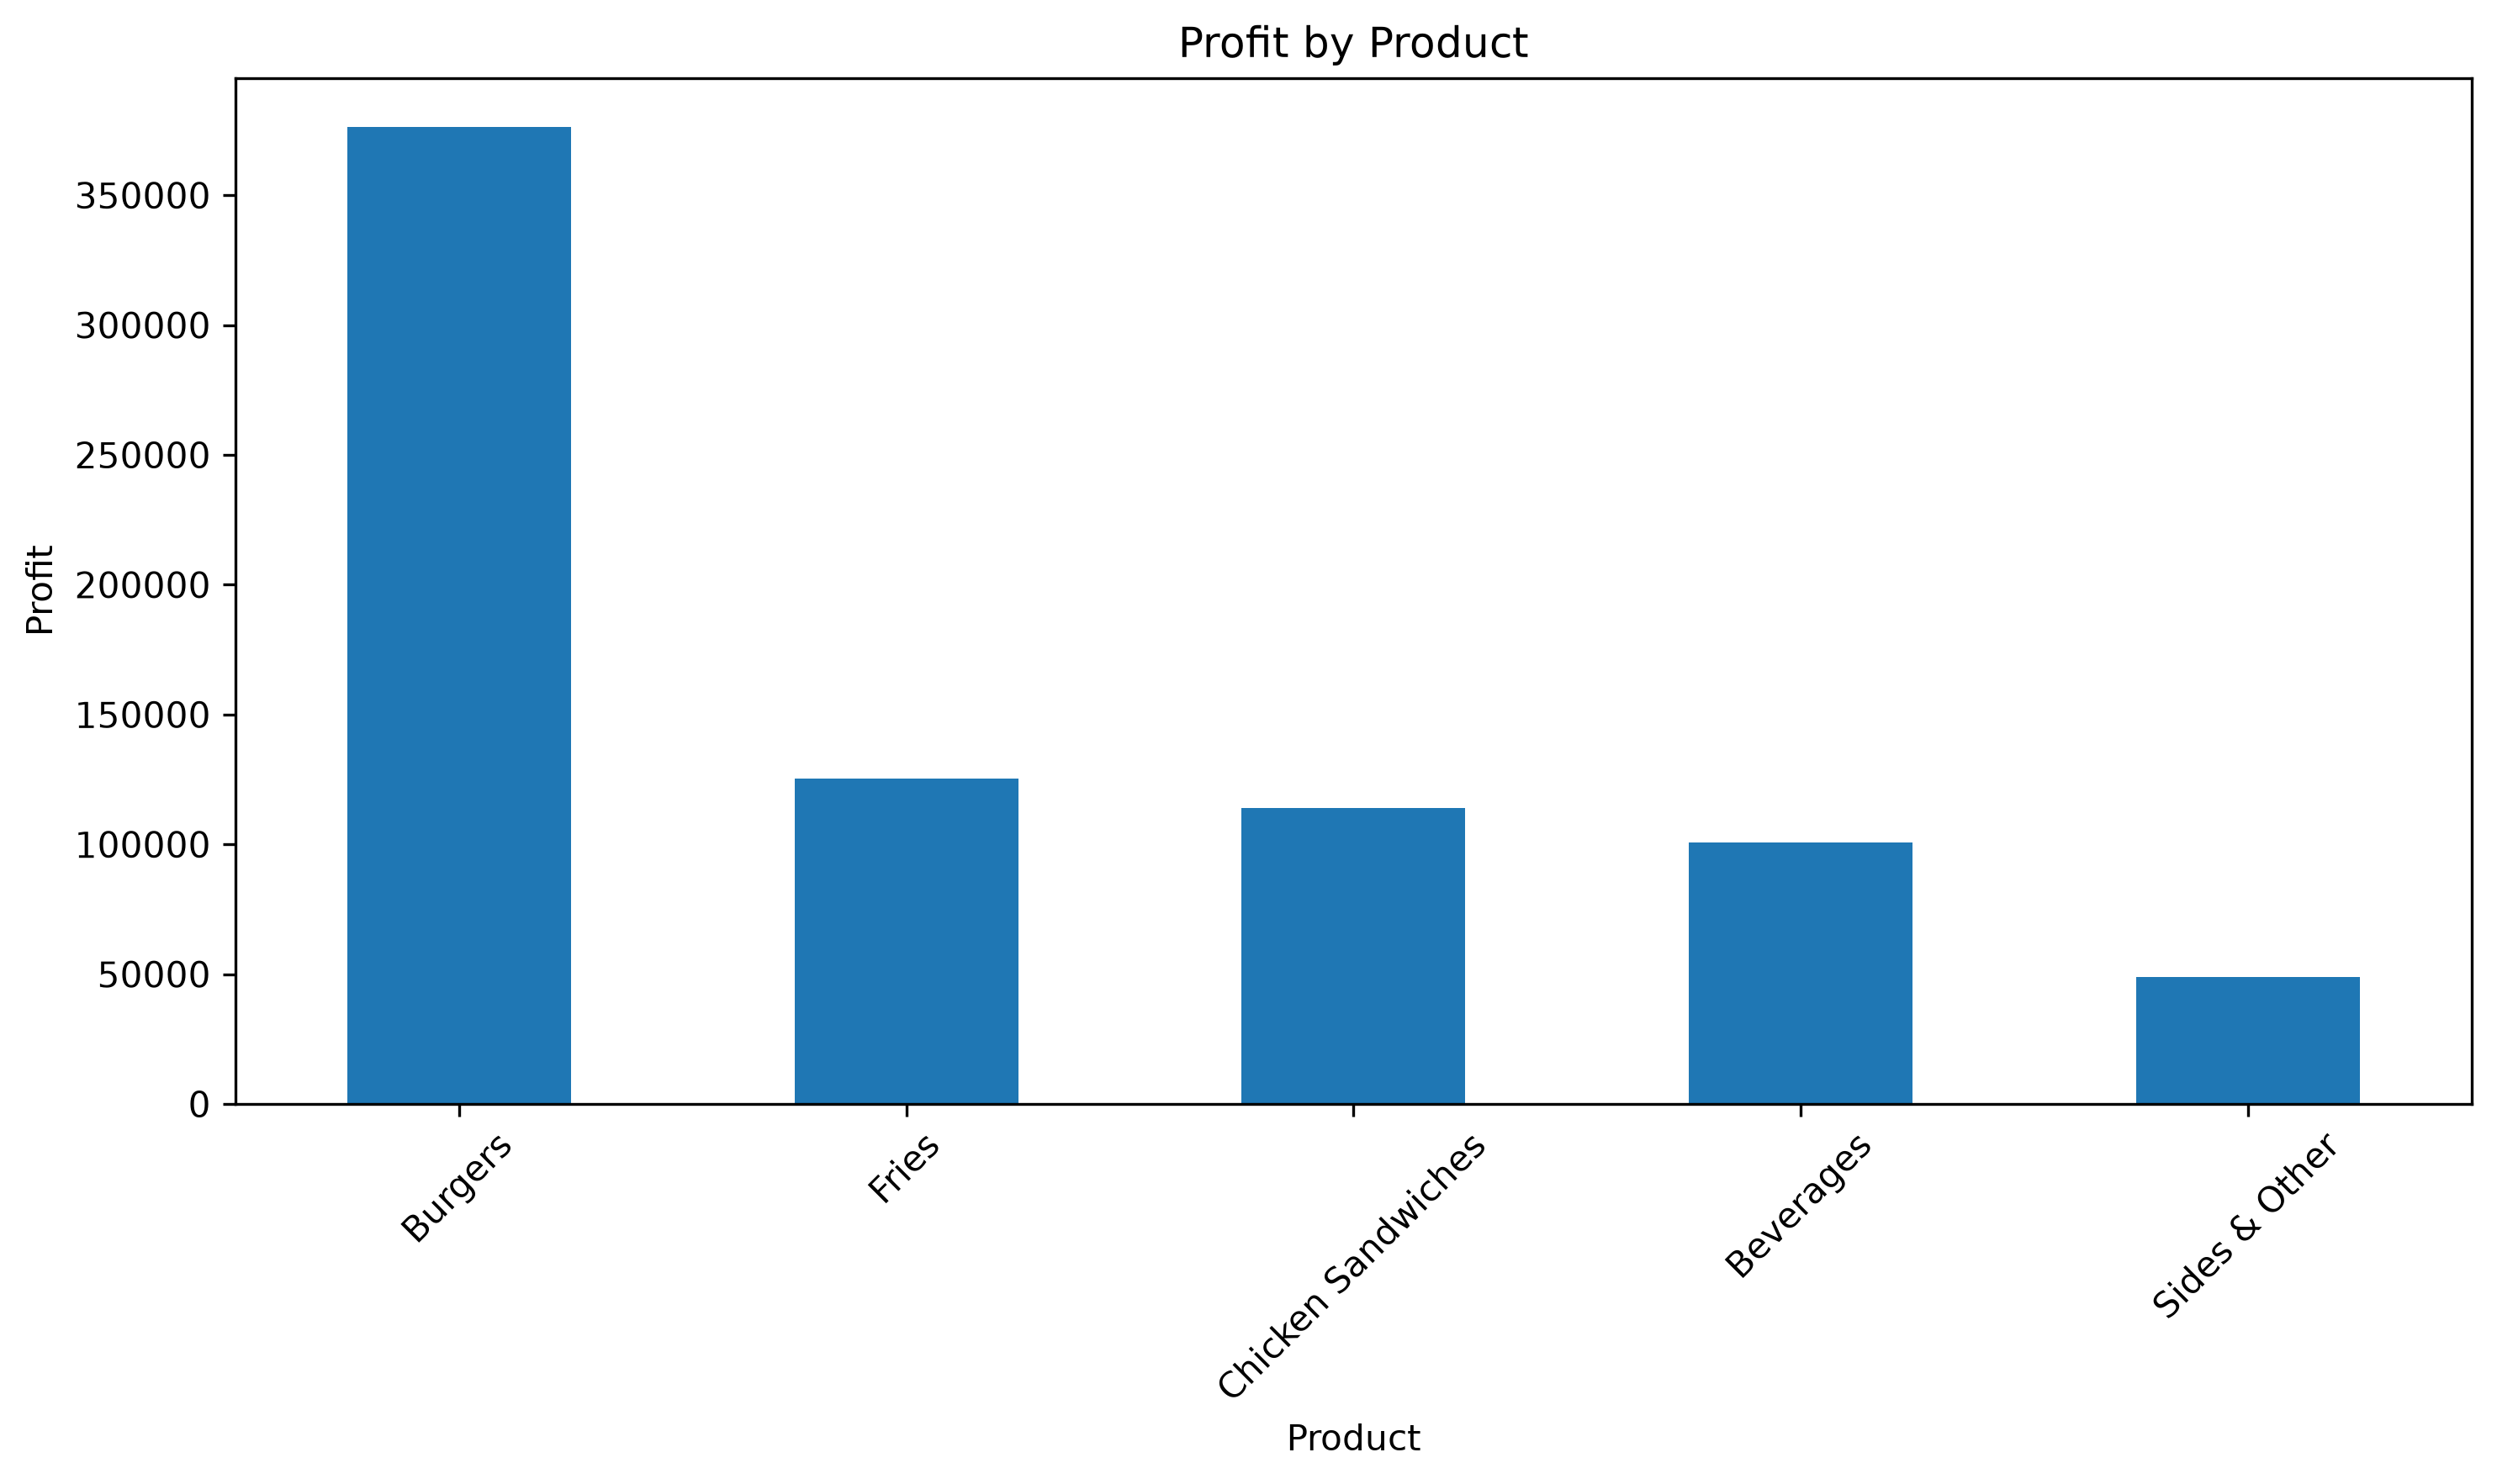
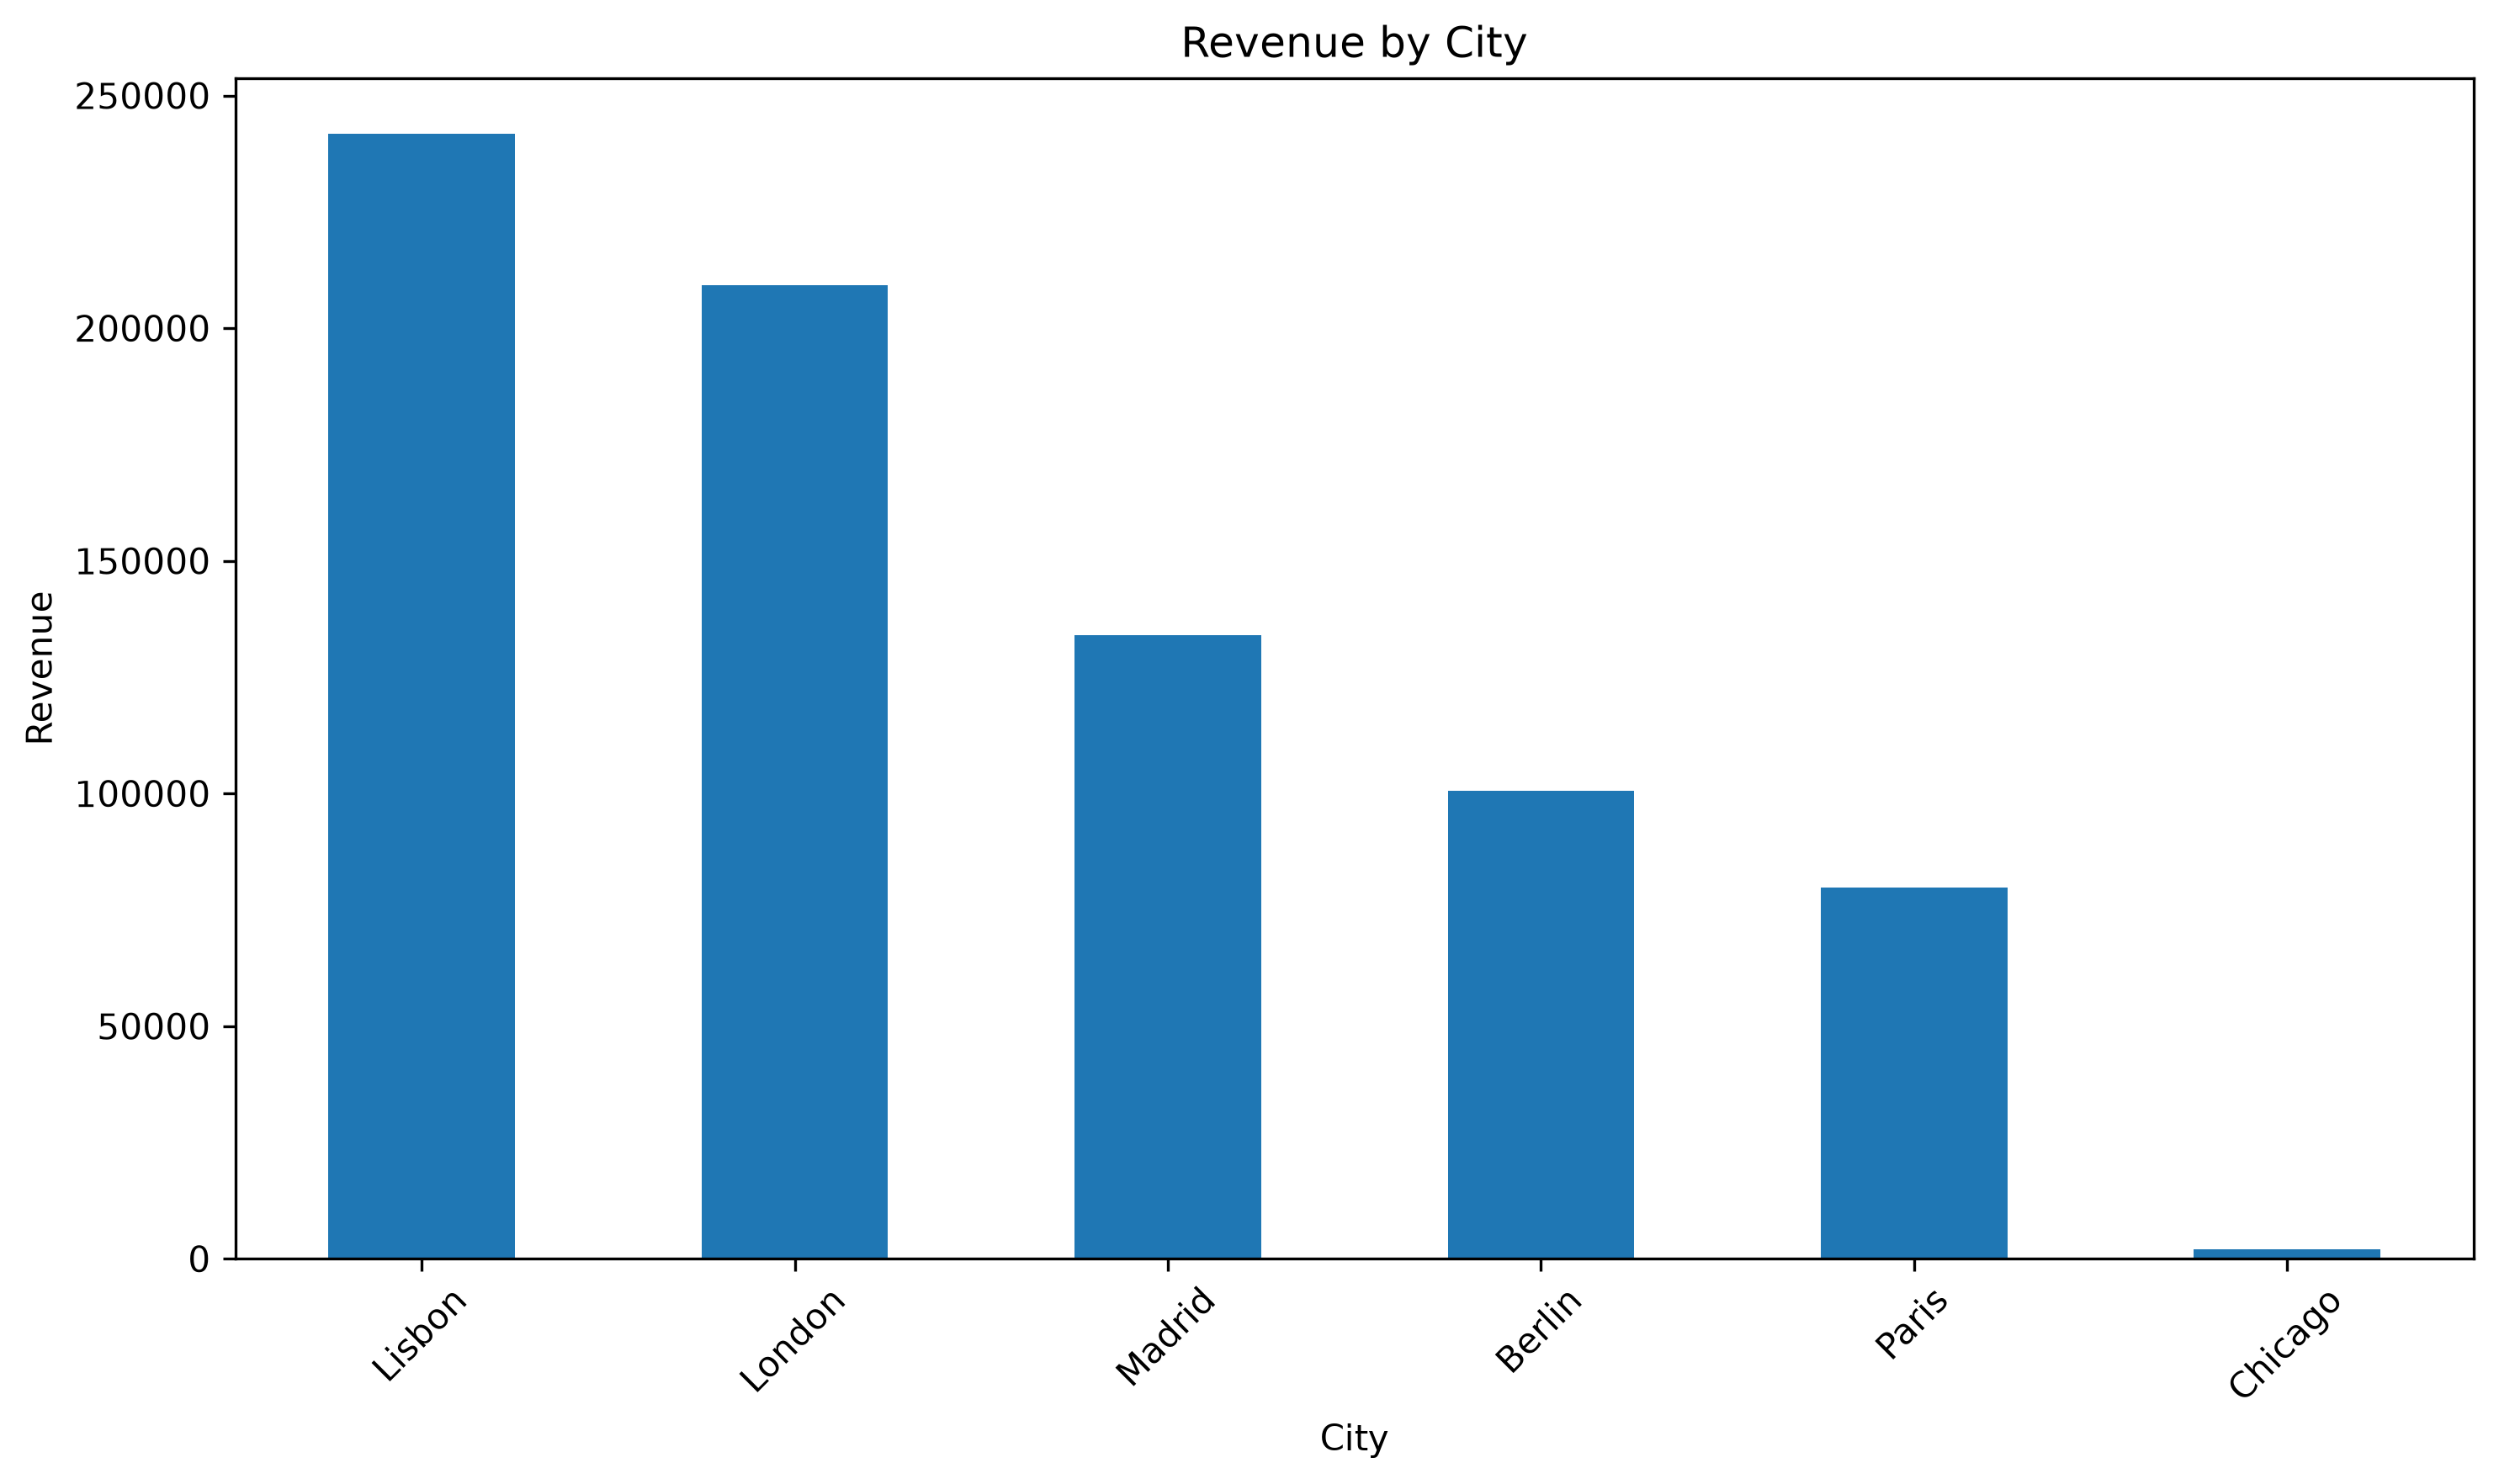
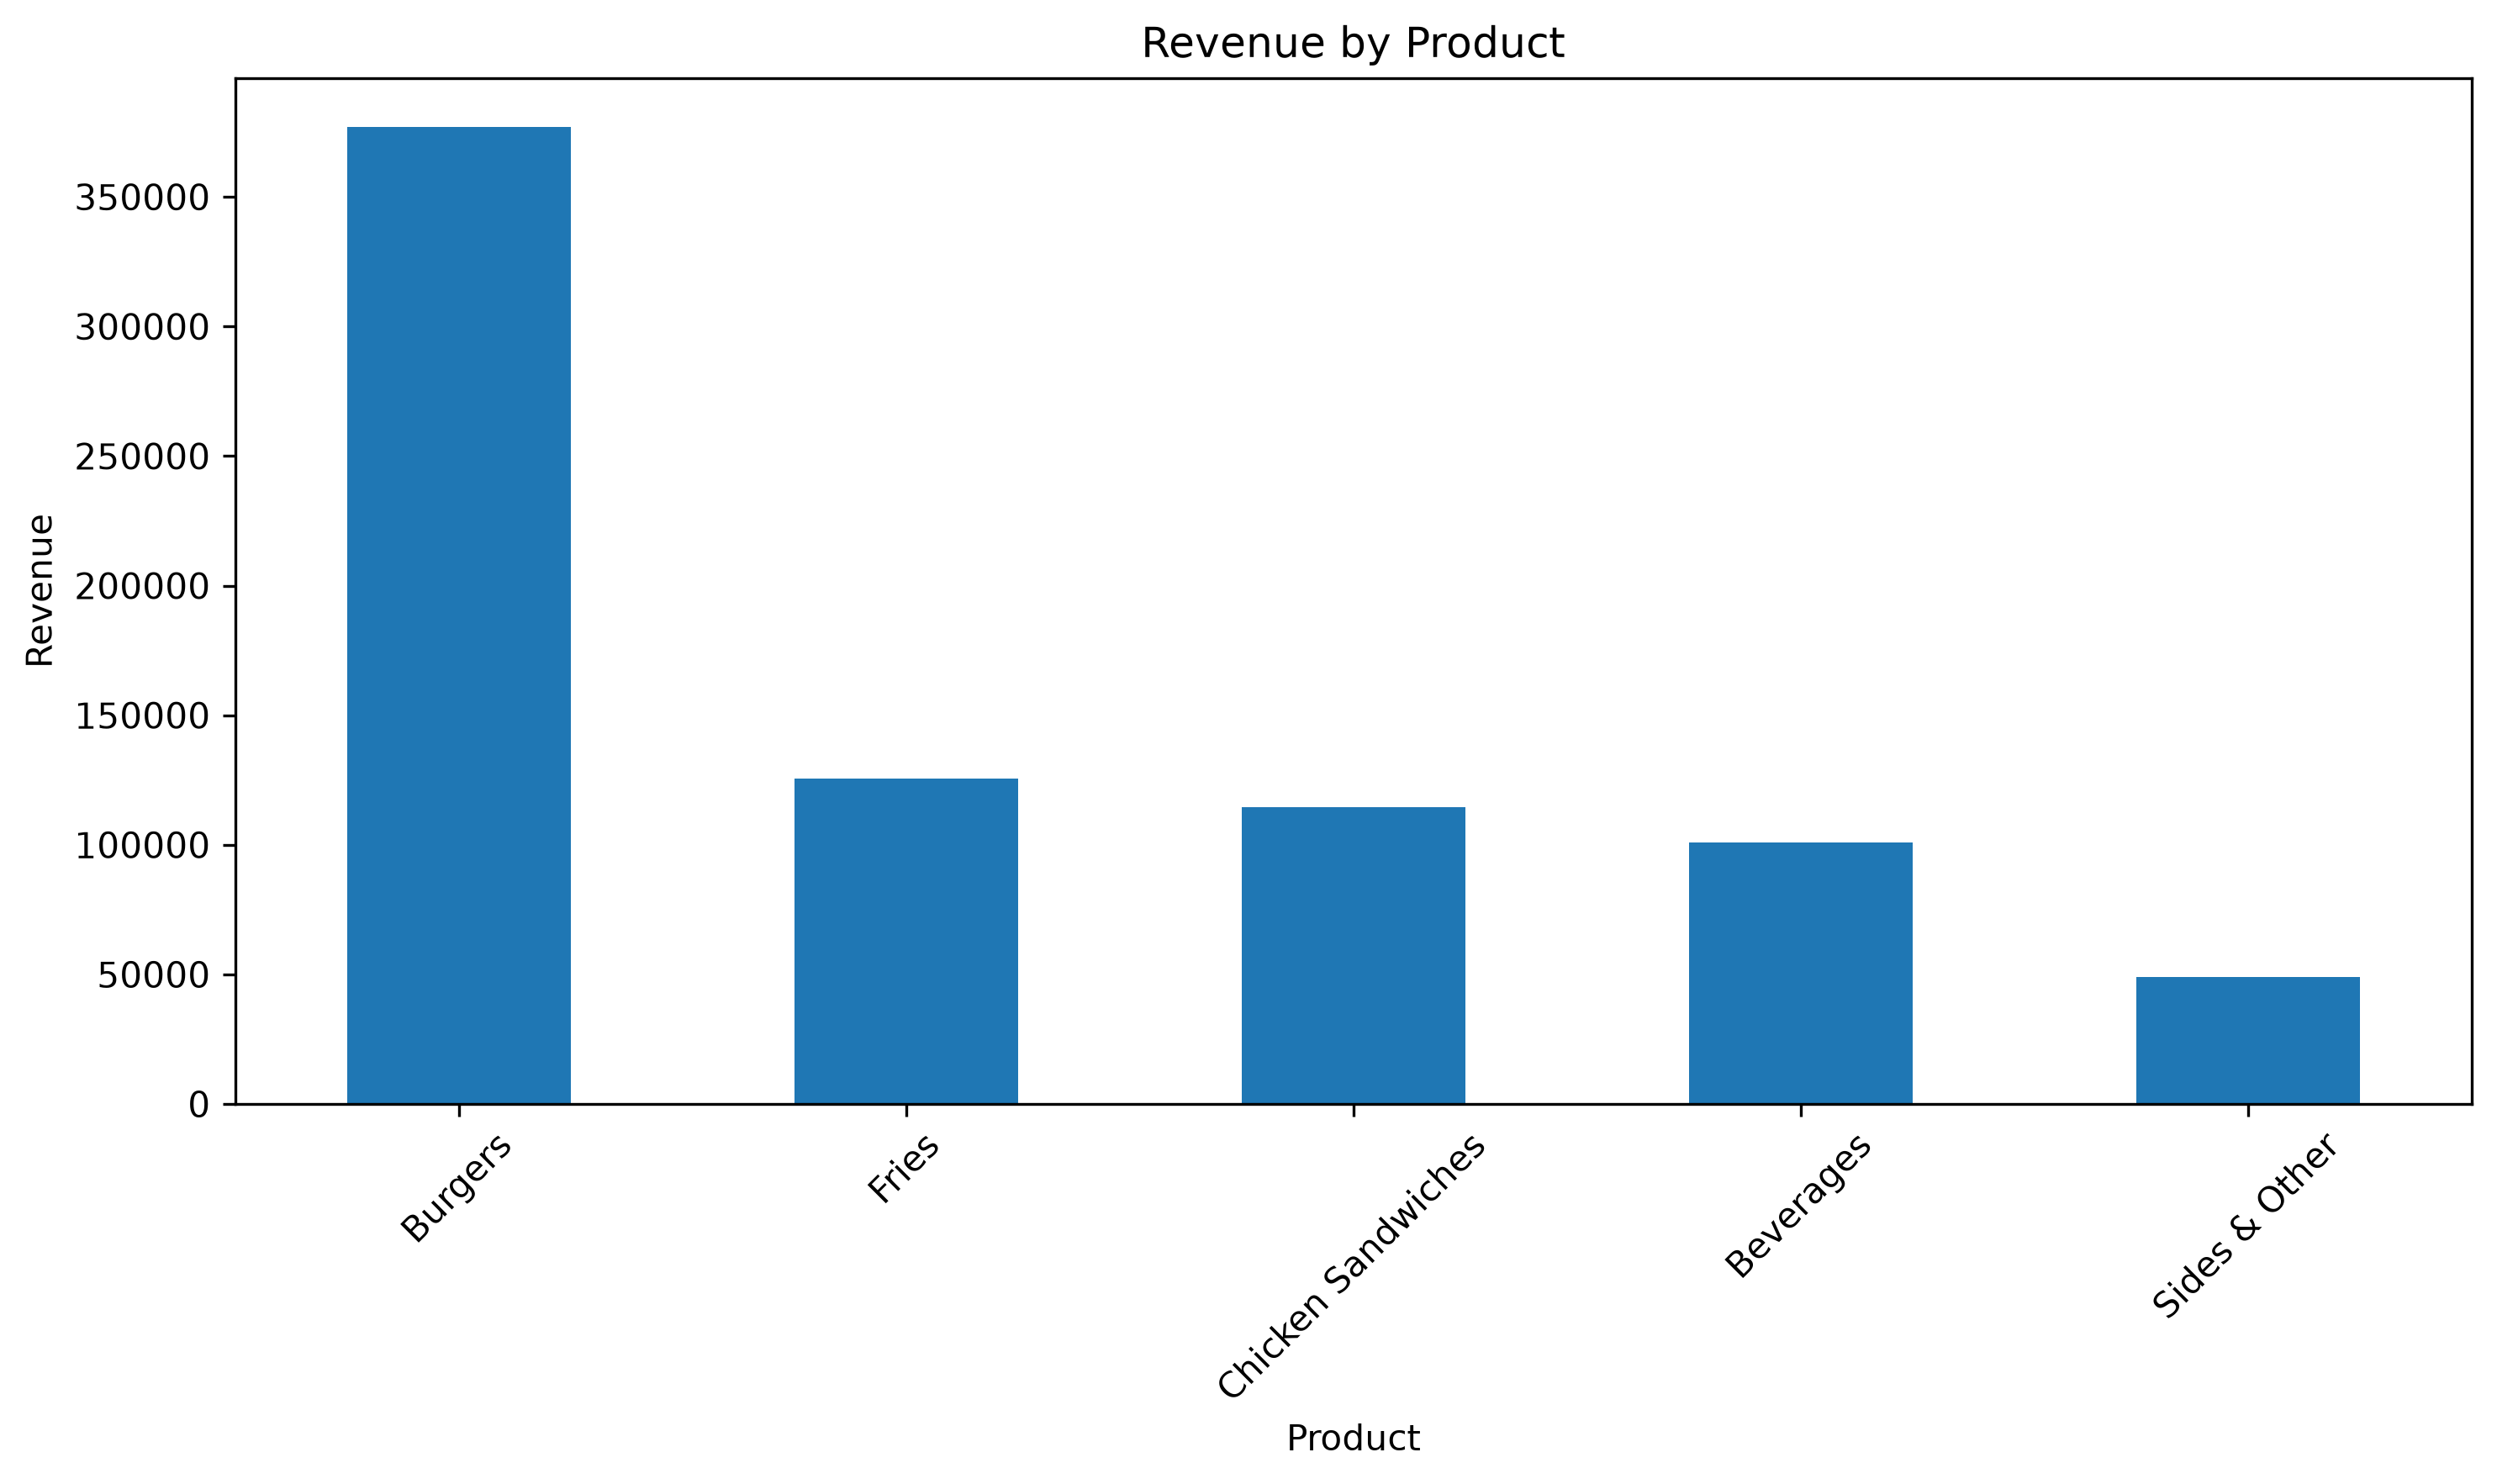
RestaurantIQ analyzes restaurant sales data to help identify revenue trends, profitable products, strong-performing cities, and unusual transactions. It provides an interactive Power BI dashboard together with Python-based analysis and machine-learning anomaly detection.
The project calculates key business metrics such as revenue, cost, profit, and profit margin, and presents the results through clear visualizations.
How we built it
The project uses Python, Pandas, NumPy, Scikit-learn, SQL, and Power BI. Python is used for data processing, analysis, visualization, and anomaly detection. The resulting analysis is connected to a Power BI dashboard for interactive business reporting.
The project is maintained in GitHub with the analysis scripts, dataset results, dashboard file, and visual outputs.
Challenges
One of the main challenges was turning raw restaurant transaction data into useful business insights while keeping the analysis understandable for a restaurant manager. Another challenge was combining traditional analytics with machine-learning-based anomaly detection.
What we learned
This project helped us understand how a real analytics workflow works from raw data to cleaning, analysis, visualization, machine learning, and business recommendations. It also showed how AI can be used to turn analytical results into more understandable actions for business users.
Future improvements
Future versions can include Gemini-powered natural-language business recommendations, sales forecasting, customer segmentation, automated dashboard refresh, and more advanced anomaly detection.

Log in or sign up for Devpost to join the conversation.