-
-
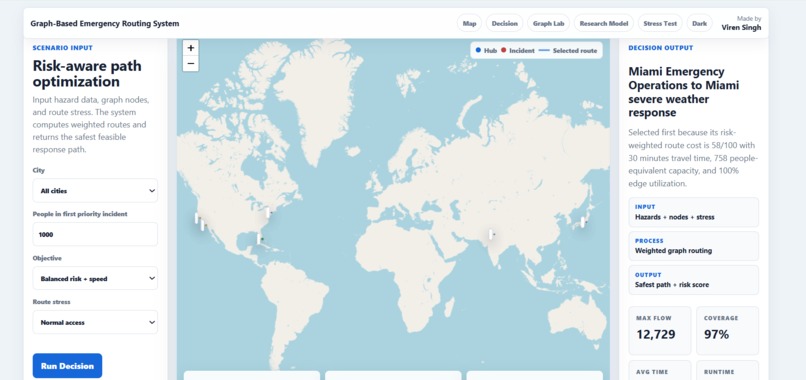
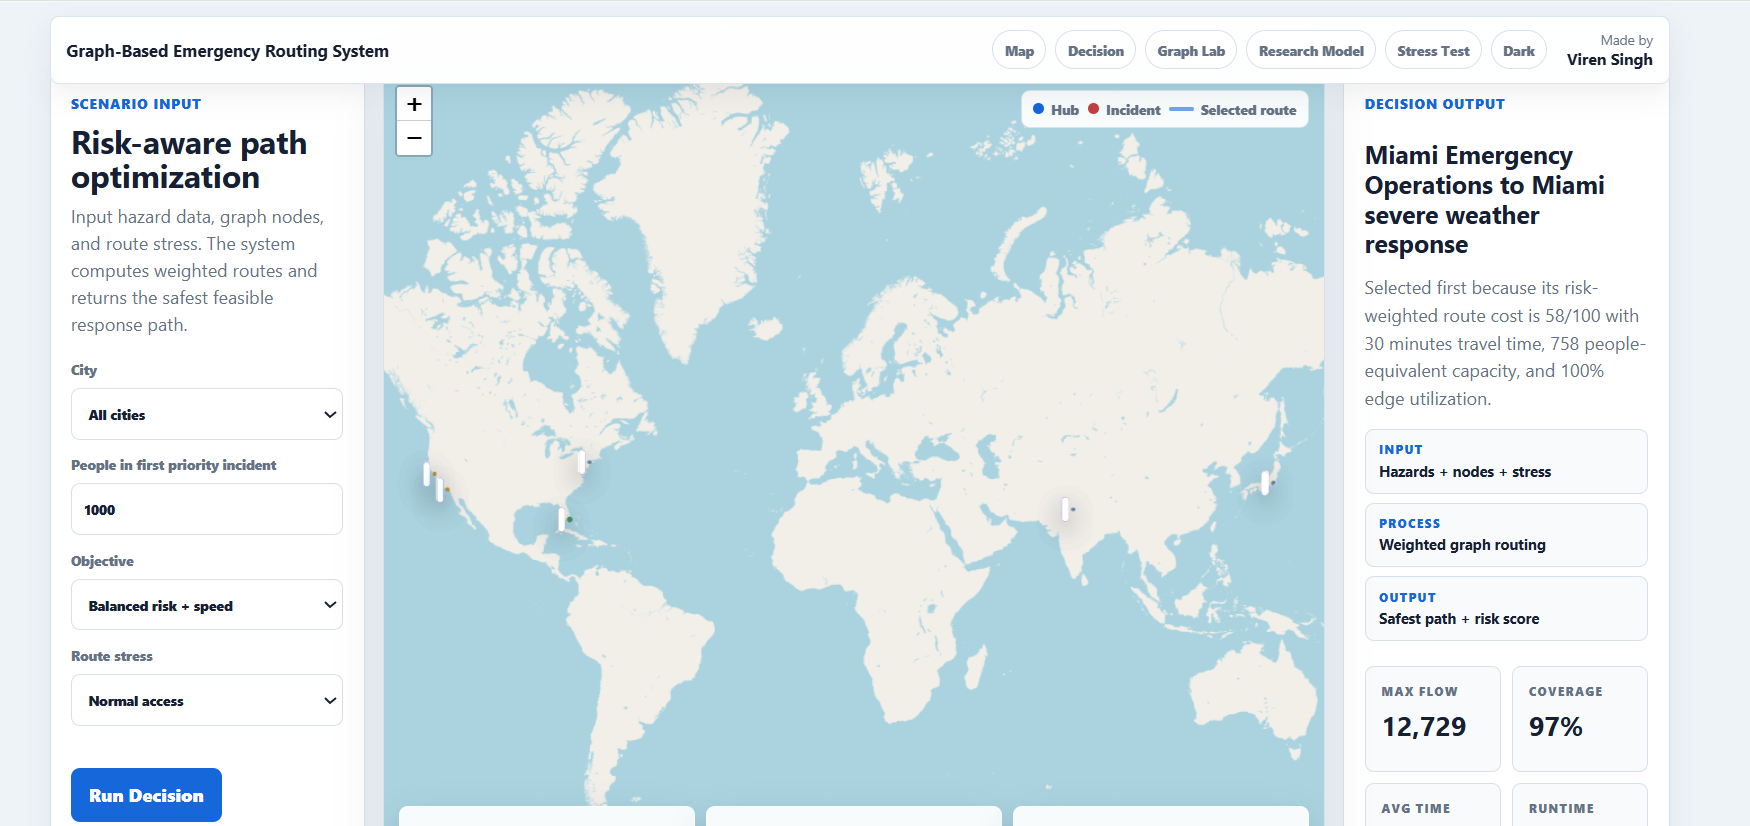
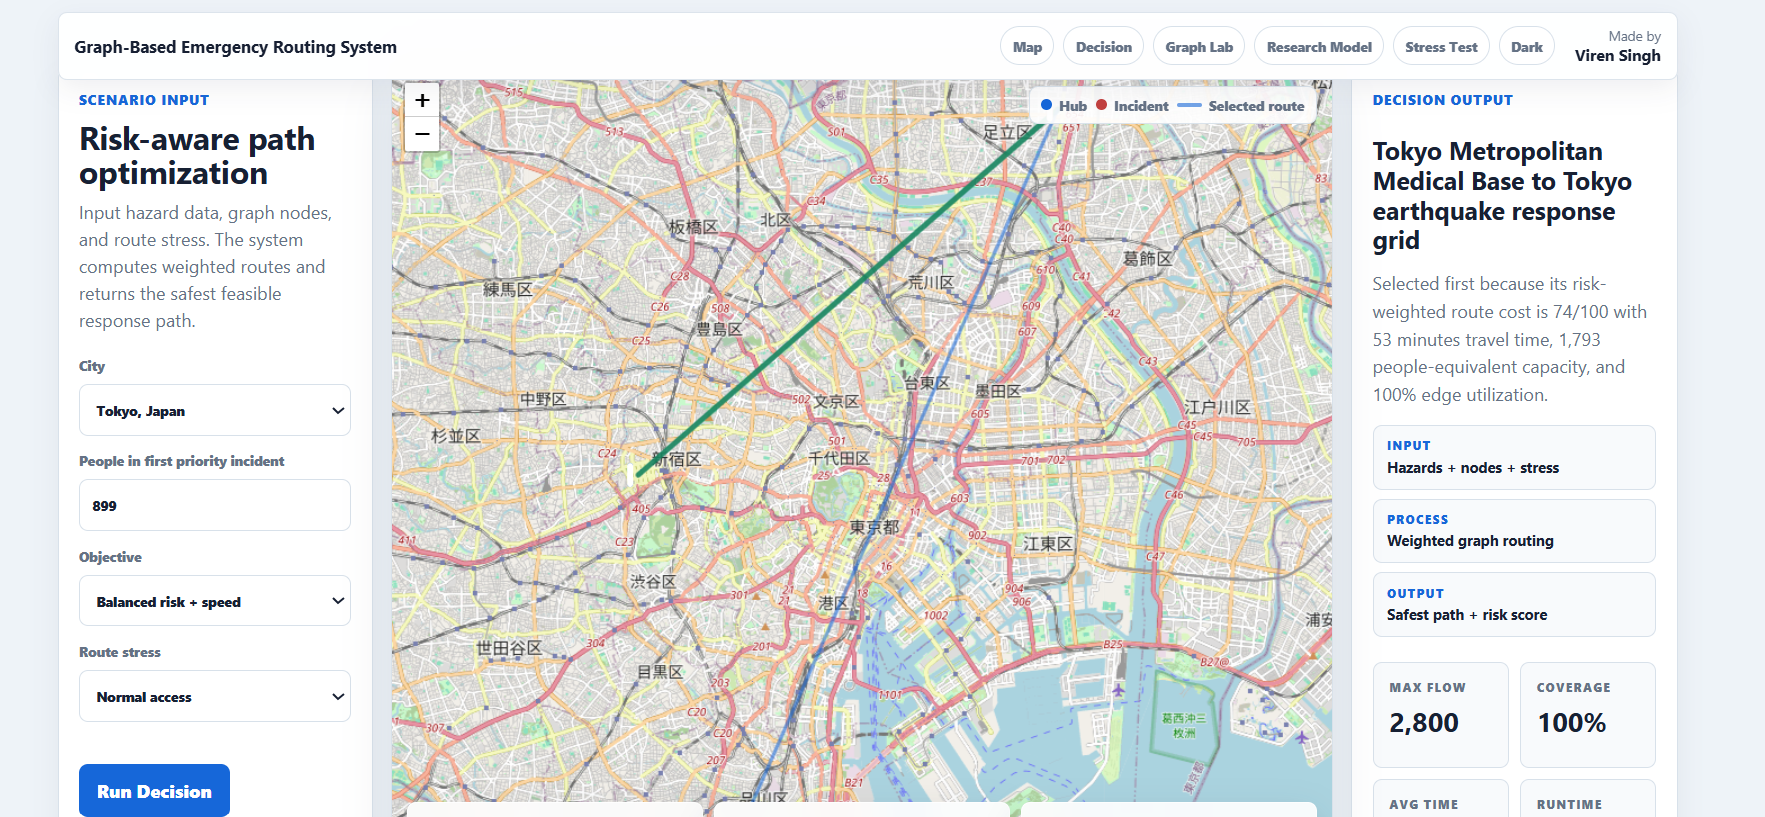
Live system dashboard showing optimized emergency response routing and resource allocation in real time.
-
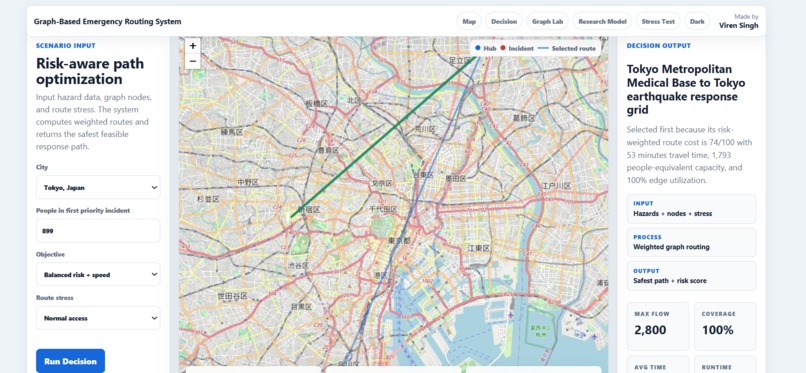
Live system dashboard showing optimized emergency response routing and resource allocation in real time.
-
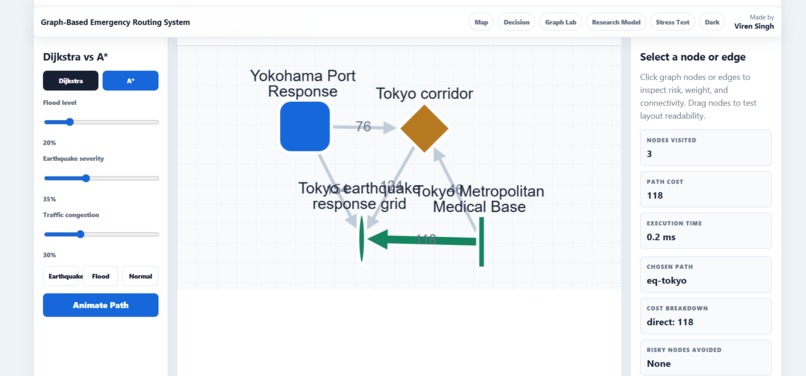
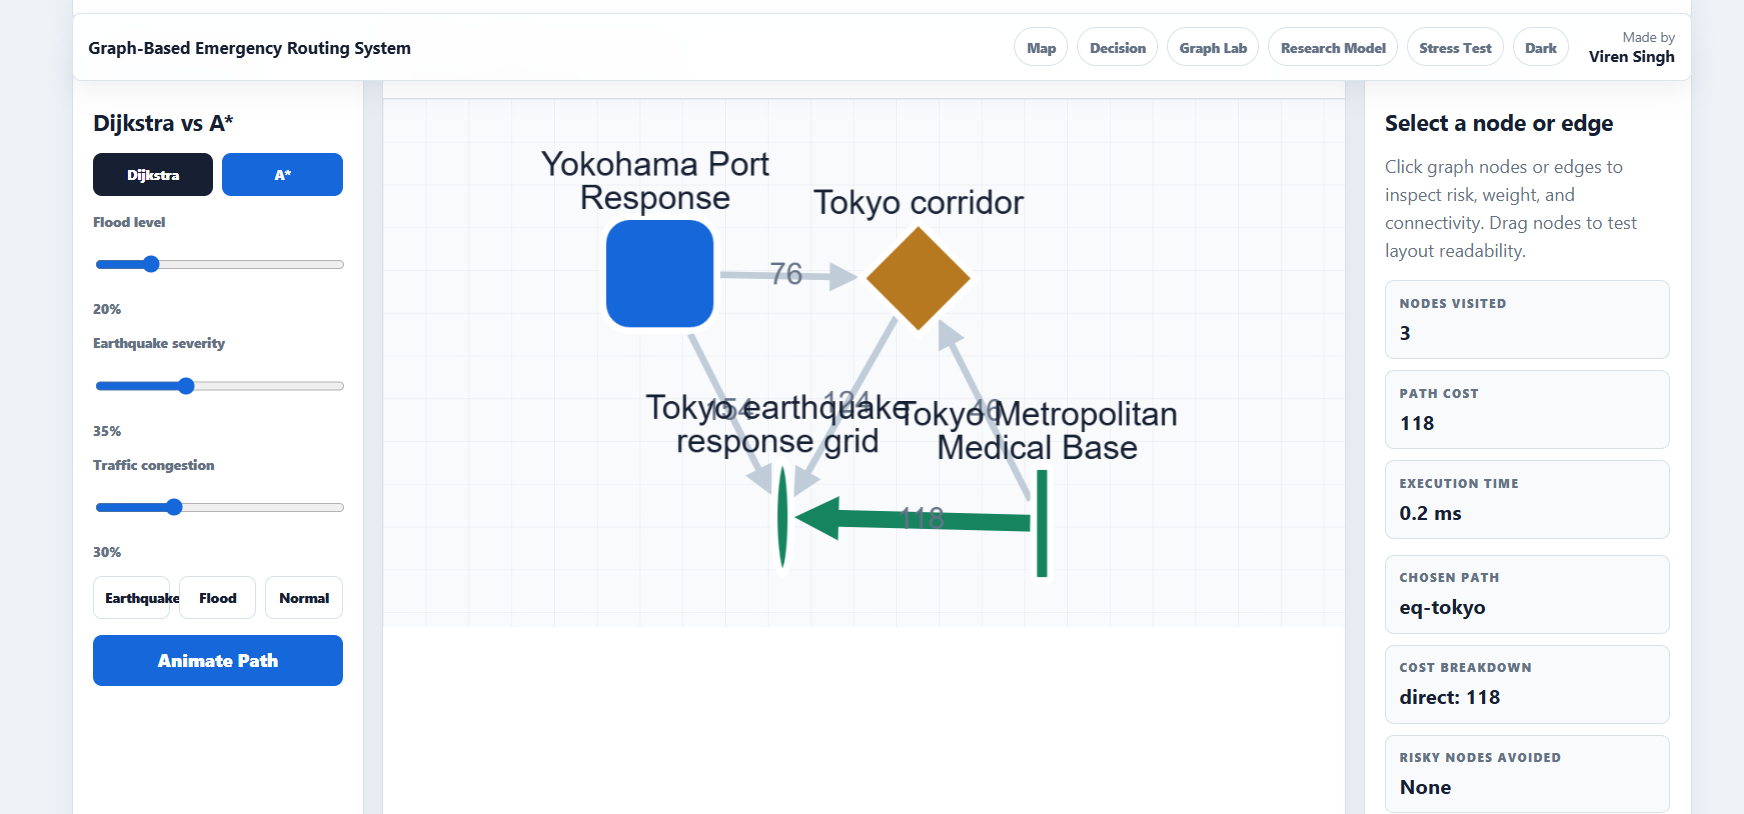
Comparison of Dijkstra and A algorithms for optimal pathfinding in a weighted graph of nodes and edges.
-
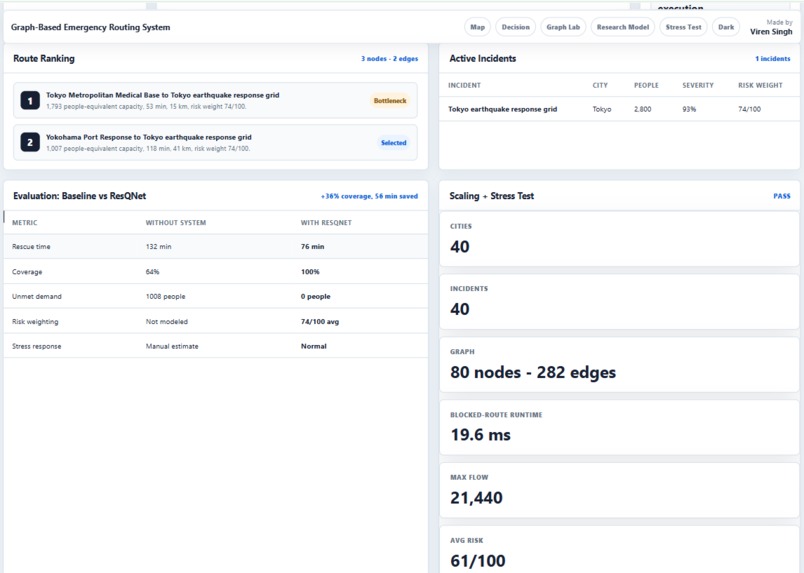
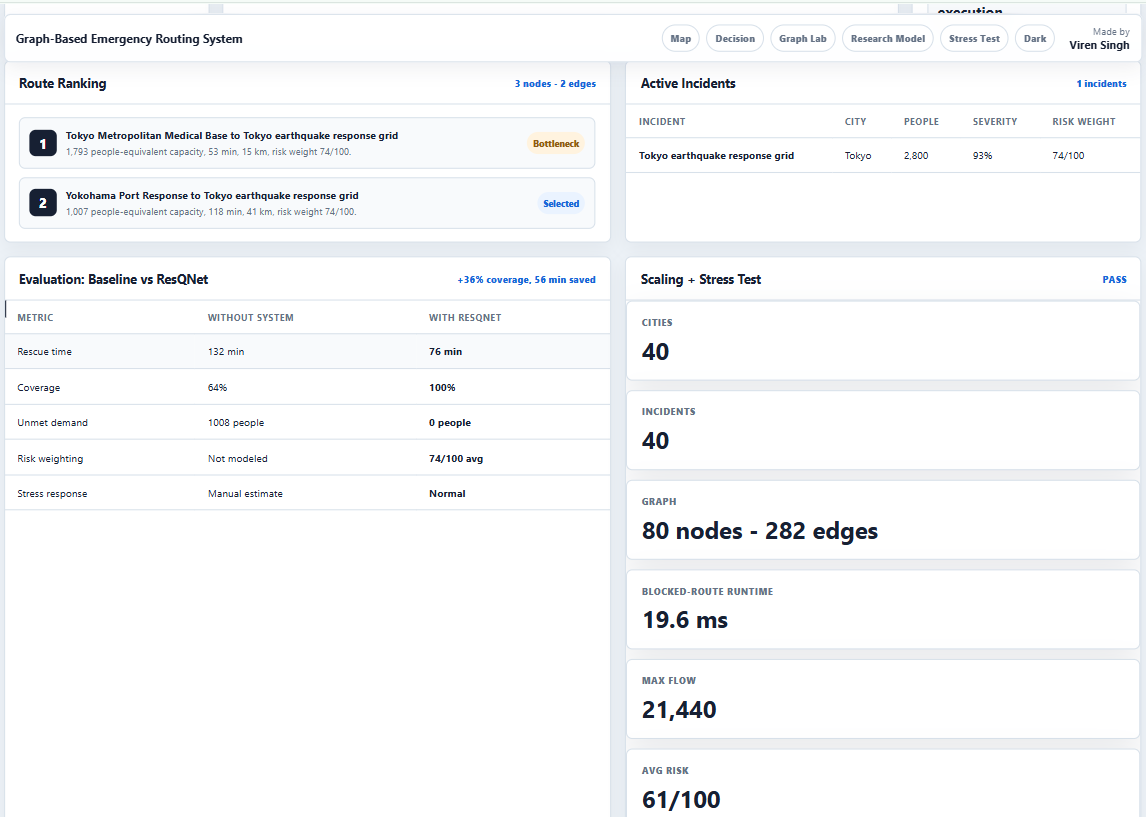
Stress level analysis comparing baseline conditions with ResQNet’s optimized intervention and decision routing system.
Inspiration
Disaster response suffers from a fatal latency: the gap between data acquisition and resource deployment. Existing systems operate on static, centralized protocols that fail under dynamic, chaotic conditions. When every minute dictates mortality rates, coordination delays and heuristic-based allocation models are no longer acceptable.
ResQNet was born from a singular hypothesis: What if a disaster zone could be modeled as a living graph, capable of optimizing itself in real-time against entropy?
What it does
ResQNet is not a dispatch tool—it is an autonomous resilience engine. It ingests multi-modal data (satellite imagery, social media streams, IoT sensor grids) and instantaneously models the affected geography as a weighted, dynamic heterograph.
Nodes: Population clusters, triage centers, supply depots.
Edges: Transport vectors (roads, bridges, UAV corridors) with time-variant weights for traversability, hazard levels, and bandwidth capacity.
The system executes multi-commodity flow optimization under uncertainty, simultaneously routing medical aid, heavy rescue, food, and communications assets. It prioritizes not by static triage tags but by an Urgency × Accessibility × Cascade Risk tensor.
How we built it
We built ResQNet as a three-layer system.
Layer 1: The Graph Model We represented the disaster zone as a dynamic network. Nodes = affected areas, depots, and triage centers. Edges = transport routes (roads, air corridors, waterways). Each edge carries real-time weights for accessibility, hazard level, and estimated travel time — updated continuously from satellite feeds, IoT sensors, and ground reports.
Layer 2: The Optimization Core The engine runs a multi-commodity flow solver that answers one question: Given limited resources, what allocation minimizes overall suffering? It prioritizes by urgency, accessibility, and cascade risk — not just distance. The solver recomputes every time the graph changes (new blockage, new demand, new supply). Written in Rust for sub-second latency.
Layer 3: The Uncertainty Filter We embedded a confidence estimator into every decision. If data is clean, the system optimizes aggressively. If data is noisy, it defaults to conservative, explainable routes. Human commanders can see why a route was chosen and override with one click.
Deployment: Runs on edge hardware (NVIDIA Jetson) inside mobile command vehicles. No cloud dependency. Dashboard built with Three.js for real-time 3D graph visualization.
Bottom line: We traded perfect accuracy for reliable speed and built a system that degrades gracefully when chaos hits.
Challenges we ran into
One of the main challenges was modeling real-world disaster environments accurately while keeping the system computationally efficient. Handling dynamic changes in network conditions and ensuring stable routing under uncertainty was also difficult.
Another challenge was balancing system complexity with usability for real-world deployment scenarios.
Accomplishments that we're proud of
We are proud that ResQNet evolved from a conceptual model into a working system with real-world validation, including usage by external stakeholders and recognition in research form. The project also demonstrates practical application of graph theory and optimization in crisis response scenarios.
What we learned
This project strengthened our understanding of graph algorithms, optimization techniques, and system design under real-world constraints. It also improved our ability to translate theoretical models into usable systems with practical impact.
Most importantly, we learned how to design AI systems that prioritize real-world usability over theoretical complexity.
What's next for resQnet
Next, we aim to improve ResQNet by integrating predictive AI models for disaster forecasting, enhancing real-time data ingestion, and expanding deployment potential through partnerships with NGOs and emergency response organizations.


Log in or sign up for Devpost to join the conversation.