Inspiration
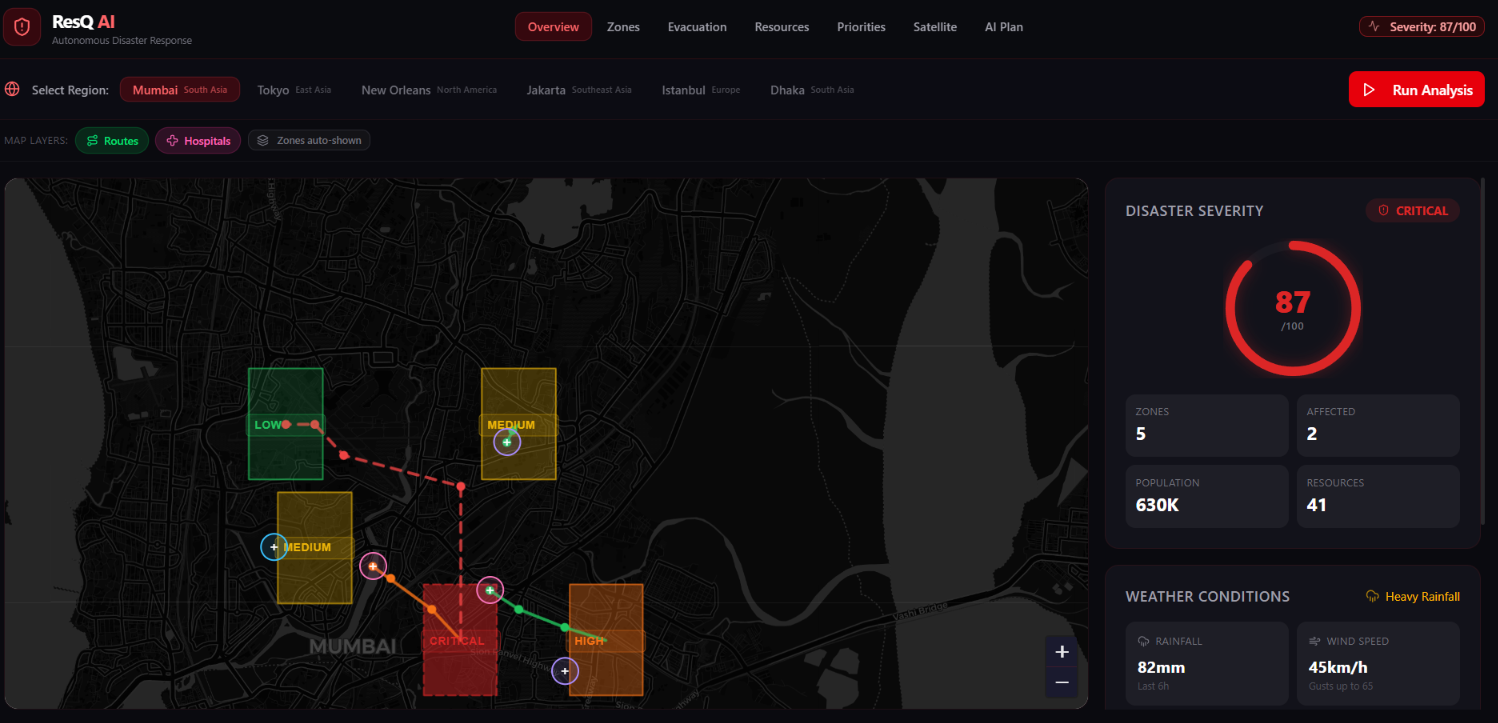
Disasters — floods, earthquakes, storms — don't wait for slow, manual coordination. Emergency response teams often lose critical time piecing together weather data, satellite imagery, and ground reports from scattered sources before they can even start planning evacuations. We wanted to see what it would look like if an AI could instantly fuse all of that into one clear, actionable command dashboard — something that feels like a mission control center for disaster response.
What it does
ResQ AI is an autonomous disaster response platform that:
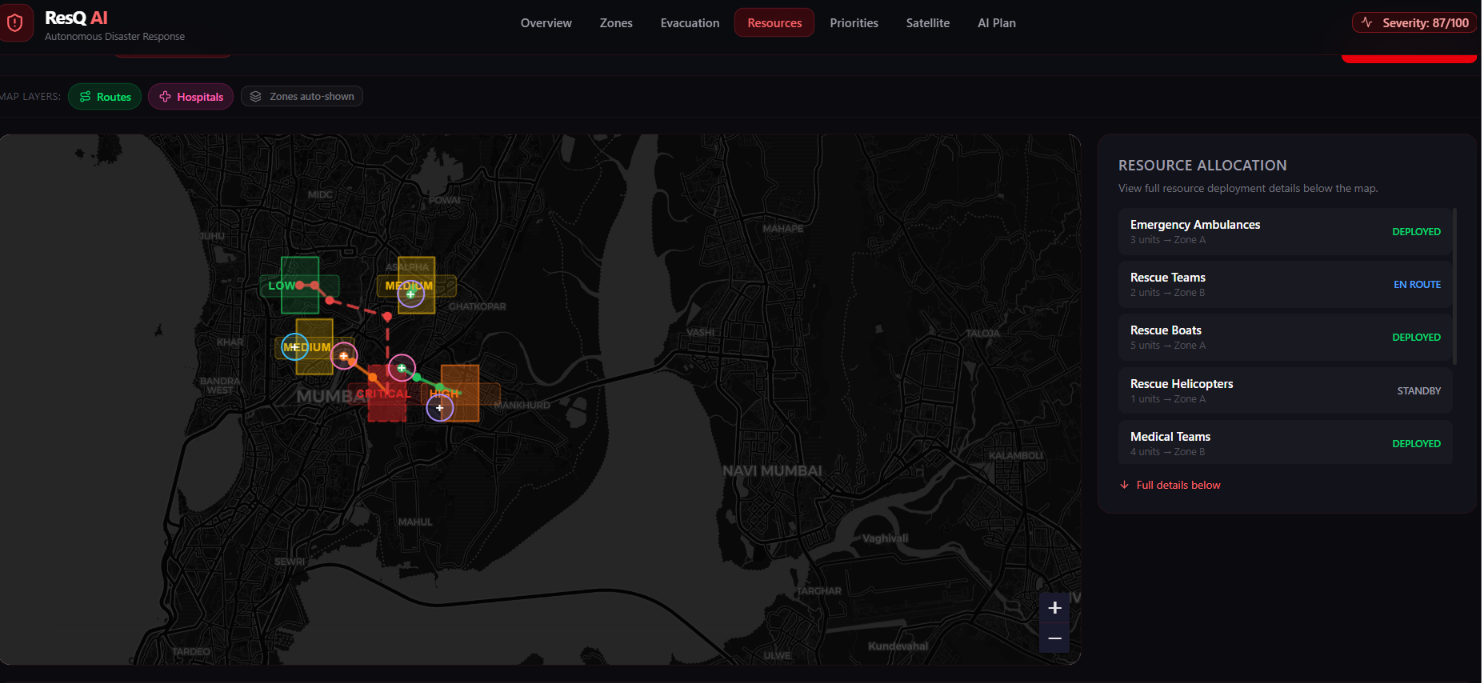
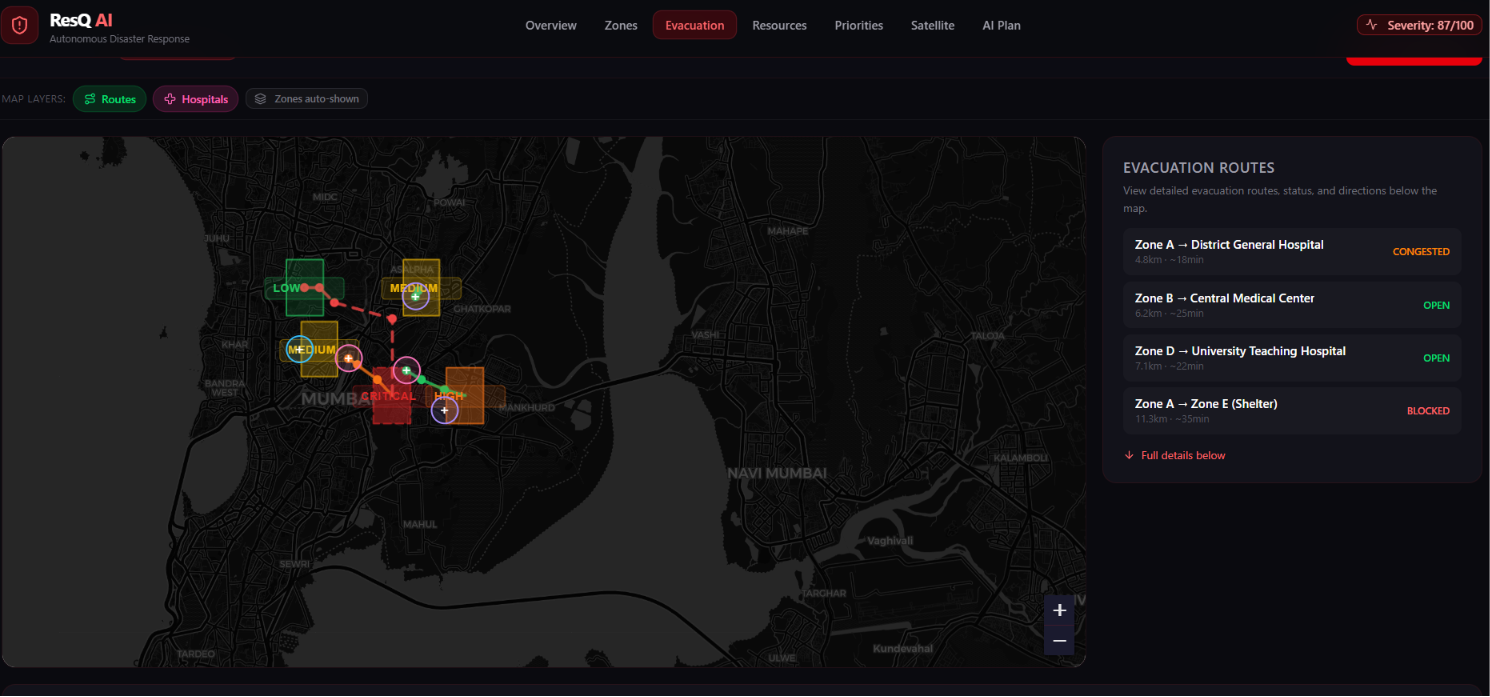
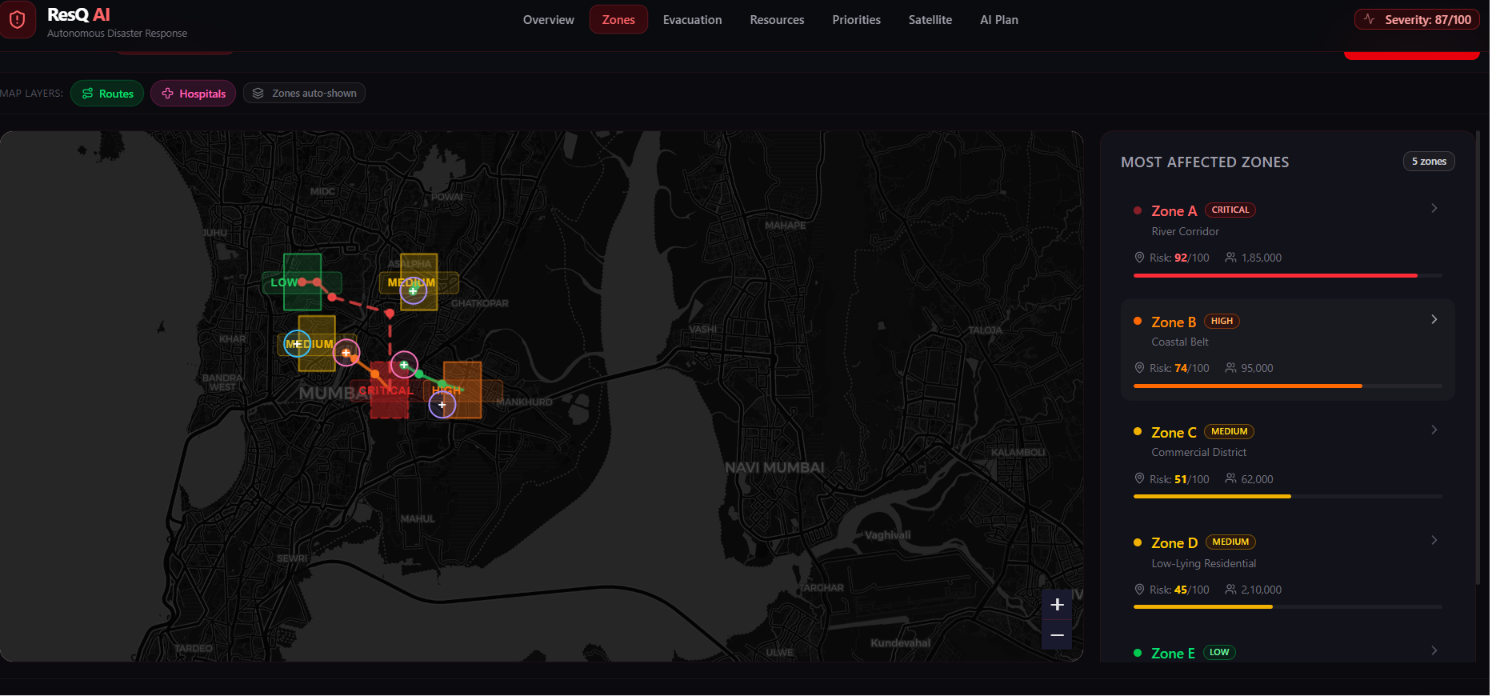
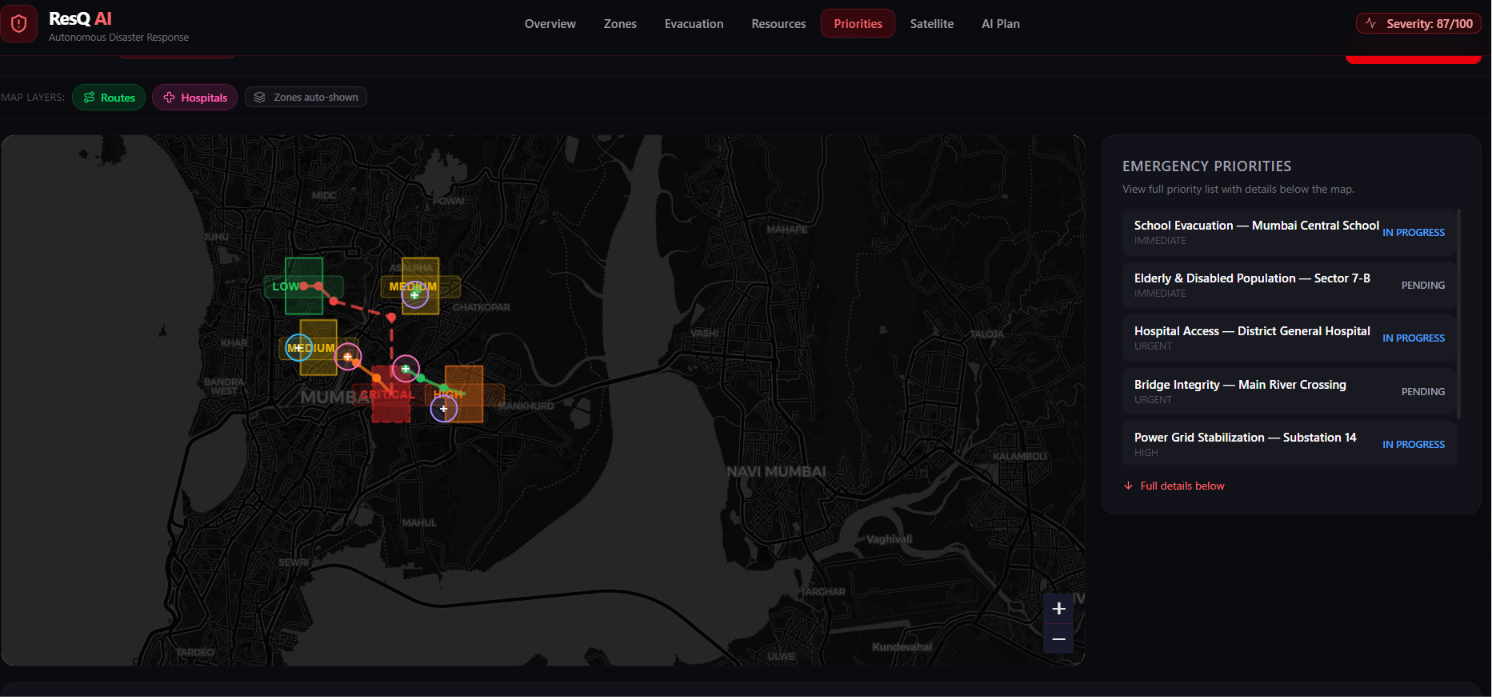
Analyzes real-time weather conditions (temperature, humidity, wind speed, rainfall, visibility, pressure) for a selected disaster zone Detects and scores risk zones on an interactive map, classified by severity (critical / high / medium / low) along with estimated affected population Compares before/after disaster imagery to detect changes — flooding extent, structural damage, road submersion, debris — and outputs a confidence-scored damage assessment Generates optimized evacuation routes between affected zones and the nearest hospitals, flagging routes as open, congested, or blocked Tracks emergency resources (ambulances, rescue boats, helicopters, medical teams, shelters, supplies, volunteers) and their deployment status in real time Ranks response priorities by urgency so responders know exactly what to act on first Produces an AI-generated emergency response plan summarizing the full situation for decision-makers How we built it
The app is built with Next.js 16 (App Router), React 19, and TypeScript, styled with Tailwind CSS and shadcn/ui components for a clean, dark command-center aesthetic. Maps are rendered with Leaflet/react-leaflet, and data visualizations use Recharts. State is managed with Zustand, and forms/validation run through React Hook Form + Zod.
On the backend, Next.js API routes simulate the AI analysis pipeline — one endpoint returns severity scoring, zone risk data, weather conditions, evacuation routing, and resource allocation for a given disaster area; another handles before/after image analysis and returns structured damage assessments. This design keeps the architecture ready to swap in real computer-vision and weather APIs behind the same interface.
Challenges we ran into Type-safe geospatial data: keeping map coordinates strictly typed as [lat, lng] tuples (instead of loose number arrays) while composing evacuation route paths from multiple zone and hospital points Deployment configuration drift: the project was originally scaffolded with a custom server setup (standalone Node server behind a Caddy reverse proxy, SQLite with a hardcoded local path) that didn't translate directly to serverless hosting — this required stripping out unused infrastructure (Prisma, next-auth, custom build scripts) and simplifying the config to a standard Next.js deployment Designing a UI that communicates urgency at a glance — balancing information density (multiple zones, routes, resources, priorities) with clarity under simulated crisis conditions What we learned How to structure a multi-domain dashboard (maps, weather, imagery, logistics) around a single coherent data model The importance of keeping deployment infrastructure decoupled from application logic, so the same codebase can move cleanly between hosting environments How disciplined TypeScript typing (tuple types for coordinates, discriminated unions for status fields) catches real bugs before they ever reach production What's next for ResQ AI Connecting real weather and satellite imagery APIs in place of the simulated data layer Adding live computer-vision-based damage detection from uploaded disaster imagery Multi-user coordination features so multiple response teams can update resource status simultaneously Historical disaster playback and post-incident reporting
Built With
- leaflet.js
- next.js
- react
- react-hook-form
- recharts
- shadcn/ui
- tailwind-css
- typescript
- zod
- zustand


Log in or sign up for Devpost to join the conversation.